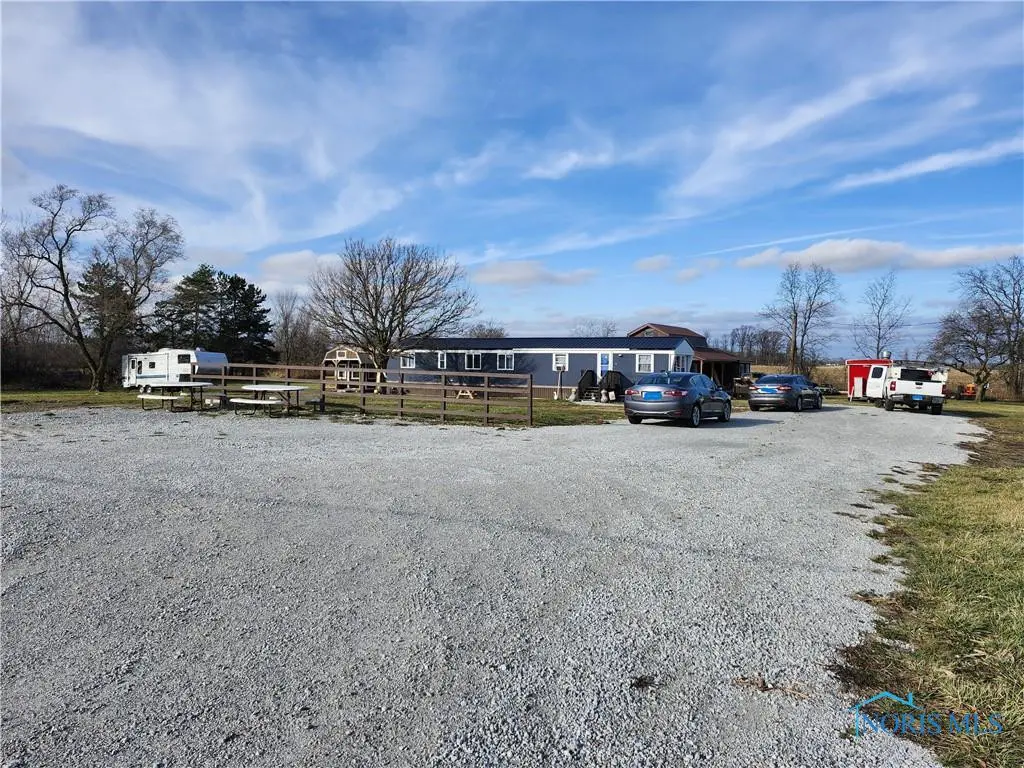
23652 Us Highway 224 · Fostoria, OH
Flood risk 1/10 · Minimal
- FEMA flood zone
- X (unshaded)
- Chance of flooding over 30 yrs
- 0.0%
- Est. flood insurance / yr
- $507 – $1,088
Fire risk 1/10 · Minimal
- Est. fire insurance / yr
- $713 – $1,323
Heat risk 3/10 · Minor
- Hot days now (above 99°F)
- 7 days/yr
- Hot days in 30 yrs
- 17 days/yr
Wind risk 2/10 · Minimal
- Chance of severe wind over 30 yrs
- 0.0%
Air-quality risk 2/10 · Minimal
- Unhealthy air days now
- 1 days/yr
- Unhealthy air days in 30 yrs
- 2 days/yr
Risk factors via First Street. Map © Google.
Why this score? — see what drove the D grade
The composite is a weighted blend of 9 inputs, each scored 0–100. Each bar is that input's sub-score; the figure is the points it added to the 100-point composite (weight × sub-score).
- Appreciation +8.4/10.0
- Cash flow +8.1/30.0
- ARV discount +7.5/15.0
- Schools +6.0/10.0
- Livability +3.8/5.0
- Rent growth +2.5/5.0
- Condition / age +2.5/5.0
- DSCR +2.2/10.0
- 1% rule +1.3/10.0
$200,000
🖨 Deal sheet (PDF) 📄 Offer letter ✓ Due diligence
Listing remarks MLS
5 acres with Approximately 870 feet of frontage on US 224. Multi-family property featuring a 64 x 14 mobile home and a 48 x 20 cabin. great potential for commercial development and / or additional mobile units. Selling As-IS.
Key facts
- Mobile home
- Cabin
- 5 acres
Tags
Neighborhood map
What this means for you Summary
Snapshot
- This is a 3-bed/2.0-bath manufactured listed at $200k.
Deal economics
- At list price, monthly cash flow is $-193 ($-2k/yr) — negative.
- To cash-flow at today's rent, offer at most $166k (17.1% below list).
- To meet the 1% rule (rent ≥ 1% of price), the offer needs to be $125k (37.4% below list).
- Recommended offer: $125k (37.4% below list) — sets the bar for 1% rule.
Location & tenants
- Location reads 76/100 on livability (#216 in OH, #3,330 nationally) — a middle-class / working-renter tenant base. Strengths: cost of living A+, housing A+, health & safety A+; Watch: commute F, employment D-.
- Arcadia Local (rural): math 65% / reading 77% proficiency, ranked #144 of 656 in OH (top 22%) — strong family-tenant draw, lease renewals of 3-5y typical.
- Zoned schools: Arcadia Elementary School (math 77% / reading 82%, grade A, #173 of 1,584 statewide, top 12%, 296 students, 0% FRL); Arcadia Middle School (math 52% / reading 67%, grade B, #271 of 654 statewide, top 43%, 99 students, 0% FRL); Arcadia High School (math 54% / reading 74%, grade B-, #164 of 781 statewide, top 24%, 199 students, 97% FRL).
- Market conditions: 2 active listings in the ZIP; 257 units permitted in Hancock County in 2024 (150 in 5+ unit buildings).
Forward outlook
- In year one you build about $15k of equity ($1k loan paydown + $14k appreciation (6.8% local appreciation)).
- Hancock County population projected to shrink 4% by 2050 — rents likely to lag national; underwrite the cash flow, not the appreciation.
- By year 3, paydown + projected appreciation supports a ~$37k cash-out refi (75% LTV) — recoverable capital for the next deal without selling this one.
Negotiation context
- It's been on market 547 days — a 12% lower offer ($176k) is reasonable based on typical stale-listing flexibility.
- 3 sale attempts since 14y ago; this cycle's ask has dropped $15k (7%) from the opening price — seller is motivated, your offer sets the floor, not the list.
- Current owner paid $96k; list at $200k implies a 107% gain — meaningful room to come down on a strong offer.
Questions for the listing agent
- What do current leases actually rent for vs. the listed asking? Can we see a recent rent roll and the last 12 months of T-12 income?
- It's been on market 547 days. Have you received any prior offers? Is the seller open to a 37% concession, seller financing, or rate buy-down credit?
- Why hasn't it sold? Are there any deal-killer items the seller is aware of (foundation, flood, title, zoning, code violations)?
- Is there a deadline driving the sale (1031 exchange, divorce, estate, relocation)? That informs how much negotiation room exists.
- Schools are D-rated, which usually means shorter tenancies and higher turnover. Who's the typical renter profile here, and what's been the actual vacancy rate?
- The area grade is low — what's the realistic commute time and amenity access for the typical tenant pool here? Any planned neighborhood developments (good or bad) we should know about?
- What's the average days-on-market for RENTAL listings here right now (not sales)? A rising rental-DOM trend means longer vacancies and softer asking-rent achievability than the comps imply.
- What's the recent tenant-quality profile in this submarket — average credit score on applications, eviction rate, late-payment / NSF rate, and stable-employment percentage? A property-management company in the area should have these aggregated.
- How much new for-sale + rental construction is in the pipeline within 1–3 miles? Heavy new supply typically softens prices + rents 12–24 months out; constrained supply supports both.
Investment metrics
- 1% rule
- 0.63% ✗
- Cap rate
- 5.13%
- Cash-on-cash
- -4.15%
- DSCR
- 0.82
- GRM
- 13.3
CMA / ARV
No comps found within radius.
Projected returns pro-forma
6.78% appreciation · 3.0% rent growth · sell at horizon
- IRR
- 13.9%
- Equity multiple
- 1.98×
- Total profit
- $54,727
- Equity at exit
- $135,734
- IRR
- 14.1%
- Equity multiple
- 4.01×
- Total profit
- $168,390
- Equity at exit
- $255,284
Cash invested: $56,000 (down + closing). Projections, not guarantees.
Landlord ↔ Tenant lean methodology
- Overall (STATE)
- 73 Landlord-Friendly
- State Ohio
- 73 Landlord-Friendly · R+6
- County
- — inherits STATE
- City
- — inherits STATE
ZIP-level market 44802
- Home prices YoY
- 2.6%
- Active inventory
- 2
- Price-to-rent
- 13.3×
Monthly cashflow live
- Estimated rent
- $1,253 medium interval (Pro) →
- Mortgage (P&I)
- −$1,049
- Tax from tax record
- −$51 /mo · $612/yr
- Insurance
- −$83
- HOA
- −$0
- Vacancy / Maint / Mgmt
- −$263
- Net cashflow
- $-193
Break-even live
Sensitivity live
| Price | -10% $-80 | -5% $-137 | +0% $-193 | +5% $-250 | +10% $-307 |
|---|---|---|---|---|---|
| Rent | -10% $-292 | -5% $-243 | +0% $-193 | +5% $-144 | +10% $-94 |
| Rate | -1.0pp $-93 | -0.5pp $-143 | base $-193 | +0.5pp $-245 | +1.0pp $-298 |
UW: 25.0% down · 7.5% · 30yr · 1.5% tax · 5.0% vac · 8.0% maint · 8.0% mgmt
Financing live
Cash to close
- Down payment
- $50,000
- Closing costs
- $6,000
- Reserves months
- —
- Total cash needed
- —
Loan-product check · same deal, 3 products live
Conventional
25% down · 7.5% · 30yr
- Down + closing
- —
- Monthly P&I
- —
- Monthly cashflow
- —
- DSCR
- —
- Eligible?
- —
Personal DTI + credit; lowest rate.
DSCR
20% down · 8.5% · 30yr
- Down + closing
- —
- Monthly P&I
- —
- Monthly cashflow
- —
- DSCR
- —
- Eligible?
- —
No personal income docs; deal must DSCR.
Hard money
10% down · 12.0% · 12mo
- Down + closing
- —
- Monthly P&I
- —
- Monthly cashflow
- —
- DSCR
- —
- Eligible?
- —
Short-term bridge; refi at stabilization.
Listing history 23 events
-
2026-06-18days on market $200,000 Active 547 DOM
-
2026-06-17days on market $200,000 Active 546 DOM
-
2026-06-16days on market $200,000 Active 545 DOM
-
2026-06-15days on market $200,000 Active 544 DOM
-
2026-06-14days on market $200,000 Active 542 DOM
-
2026-06-12days on market $200,000 Active 541 DOM
-
2026-06-09days on market $200,000 Active 538 DOM
-
2026-06-08days on market $200,000 Active 537 DOM
-
2026-06-07days on market $200,000 Active 536 DOM
-
2026-06-05days on market $200,000 Active 533 DOM
-
2026-06-03days on market $200,000 Active 532 DOM
-
2026-06-02days on market $200,000 Active 531 DOM
-
2026-06-01days on market $200,000 Active 530 DOM
-
2026-05-31days on market $200,000 Active 529 DOM
-
2026-05-30days on market $200,000 Active 528 DOM
-
2025-10-06price $200,000 231-char remark
Show marketing remark (231 chars)
5 acres with Approximately 870 feet of frontage on US 224. Multi-family property featuring a 64 x 14 mobile home and a 48 x 20 cabin. great potential for commercial development and / or additional mobile units. Selling As-IS.
-
2025-01-21price $190,000 231-char remark
Show marketing remark (231 chars)
5 acres with Approximately 870 feet of frontage on US 224. Multi-family property featuring a 64 x 14 mobile home and a 48 x 20 cabin. great potential for commercial development and / or additional mobile units. Selling As-IS.
-
2024-12-18$215,000 Active 231-char remark
Show marketing remark (231 chars)
5 acres with Approximately 870 feet of frontage on US 224. Multi-family property featuring a 64 x 14 mobile home and a 48 x 20 cabin. great potential for commercial development and / or additional mobile units. Selling As-IS.
-
2015-01-07soldstatus $96,500
-
2012-05-18soldstatus $26,000 92-char remark
Show marketing remark (92 chars)
Home is on 4.99 acres with two outbuildings. Three bedrooms with master down. Selling As-Is.
-
2012-05-18soldstatus $26,000
Show marketing remark (92 chars)
Home is on 4.99 acres with two outbuildings. Three bedrooms with master down. Selling As-Is.
-
2012-04-06$25,900 92-char remark
Show marketing remark (92 chars)
Home is on 4.99 acres with two outbuildings. Three bedrooms with master down. Selling As-Is.
-
2012-04-06$26,000
Show marketing remark (92 chars)
Home is on 4.99 acres with two outbuildings. Three bedrooms with master down. Selling As-Is.
ⓘ Source: listings_history table (triggers on properties + properties_extension) + one-shot
backfill from property_details.listing_events for pre-trigger history.
Tax reassessment forecast OH · Partial reset (capped growth)
- Current annual tax
- $612 · $51/mo
- Projected year-2 tax
- $1,866 · $155/mo
- Expected delta
- +$1,254/yr (+$105/mo · 205.0%)
ⓘ Screening estimate from a state-policy table — verify with the county assessor before closing.
Climate risk First Street
- Flood 1/10 Low FEMA zone X (unshaded) · 0% chance over 30 yrs
- Wildfire 1/10 Low
- Heat 3/10 Moderate 7 d/yr ≥99°F today · 17 d/yr by 30 yrs out
- Wind 2/10 Low 0% chance of damaging wind over 30 yrs
- Air quality 2/10 Low 1 unhealthy d/yr today · 2 by 30 yrs out
Nearby sold comps map
Loading sold comps map…
Walkable amenities ~0.75 mi
Loading nearby amenities…
Taxation est. · year 1
- Rental income
- $15,033
- − Mortgage interest
- −$11,203
- − Property taxes
- −$612
- − Insurance
- −$1,000
- − Repairs & maintenance
- −$1,203
- − Management
- −$1,203
- − Depreciation
- −$5,818
- Taxable loss
- −$6,005
- Est. tax savings @ 24.0%
- +$1,441
- After-tax cash flow
- $-880/yr
For passive investors: Depreciation is non-cash, so a rental often shows a tax loss while cash-flowing — sheltering income. Rental losses are passive: they offset passive income freely, and up to $25,000/yr can offset ordinary (W-2) income if you actively participate and your MAGI is under $100k (phasing out to $0 by $150k); unused losses carry forward. On sale, claimed depreciation is recaptured at up to 25%, and gains may owe capital-gains tax (a 1031 exchange can defer both). Figures are a year-1 estimate at your 24.0% rate — not tax advice; consult a CPA.
Schools (NCES district)
- District
- Arcadia Local
- NCES district ID
- 3910002
- Math proficiency
- 65% ▼ -16.00%
- Reading proficiency
- 77% ▼ -5.00%
- Median HH income
- $48,634
- Composite
- 60.02/100
- National rank
- #874
- State rank
- #144 of 656 in OH
Livability — Fostoria
- Score
- 76/100
- State rank
- #216
- US rank
- #3330
Category grades
Schools grade is shown separately in the Schools card above.
Census & demographics
- County
- Seneca · 70,739 people
- City population
- 18,409
- Population (ZIP)
- 919
- Household income
- $61,667
- Rent vs Own
- Severe rent burden
- 28.6
Population outlook (Hancock County) Hauer SSP2
- Today (2025)
- 77,526 people
- By 2030
- 77,777 · +0.3%
- By 2040
- 76,976 · -0.7%
- By 2050
- 74,479 · -3.9%
- By 2075
- 65,741 · -15.2%
- By 2100
- 52,942 · -31.7%
Race, ethnicity, and origin ACS 2023
- Neighborhood character
- Predominantly White (92%)
- Race & ethnicity
- White 92% Two or more races 4% Asian 3% Hispanic / Latino 2%
- Common ancestry
- Italian 5% Romanian 2% Portuguese 1%
- Foreign-born
- 3% · Canada
- Languages at home
- 96% English-only · German/W. Germanic 2% Tagalog/Filipino 1% Spanish 1%
Political lean MEDSL · Hancock
- 2024 margin
- Solid R (+38.4) · D 30.2% · R 68.7% · Other 1.1%
- 2008→2024 swing
- -15.3pp toward R · 2008: -23.1pp · 2024: -38.4pp
- All cycles
- 2024: R+38.4 2020: R+37.5 2016: R+40.8 2012: R+28.3 2008: R+23.1
Not yet ingested
- Civics
- —
Market trends
- HPI YoY
- ▲ 6.78%
- Current HPI
- 265.1461
- Rent YoY
- —
- Metro
- —
- State GDP YoY
- ▲ 1.98%
- F500 in state
- 48
Industry mix (Fortune 500 HQ in OH)
| Industry | F500 HQs | Revenue |
|---|---|---|
| Insurance | 3 | $145B |
|
||
| Industrial Machinery | 3 | $49B |
|
||
| Financial Services | 3 | $24B |
|
||
| Consumer Goods | 2 | $93B |
|
||
| Aerospace / Defense | 2 | $47B |
|
||
| Utilities | 2 | $33B |
|
||
Price history
+672.2% since first listed8 events — show timeline
- 2025-10-06 Price Changed $200,000 NORIS
- 2025-01-21 Price Changed $190,000 NORIS
- 2024-12-18 Listed $215,000 NORIS
- 2015-01-07 Sold (Public Records) $96,500 Public Records
- 2012-05-18 Sold (MLS) $26,000 NORIS
- 2012-05-18 Sold (MLS) $26,000 NORIS
- 2012-04-06 Listed $26,000 NORIS
- 2012-04-06 Listed $25,900 NORIS
Property tax history
-6.0%/yrLatest (2025): $612 · +27.7% YoY. Source: county tax records.
Cash-flow waterfall
monthlySold comps — $/sqft
last 12 mo · ≤1 miLoading sold comps…