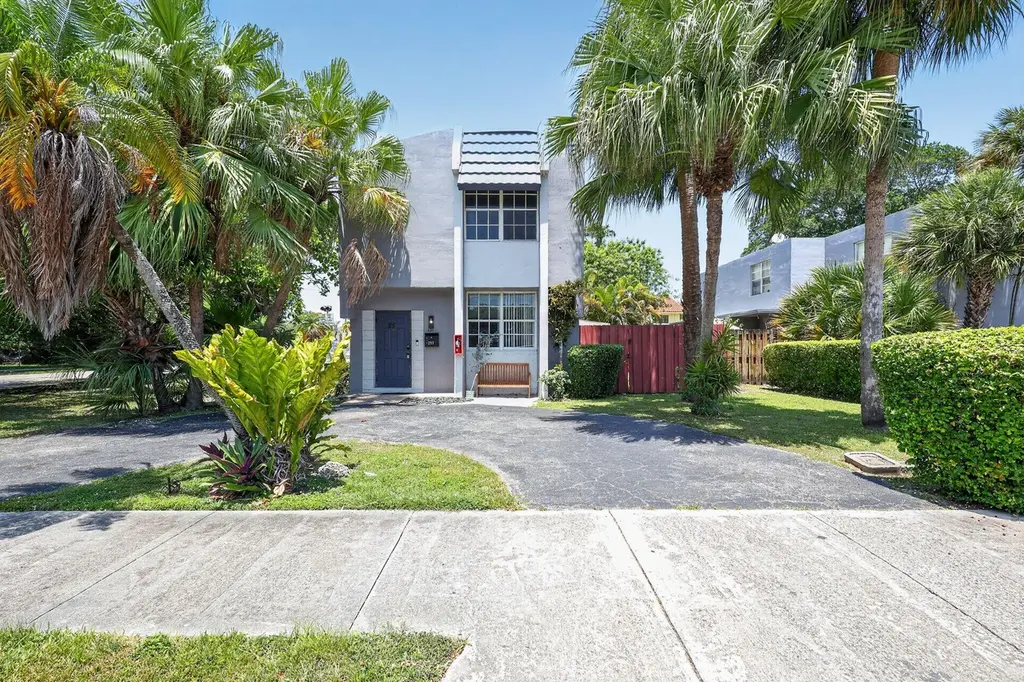
251 NE 142nd St Unit 21a · Golden Glades, FL
Flood risk No data
- FEMA flood zone
- —
- Chance of flooding over 30 yrs
- —
- Est. flood insurance / yr
- —
Fire risk No data
- Est. fire insurance / yr
- —
Heat risk No data
- Hot days now (above threshold)
- —
- Hot days in 30 yrs
- —
Wind risk No data
- Chance of severe wind over 30 yrs
- —
Air-quality risk No data
- Unhealthy air days now
- —
- Unhealthy air days in 30 yrs
- —
Risk factors via First Street. Map © Google.
Why this score? — see what drove the B grade
The composite is a weighted blend of 9 inputs, each scored 0–100. Each bar is that input's sub-score; the figure is the points it added to the 100-point composite (weight × sub-score).
- Cash flow +30.0/30.0
- 1% rule +10.0/10.0
- DSCR +10.0/10.0
- ARV discount +7.5/15.0
- Schools +4.2/10.0
- Livability +3.7/5.0
- Condition / age +2.5/5.0
- Rent growth +2.3/5.0
- Appreciation +0.0/10.0
$300,000
🖨 Deal sheet 📄 Offer letter ✓ Due diligence
Listing remarks MLS
HUGE 3/2.5 detached two-story townhouse! Only Townhouse in the subdivision with private circular driveway and beautiful landscaping. Features include oversized bedrooms, large kitchen, walk-in closet, central A/C, new carpet and large patio! Nice safe neighborhood across the street from Linda Lentin elementary school. Ready for your buyer to move in!!!
Key facts
- Open floor plan
- Private bath
- Ample cabinet space
Tags
Property features AI
Finance
- Other: Pets allowed (restrictions possible)
- HOA & community: Association managed by Premier Association Services; Monthly association fee
Exterior
- Utilities: Public water; Public sewer; Electric service
- Home design: Townhouse; Two-story; Entry at level 1; Faces northeast; Resale condition
- Construction: Block construction; Other roof
- Exterior features: Open patio
Interior
- Bedrooms: Three bedrooms on the main level
- Flooring: Carpet; Tile; Wood
- Bathrooms: Two full bathrooms; One half bathroom
- Heating & cooling: Electric heating; Central air conditioning
- Interior features: Unfurnished; Carpet flooring; Tile flooring; Wood flooring
Neighborhood map
What this means for you Summary
Snapshot
- This is a 3-bed/2.0-bath townhouse listed at $300k.
Deal economics
- At list price, monthly cash flow is $2k ($20k/yr) — positive.
- The deal already cash-flows at list — no discount required.
- Meets the 1% rule at list price ($5k rent vs $300k).
- Recommended offer: $296k (1.5% below list) — sets the bar for market timing.
- Cap rate 13.1% vs local median 3.5% in Golden Glades — top-decile yield for the area; either an underpriced asset or a hidden risk that comps aren't pricing in. Stress-test before assuming the spread holds.
Location & tenants
- Location reads 74/100 on livability (#281 in FL, #4,513 nationally) — a middle-class / working-renter tenant base. Strengths: commute A+, housing B+, health & safety B+; Watch: employment D, amenities F.
- Miami-Dade (suburban): math 45% / reading 54% proficiency, ranked #40 of 73 in FL (top 55%) — families likely to look elsewhere, expect single-tenant / working-renter base with shorter leases; 64% free/reduced lunch — lower-income household profile, screen leases tightly.
- Zoned schools: Linda Lentin K-8 Center (math 27% / reading 36%, grade F, #1,841 of 2,144 statewide, top 86%, 674 students, 76% FRL); North Miami Beach Senior High (math 13% / reading 24%, grade F, #568 of 667 statewide, top 85%, 1,149 students, 66% FRL).
- Zoned-school proficiency averages 25% at this address vs 50% district-wide (-24 pts) — the specific schools serving this property underperform the Miami-Dade average; the district grade overstates school quality for this exact location.
- Market conditions: Rents soft (-0.7%/yr); 338 active listings in the ZIP; 10,051 units permitted in Miami-Dade County in 2024 (7,758 in 5+ unit buildings).
- At $5,086/mo this rent would consume 105% of the median local household income ($58k/yr) (locally 3226% of renters already pay >50% of income on rent) — very limited rent-growth headroom before tenants either downsize or default.
Forward outlook
- Local home prices are declining (-3.0%/yr); year-one equity from $2k of loan paydown is wiped out by about $9k of value loss. Plan a longer hold.
- Miami-Dade County population projected at +28% by 2050 — long-run rental-demand tailwind backs the buy-and-hold thesis.
- At projected returns (-3.0% appreciation + 0.0% rent growth), your $84k cash investment doubles in ~6 years — after that, you're playing with house money.
Negotiation context
- It's been on market 27 days — a 2% lower offer ($296k) is reasonable based on typical stale-listing flexibility.
- 4 sale attempts since 9y ago with the ask held roughly flat each time — persistent listings suggest the price (not the market) is what's stuck; bring a comps-based counter.
- Current owner paid $145k; list at $300k implies a 107% gain — meaningful room to come down on a strong offer.
Questions for the listing agent
- Built in 1972 — when were the roof, HVAC, electrical panel, plumbing, and water heater last replaced?
- What does the HOA fee cover, when was the last increase, and are there any pending special assessments or reserve-fund shortfalls?
- Is there a deadline driving the sale (1031 exchange, divorce, estate, relocation)? That informs how much negotiation room exists.
- What's the average days-on-market for RENTAL listings here right now (not sales)? A rising rental-DOM trend means longer vacancies and softer asking-rent achievability than the comps imply.
- What's the recent tenant-quality profile in this submarket — average credit score on applications, eviction rate, late-payment / NSF rate, and stable-employment percentage? A property-management company in the area should have these aggregated.
- How much new for-sale + rental construction is in the pipeline within 1–3 miles? Heavy new supply typically softens prices + rents 12–24 months out; constrained supply supports both.
Investment metrics
- 1% rule
- 1.70% ✓
- Cap rate
- 13.10%
- Cash-on-cash
- 24.31%
- DSCR
- 2.08
- GRM
- 4.9
CMA / ARV
No comps found within radius.
Projected returns pro-forma
-3.0% appreciation · 0.0% rent growth · sell at horizon
- IRR
- 14.0%
- Equity multiple
- 1.54×
- Total profit
- $45,069
- Equity at exit
- $44,731
- IRR
- 20.2%
- Equity multiple
- 2.45×
- Total profit
- $122,095
- Equity at exit
- $25,939
Cash invested: $84,000 (down + closing). Projections, not guarantees.
Landlord ↔ Tenant lean methodology
- Overall (STATE)
- 87 Strongly Landlord-Friendly
- State Florida
- 87 Strongly Landlord-Friendly · R+3
- County
- — inherits STATE
- City
- — inherits STATE
ZIP-level market 33161
- Rents YoY
- -0.7%
- Active inventory
- 338
- Price-to-rent
- 4.9×
Monthly cashflow live
- Estimated rent
- $5,086 medium interval (Pro) →
- Mortgage (P&I)
- −$1,573
- Tax from tax record
- −$233 /mo · $2,799/yr
- Insurance
- −$125
- HOA
- −$385
- Vacancy / Maint / Mgmt
- −$1,068
- Net cashflow
- $1,701
Break-even live
UW: 25.0% down · 7.5% · 30yr · 1.5% tax · 5.0% vac · 8.0% maint · 8.0% mgmt
Financing live
Cash to close
- Down payment
- $75,000
- Closing costs
- $9,000
- Reserves months
- —
- Total cash needed
- —
Loan-product check · same deal, 3 products live
Conventional
25% down · 7.5% · 30yr
- Down + closing
- —
- Monthly P&I
- —
- Monthly cashflow
- —
- DSCR
- —
- Eligible?
- —
Personal DTI + credit; lowest rate.
DSCR
20% down · 8.5% · 30yr
- Down + closing
- —
- Monthly P&I
- —
- Monthly cashflow
- —
- DSCR
- —
- Eligible?
- —
No personal income docs; deal must DSCR.
Hard money
10% down · 12.0% · 12mo
- Down + closing
- —
- Monthly P&I
- —
- Monthly cashflow
- —
- DSCR
- —
- Eligible?
- —
Short-term bridge; refi at stabilization.
HOA detail
- Monthly dues
- $385 · $4,620/yr
- Likely covers
- landscaping
Listing history 17 events
-
2026-06-03days on market $300,000 Active 27 DOM
-
2026-06-02days on market $300,000 Active 26 DOM
-
2026-06-01days on market $300,000 Active 25 DOM
-
2026-05-31days on market $300,000 Active 24 DOM
-
2026-05-06$300,000 Active
-
2022-11-21historical
-
2022-08-30historical Active Under Contract
-
2022-07-23price $315,000
-
2022-07-20status Active
-
2022-07-15historical Active Under Contract
-
2022-06-23$325,000 Active
-
2017-11-13soldstatus $145,000 Sold 355-char remark
Show marketing remark (355 chars)
HUGE 3/2.5 detached two-story townhouse! Only Townhouse in the subdivision with private circular driveway and beautiful landscaping. Features include oversized bedrooms, large kitchen, walk-in closet, central A/C, new carpet and large patio! Nice safe neighborhood across the street from Linda Lentin elementary school. Ready for your buyer to move in!!!
-
2017-10-19status Backup Contract 355-char remark
Show marketing remark (355 chars)
HUGE 3/2.5 detached two-story townhouse! Only Townhouse in the subdivision with private circular driveway and beautiful landscaping. Features include oversized bedrooms, large kitchen, walk-in closet, central A/C, new carpet and large patio! Nice safe neighborhood across the street from Linda Lentin elementary school. Ready for your buyer to move in!!!
-
2017-10-09$149,000 Active 355-char remark
Show marketing remark (355 chars)
HUGE 3/2.5 detached two-story townhouse! Only Townhouse in the subdivision with private circular driveway and beautiful landscaping. Features include oversized bedrooms, large kitchen, walk-in closet, central A/C, new carpet and large patio! Nice safe neighborhood across the street from Linda Lentin elementary school. Ready for your buyer to move in!!!
-
2004-03-19soldstatus $75,000
-
1990-07-30soldstatus $64,500
-
1985-09-01soldstatus $56,000
ⓘ Source: listings_history table (triggers on properties + properties_extension) + one-shot
backfill from property_details.listing_events for pre-trigger history.
Tax reassessment forecast FL · Resets to sale price
- Current annual tax
- $2,799 · $233/mo
- Projected year-2 tax
- $2,799 · $233/mo
- Expected delta
- $0/yr ($0/mo · 0.0%)
ⓘ Screening estimate from a state-policy table — verify with the county assessor before closing.
Nearby sold comps map
Loading sold comps map…
Walkable amenities ~0.75 mi
Loading nearby amenities…
Taxation est. · year 1
- Rental income
- $61,031
- − Mortgage interest
- −$16,805
- − Property taxes
- −$2,799
- − Insurance
- −$1,500
- − Repairs & maintenance
- −$4,882
- − Management
- −$4,882
- − HOA
- −$4,620
- − Depreciation
- −$8,727
- Taxable income
- $16,815
- Est. tax owed @ 24.0%
- −$4,036
- After-tax cash flow
- $16,381/yr
For passive investors: Depreciation is non-cash, so a rental often shows a tax loss while cash-flowing — sheltering income. Rental losses are passive: they offset passive income freely, and up to $25,000/yr can offset ordinary (W-2) income if you actively participate and your MAGI is under $100k (phasing out to $0 by $150k); unused losses carry forward. On sale, claimed depreciation is recaptured at up to 25%, and gains may owe capital-gains tax (a 1031 exchange can defer both). Figures are a year-1 estimate at your 24.0% rate — not tax advice; consult a CPA.
Schools (NCES district)
- District
- Miami-Dade
- NCES district ID
- 1200390
- Math proficiency
- 45% ▼ -16.00%
- Reading proficiency
- 54% ▼ -5.00%
- Median HH income
- $43,928
- Composite
- 41.76/100
- National rank
- #3397
- State rank
- #40 of 73 in FL
Livability — Golden Glades
- Score
- 74/100
- State rank
- #281
- US rank
- #4513
Category grades
Schools grade is shown separately in the Schools card above.
Census & demographics
- Census place
- Golden Glades, FL
- County
- Miami-Dade County · 2,697,751 people
- Metro
- Miami-Fort Lauderdale-Pompano Beach, FL
- Population (ZIP)
- 54,814
- Household income
- $58,325
- Rent vs Own
- Severe rent burden
- 3226.0
Population outlook (Miami-Dade County) Hauer SSP2
- Today (2025)
- 3,126,439 people
- By 2030
- 3,325,765 · +6.4%
- By 2040
- 3,697,561 · +18.3%
- By 2050
- 4,012,134 · +28.3%
- By 2075
- 4,605,612 · +47.3%
- By 2100
- 4,866,598 · +55.7%
Race, ethnicity, and origin ACS 2023
- Neighborhood character
- Diverse neighborhood (Simpson 0.58)
- Race & ethnicity
- Black 56% Hispanic / Latino 31% Two or more races 18% White 8% Asian 2%
- Hispanic origin (detail)
- Puerto Rican 4% Cuban 7% Dominican 4% Salvadoran 1%
- Common ancestry
- Hispanic 35% Estonian 1% Lithuanian 1%
- Foreign-born
- 51% · Canada, Jamaica, Dominican Republic
- Languages at home
- 25% English-only · French/Haitian/Cajun 41% Spanish 30% Other Indo-European 2%
Political lean MEDSL · Miami-Dade
- 2024 margin
- R (+11.4) · D 43.9% · R 55.4%
- 2008→2024 swing
- -27.6pp toward R · 2008: 16.1pp · 2024: -11.4pp
- All cycles
- 2024: R+11.4 2020: D+7.3 2016: D+29.6 2012: D+23.7 2008: D+16.1
Not yet ingested
- Civics
- —
Market trends
- HPI YoY
- ▼ -492.86%
- Current HPI
- 630.6932
- Rent YoY
- ▼ -0.73%
- Metro
- Miami-Fort Lauderdale-Pompano Beach, FL
- State GDP YoY
- ▲ 3.28%
- F500 in state
- 36
Industry mix (Fortune 500 HQ in FL)
| Industry | F500 HQs | Revenue |
|---|---|---|
| Industrial Technology | 2 | $29B |
|
||
| Insurance | 2 | $17B |
|
||
| Retail | 1 | $60B |
|
||
| Technology Distribution | 1 | $58B |
|
||
| Homebuilding | 1 | $35B |
|
||
| Technology Manufacturing | 1 | $35B |
|
||
Price history
+435.7% since first listed13 events — show timeline
- 2026-05-06 Listed $300,000 Beaches MLS
- 2022-11-21 Listing Removed — MARMLS
- 2022-08-30 Contingent — MARMLS
- 2022-07-23 Price Changed $315,000 MARMLS
- 2022-07-20 Relisted — MARMLS
- 2022-07-15 Contingent — MARMLS
- 2022-06-23 Listed $325,000 MARMLS
- 2017-11-13 Sold (MLS) $145,000 MARMLS
- 2017-10-19 Pending — MARMLS
- 2017-10-09 Listed $149,000 MARMLS
- 2004-03-19 Sold (Public Records) $75,000 Public Records
- 1990-07-30 Sold (Public Records) $64,500 Public Records
- 1985-09-01 Sold (Public Records) $56,000 Public Records
Property tax history
+6.9%/yrLatest (2025): $2,799 · +1.8% YoY. Source: county tax records.
Cash-flow waterfall
monthlySold comps — $/sqft
last 12 mo · ≤1 miLoading sold comps…