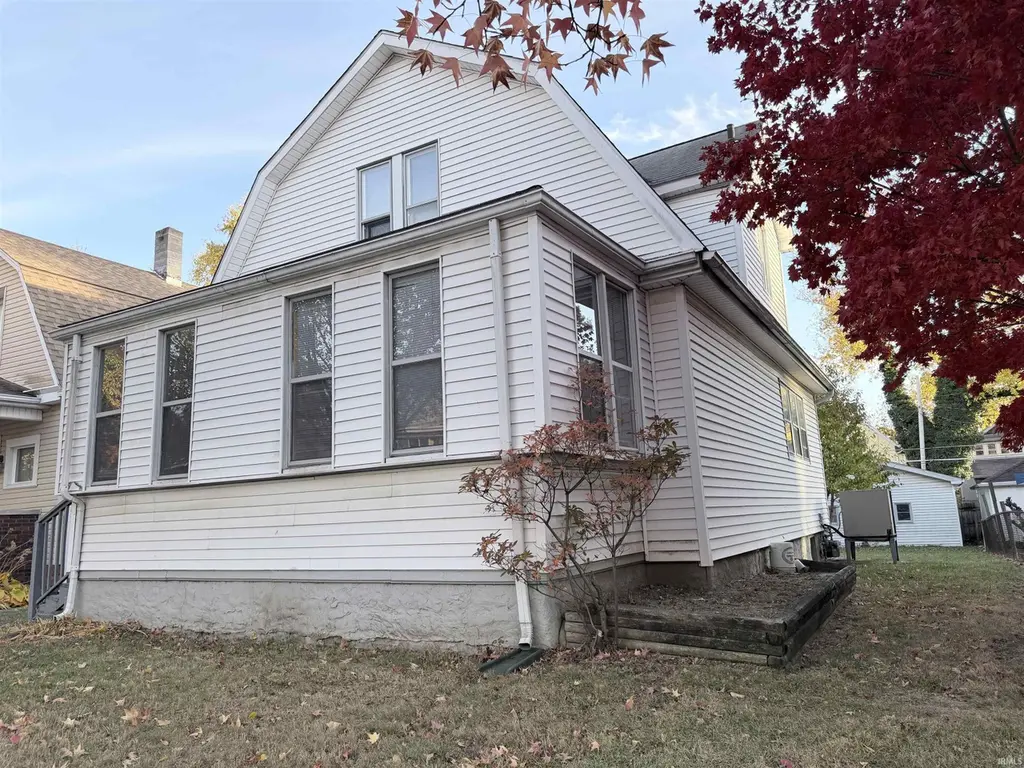
925 Cottage Ave · Fort Wayne, IN
Flood risk 1/10 · Minimal
- FEMA flood zone
- X (unshaded)
- Chance of flooding over 30 yrs
- 0.0%
- Est. flood insurance / yr
- $507 – $1,088
Fire risk 1/10 · Minimal
- Est. fire insurance / yr
- $717 – $1,331
Heat risk 3/10 · Minor
- Hot days now (above 100°F)
- 7 days/yr
- Hot days in 30 yrs
- 17 days/yr
Wind risk 2/10 · Minimal
- Chance of severe wind over 30 yrs
- —
Air-quality risk 3/10 · Minor
- Unhealthy air days now
- 2 days/yr
- Unhealthy air days in 30 yrs
- 3 days/yr
Risk factors via First Street. Map © Google.
Why this score? — see what drove the D+ grade
The composite is a weighted blend of 9 inputs, each scored 0–100. Each bar is that input's sub-score; the figure is the points it added to the 100-point composite (weight × sub-score).
- ARV discount +13.5/15.0
- Cash flow +11.5/30.0
- Rent growth +4.6/5.0
- 1% rule +4.3/10.0
- Livability +4.2/5.0
- DSCR +3.4/10.0
- Condition / age +2.5/5.0
- Schools +2.2/10.0
- Appreciation +0.0/10.0
$129,900
🖨 Deal sheet (PDF) 📄 Offer letter ✓ Due diligence
Listing remarks MLS
Fresh update & peace of mind! A recent waterline improvement has addressed prior basement concerns. Inside you will find 2 large bedrooms and a bathroom on the upper level, and a flexible floorplan on the main with the option to create a main floor bedroom or future suite. Move right in or personalize over time, this home offers space, character and opportunity at an affordable price point.
Key facts
- French doors
- Two car garage
- 5,227 sq ft lot
Tags
Neighborhood map
What this means for you Summary
Snapshot
- This is a 3-bed/1.0-bath single-family listed at $130k.
Deal economics
- At list price, monthly cash flow is $-43 ($-518/yr) — negative.
- To cash-flow at today's rent, offer at most $122k (5.9% below list).
- To meet the 1% rule (rent ≥ 1% of price), the offer needs to be $121k (6.9% below list).
- Recommended offer: $114k (12.0% below list) — sets the bar for market timing.
- Cap rate 5.9% vs local median 4.7% in Fort Wayne — meaningfully above typical; check what's discounted (condition, days-on-market, listing class) to confirm the premium yield is real.
Location & tenants
- Location reads 84/100 on livability (#6 in IN, #676 nationally) — a professional / high-income tenant draw. Strengths: amenities A+, commute A+, cost of living A+; Watch: crime C-, employment D+.
- Fort Wayne Community Schools (urban): math 22% / reading 29% proficiency, ranked #263 of 301 in IN (top 87%) — low school quality limits family demand, transient renter base, plan for 1-2y turnover; 60% free/reduced lunch — lower-income household profile, screen leases tightly.
- Zoned schools: South Wayne Elementary School (math 17% / reading 17%, grade F, #837 of 994 statewide, top 86%, 362 students, 88% FRL); Portage Middle School (math 8% / reading 18%, grade F, #304 of 330 statewide, top 94%, 436 students, 79% FRL); South Side High School (math 12% / reading 39%, grade F, #322 of 369 statewide, top 87%, 1,423 students, 73% FRL) — zoned schools average 80% FRL vs 60% district-wide (20 pts higher); higher-poverty schools than district average — tighter screening recommended.
- Market conditions: Rents rising fast (+8.2%/yr); 99 active listings in the ZIP; 35 comparable units currently listed for rent nearby; rentals at typical pace (median 23d on market — plan ~3-4 weeks tenant-placement turnaround); 1,861 units permitted in Allen County in 2024 (576 in 5+ unit buildings).
Forward outlook
- Local home prices are declining (-3.0%/yr); year-one equity from $898 of loan paydown is wiped out by about $4k of value loss. Plan a longer hold.
- Allen County population projected at +10% by 2050 — modest demand growth; plan on rents tracking national, not racing it.
Negotiation context
- It's been on market 194 days — a 12% lower offer ($114k) is reasonable based on typical stale-listing flexibility.
- 2 sale attempts; this cycle's ask has dropped $12k (9%) from the opening price — seller is motivated, your offer sets the floor, not the list.
- Current owner paid $40k; list at $130k implies a 225% gain — meaningful room to come down on a strong offer.
Risks & watch-outs
- Watch-outs: built in 1926 — expect roof / HVAC / electrical / plumbing capex.
Questions for the listing agent
- What do current leases actually rent for vs. the listed asking? Can we see a recent rent roll and the last 12 months of T-12 income?
- It's been on market 194 days. Have you received any prior offers? Is the seller open to a 12% concession, seller financing, or rate buy-down credit?
- Built in 1926 — when were the roof, HVAC, electrical panel, plumbing, and water heater last replaced?
- Why hasn't it sold? Are there any deal-killer items the seller is aware of (foundation, flood, title, zoning, code violations)?
- Is there a deadline driving the sale (1031 exchange, divorce, estate, relocation)? That informs how much negotiation room exists.
- Schools are D-rated, which usually means shorter tenancies and higher turnover. Who's the typical renter profile here, and what's been the actual vacancy rate?
- The area grade is low — what's the realistic commute time and amenity access for the typical tenant pool here? Any planned neighborhood developments (good or bad) we should know about?
- What's the average days-on-market for RENTAL listings here right now (not sales)? A rising rental-DOM trend means longer vacancies and softer asking-rent achievability than the comps imply.
- What's the recent tenant-quality profile in this submarket — average credit score on applications, eviction rate, late-payment / NSF rate, and stable-employment percentage? A property-management company in the area should have these aggregated.
- How much new for-sale + rental construction is in the pipeline within 1–3 miles? Heavy new supply typically softens prices + rents 12–24 months out; constrained supply supports both.
Investment metrics
- 1% rule
- 0.93% ✗
- Cap rate
- 5.89%
- Cash-on-cash
- -1.42%
- DSCR
- 0.94
- GRM
- 9.0
CMA / ARV
- ARV (median comp)
- $150,064
- List price
- $129,900
- Delta
- -13.44%
- Verdict
- UNDERPRICED
- Comps
- 20 within 1.0 mi
Show comp detail 12 sales within ~0.75 mi
| Address | Dist | Beds/Ba | Sqft | Sold | Price | $/sf | Match |
|---|---|---|---|---|---|---|---|
| 3124 Broadway | 0.24mi | 3/2.0 | 1,556 (+5%) | 1mo | $159,900 | $103 | 77 |
| 326 Arcadia Ct | 0.59mi | 3/1.0 | 1,526 (+3%) | 1mo | $171,000 | $112 | 67 |
| 1510 Waldron Cir | 0.40mi | 3/1.0 | 1,597 (+7%) | 2mo | $179,900 | $113 | 67 |
| 3314 Webster St | 0.59mi | 3/1.0 | 1,534 (+3%) | 2mo | $153,000 | $100 | 65 |
| 1020 W Oakdale Dr | 0.38mi | 3/2.0 | 1,600 (+8%) | 1mo | $192,500 | $120 | 65 |
| 721 W Oakdale Dr | 0.43mi | 3/1.5 | 1,344 (-10%) | 2mo | $190,000 | $141 | 61 |
| 709 W Oakdale Dr | 0.43mi | 3/1.5 | 1,640 (+10%) | 2mo | $260,000 | $159 | 59 |
| 1202 W Branning Ave | 0.72mi | 2/1.0 (-1) | 1,448 (-3%) | 1mo | $224,900 | $155 | 56 |
| 3606 S Harrison St | 0.71mi | 3/1.5 | 1,555 (+4%) | 2mo | $211,000 | $136 | 56 |
| 443 French Ave | 0.59mi | 3/1.0 | 1,344 (-10%) | 2mo | $124,000 | $92 | 55 |
| 2027 Thompson Ave | 0.70mi | 3/1.0 | 1,320 (-11%) | 1mo | $163,000 | $123 | 48 |
| 4108 Tacoma Ave | 0.73mi | 3/0.5 | 1,358 (-9%) | 2mo | $120,000 | $88 | 48 |
Match score weights: distance 35% · size 25% · config 20% · recency 20%. Top-matched comps best support the ARV.
Projected returns pro-forma
-3.0% appreciation · 8.0% rent growth · sell at horizon
- IRR
- -12.5%
- Equity multiple
- 0.52×
- Total profit
- $-17,326
- Equity at exit
- $19,369
- IRR
- 3.3%
- Equity multiple
- 1.30×
- Total profit
- $10,786
- Equity at exit
- $11,231
Cash invested: $36,372 (down + closing). Projections, not guarantees.
Landlord ↔ Tenant lean methodology
- Overall (STATE)
- 90 Strongly Landlord-Friendly
- State Indiana
- 90 Strongly Landlord-Friendly · R+11
- County
- — inherits STATE
- City
- — inherits STATE
ZIP-level market 46807
- Rents YoY
- 8.2%
- Active inventory
- 99
- Price-to-rent
- 9.0×
Monthly cashflow live
- Estimated rent
- $1,209 high interval (Pro) →
- Mortgage (P&I)
- −$681
- Tax from tax record
- −$263 /mo · $3,157/yr
- Insurance
- −$54
- HOA
- −$0
- Vacancy / Maint / Mgmt
- −$254
- Net cashflow
- $-43
Break-even live
Sensitivity live
| Price | -10% $30 | -5% $-6 | +0% $-43 | +5% $-80 | +10% $-117 |
|---|---|---|---|---|---|
| Rent | -10% $-139 | -5% $-91 | +0% $-43 | +5% $5 | +10% $52 |
| Rate | -1.0pp $22 | -0.5pp $-10 | base $-43 | +0.5pp $-77 | +1.0pp $-111 |
UW: 25.0% down · 7.5% · 30yr · 1.5% tax · 5.0% vac · 8.0% maint · 8.0% mgmt
Financing live
Cash to close
- Down payment
- $32,475
- Closing costs
- $3,897
- Reserves months
- —
- Total cash needed
- —
Loan-product check · same deal, 3 products live
Conventional
25% down · 7.5% · 30yr
- Down + closing
- —
- Monthly P&I
- —
- Monthly cashflow
- —
- DSCR
- —
- Eligible?
- —
Personal DTI + credit; lowest rate.
DSCR
20% down · 8.5% · 30yr
- Down + closing
- —
- Monthly P&I
- —
- Monthly cashflow
- —
- DSCR
- —
- Eligible?
- —
No personal income docs; deal must DSCR.
Hard money
10% down · 12.0% · 12mo
- Down + closing
- —
- Monthly P&I
- —
- Monthly cashflow
- —
- DSCR
- —
- Eligible?
- —
Short-term bridge; refi at stabilization.
Rent comps 35 comps
| Address | Beds | Baths | Sqft | Rent | $/sqft | DOM | Units | Dist |
|---|---|---|---|---|---|---|---|---|
| 907 Lincoln Ave Fort Wayne, IN | 2.0 | 1.0 | 1060 | $850 | $0.80 | 15d | 1 | 0.17mi |
| 3201 Dinnen Ave Fort Wayne, IN | 2.0 | 1.0 | 986 | $999 | $1.01 | 15d | 1 | 0.29mi |
| 2431 Fox Ave Fort Wayne, IN | 3.0 | 1.5 | 1522 | $1,550 | $1.02 | 15d | 1 | 0.33mi |
| 1235 Huestis Ave Unit A Fort Wayne, IN | 2.0 | 1.0 | 1040 | $950 | $0.91 | 45d | 1 | 0.33mi |
| 1353 Huestis Ave Fort Wayne, IN | 4.0 | 1.0 | 1328 | $1,300 | $0.98 | 15d | 1 | 0.40mi |
| 1360 Huestis Ave Fort Wayne, IN | 3.0 | 1.0 | 1056 | $1,080 | $1.02 | 15d | 1 | 0.42mi |
| 2445 Fairfield Ave Fort Wayne, IN | 2.0 | 1.5 | 950 | $1,150 | $1.21 | 15d | 3 | 0.44mi |
| 2430 Thompson Ave Fort Wayne, IN | 2.0 | 1.0 | 1197 | $975 | $0.81 | 15d | 1 | 0.45mi |
| 1342 Guthrie St Fort Wayne, IN | 3.0 | 1.0 | 1200 | $899 | $0.75 | 45d | 1 | 0.51mi |
| 309 W Leith St Unit 2 Fort Wayne, IN | 2.0 | 1.0 | 900 | $1,000 | $1.11 | 45d | 1 | 0.54mi |
| 3008 Webster St Fort Wayne, IN | 3.0 | 1.0 | 1344 | $1,449 | $1.08 | 23d | 1 | 0.56mi |
| 2133 Riedmiller Ave Fort Wayne, IN | 3.0 | 1.0 | 1056 | $1,050 | $0.99 | 23d | 1 | 0.60mi |
| 227 W Darrow Ave Fort Wayne, IN | 3.0 | 1.0 | 995 | $1,000 | $1.01 | 45d | 1 | 0.67mi |
| 3510 S Harrison St Fort Wayne, IN | 3.0 | 1.0 | 1248 | $975 | $0.78 | 15d | 1 | 0.71mi |
| 116 E Pontiac St Fort Wayne, IN | 3.0 | 1.5 | 1400 | $1,175 | $0.84 | 23d | 1 | 0.74mi |
| 1104 Stophlet St Fort Wayne, IN | 3.0 | 1.5 | 1288 | $1,400 | $1.09 | 15d | 1 | 0.76mi |
| 309 W Williams St Unit 1 Fort Wayne, IN | 2.0 | 1.0 | 900 | $900 | $1.00 | 23d | 1 | 0.81mi |
| 4201 S Wayne Ave Fort Wayne, IN | 3.0 | 1.5 | 1252 | $1,400 | $1.12 | 23d | 1 | 0.84mi |
| 1332 Swinney Ave Fort Wayne, IN | 2.0 | 1.0 | 1035 | $1,300 | $1.26 | 45d | 1 | 0.86mi |
| 217 W Masterson Ave Fort Wayne, IN | 2.0 | 1.0 | 1100 | $995 | $0.90 | 23d | 1 | 0.91mi |
| 2530 Lafayette St Fort Wayne, IN | 4.0 | 1.0 | 1816 | $1,500 | $0.83 | 45d | 1 | 0.95mi |
| 877 Lavina St Fort Wayne, IN | 1.0–3.0 | 1.0–2.0 | 997 | $2,980 | $2.99 | 45d | 17 | 1.01mi |
| 603 Lavina St Fort Wayne, IN | 3.0 | 2.0 | 1872 | $1,899 | $1.01 | 45d | 1 | 1.04mi |
| 451 E Pontiac St Fort Wayne, IN | 3.0 | 1.0 | 1308 | $1,050 | $0.80 | 45d | 1 | 1.06mi |
| 1118 Rockhill St Fort Wayne, IN | 3.0 | 3.0 | 1790 | $2,300 | $1.28 | 45d | 1 | 1.07mi |
| 420 E Dewald St Fort Wayne, IN | 3.0 | 1.5 | 1472 | $1,300 | $0.88 | 45d | 1 | 1.09mi |
| 3801 Lafayette St Fort Wayne, IN | 2.0 | 1.0 | 1116 | $995 | $0.89 | 15d | 1 | 1.10mi |
| 1250 Ewing St Fort Wayne, IN | 2.0 | 1.0–2.0 | 980 | $2,081 | $2.12 | 23d | 24 | 1.16mi |
| 915 Garden St Fort Wayne, IN | 2.0 | 2.0 | 1275 | $1,650 | $1.29 | 15d | 1 | 1.21mi |
| 4133 Lafayette St Fort Wayne, IN | 4.0 | 2.0 | 1640 | $1,400 | $0.85 | 23d | 1 | 1.24mi |
| 901 W Wayne St Unit 3 Fort Wayne, IN | 2.0 | 2.0 | 1312 | $1,700 | $1.30 | 45d | 1 | 1.26mi |
| 835 Van Buren St Fort Wayne, IN | 2.0 | 1.0–2.0 | 750 | $1,995 | $2.66 | 15d | 29 | 1.34mi |
| 1024 Colerick St Fort Wayne, IN | 4.0 | 1.0 | 1388 | $1,065 | $0.77 | 23d | 1 | 1.45mi |
| 112 W Washington Blvd Fort Wayne, IN | 1.0–2.0 | 1.0–2.0 | 768 | $1,500 | $1.95 | 23d | 2 | 1.48mi |
| 859 Buchanan St Fort Wayne, IN | 1.0–4.0 | 1.0 | 887 | $1,074 | $1.21 | 23d | 1 | 1.50mi |
Listing history 13 events
-
2026-06-22days on market $129,900 Active 194 DOM
-
2026-06-18days on market $129,900 Active 191 DOM
-
2026-06-17days on market $129,900 Active 190 DOM
-
2026-06-16days on market $129,900 Active 189 DOM
-
2026-06-15days on market $129,900 Active 188 DOM
-
2026-06-14days on market $129,900 Active 186 DOM
-
2026-06-10remarks 687-char remark
-
2026-06-10pricedays on market $129,900 Active 183 DOM
-
2025-12-08price $139,900 399-char remark
Show marketing remark (399 chars)
Fresh update & peace of mind! A recent waterline improvement has addressed prior basement concerns. Inside you will find 2 large bedrooms and a bathroom on the upper level, and a flexible floorplan on the main with the option to create a main floor bedroom or future suite. Move right in or personalize over time, this home offers space, character and opportunity at an affordable price point.
-
2025-11-26$142,000 Active 399-char remark
Show marketing remark (399 chars)
Fresh update & peace of mind! A recent waterline improvement has addressed prior basement concerns. Inside you will find 2 large bedrooms and a bathroom on the upper level, and a flexible floorplan on the main with the option to create a main floor bedroom or future suite. Move right in or personalize over time, this home offers space, character and opportunity at an affordable price point.
-
2025-05-02$130,000 Active
-
2012-09-07soldstatus $40,000
-
2010-05-25soldstatus $40,000
ⓘ Source: listings_history table (triggers on properties + properties_extension) + one-shot
backfill from property_details.listing_events for pre-trigger history.
Tax reassessment forecast IN · Partial reset (capped growth)
- Current annual tax
- $3,157 · $263/mo
- Projected year-2 tax
- $3,157 · $263/mo
- Expected delta
- $0/yr ($0/mo · 0.0%)
ⓘ Screening estimate from a state-policy table — verify with the county assessor before closing.
Climate risk First Street
- Flood 1/10 Low FEMA zone X (unshaded) · 0% chance over 30 yrs
- Wildfire 1/10 Low
- Heat 3/10 Moderate 7 d/yr ≥100°F today · 17 d/yr by 30 yrs out
- Wind 2/10 Low
- Air quality 3/10 Moderate 2 unhealthy d/yr today · 3 by 30 yrs out
Nearby sold comps map
Loading sold comps map…
Walkable amenities ~0.75 mi
Loading nearby amenities…
Taxation est. · year 1
- Rental income
- $14,511
- − Mortgage interest
- −$7,276
- − Property taxes
- −$3,157
- − Insurance
- −$650
- − Repairs & maintenance
- −$1,161
- − Management
- −$1,161
- − Depreciation
- −$3,779
- Taxable loss
- −$2,673
- Est. tax savings @ 24.0%
- +$642
- After-tax cash flow
- $124/yr
For passive investors: Depreciation is non-cash, so a rental often shows a tax loss while cash-flowing — sheltering income. Rental losses are passive: they offset passive income freely, and up to $25,000/yr can offset ordinary (W-2) income if you actively participate and your MAGI is under $100k (phasing out to $0 by $150k); unused losses carry forward. On sale, claimed depreciation is recaptured at up to 25%, and gains may owe capital-gains tax (a 1031 exchange can defer both). Figures are a year-1 estimate at your 24.0% rate — not tax advice; consult a CPA.
Schools (NCES district)
- District
- Fort Wayne Community Schools
- NCES district ID
- 1803630
- Math proficiency
- 22% ▼ -11.00%
- Reading proficiency
- 29% ▼ -7.00%
- Median HH income
- $41,951
- Composite
- 21.68/100
- National rank
- #8275
- State rank
- #263 of 301 in IN
Livability — Fort Wayne
- Score
- 84/100
- State rank
- #6
- US rank
- #676
Category grades
Schools grade is shown separately in the Schools card above.
Census & demographics
- Census place
- Fort Wayne, IN
- County
- Allen County · 326,813 people
- City population
- 326,813
- Metro
- Fort Wayne, IN
- Population (ZIP)
- 16,317
- Household income
- $58,685
- Rent vs Own
- Severe rent burden
- 680.0
Population outlook (Allen County) Hauer SSP2
- Today (2025)
- 394,020 people
- By 2030
- 405,128 · +2.8%
- By 2040
- 423,476 · +7.5%
- By 2050
- 435,137 · +10.4%
- By 2075
- 450,293 · +14.3%
- By 2100
- 424,101 · +7.6%
Race, ethnicity, and origin ACS 2023
- Neighborhood character
- Diverse neighborhood (Simpson 0.66)
- Race & ethnicity
- White 54% Two or more races 19% Hispanic / Latino 16% Black 14% Asian 4%
- Hispanic origin (detail)
- Mexican 15%
- Common ancestry
- Slovak 3% Lithuanian 3% Romanian 2%
- Foreign-born
- 9% · Canada, Philippines, Jamaica
- Languages at home
- 82% English-only · Spanish 13% Other Asian/Pacific 4% German/W. Germanic 1%
Political lean MEDSL · Allen
- 2024 margin
- R (+12.5) · D 42.9% · R 55.4% · Other 1.7%
- 2008→2024 swing
- -8.1pp toward R · 2008: -4.3pp · 2024: -12.5pp
- All cycles
- 2024: R+12.5 2020: R+11.2 2016: R+19.6 2012: R+16.8 2008: R+4.3
Not yet ingested
- Civics
- —
Market trends
- HPI YoY
- ▼ -318.66%
- Current HPI
- 272.6238
- Rent YoY
- ▲ 8.24%
- Metro
- Fort Wayne, IN
- State GDP YoY
- ▲ 2.90%
- F500 in state
- 18
Industry mix (Fortune 500 HQ in IN)
| Industry | F500 HQs | Revenue |
|---|---|---|
| Industrial Machinery | 2 | $37B |
|
||
| Healthcare | 1 | $177B |
|
||
| Pharmaceuticals | 1 | $45B |
|
||
| Metals / Steel | 1 | $18B |
|
||
| Agriculture | 1 | $17B |
|
||
| Packaging | 1 | $12B |
|
||
Price history
+249.8% since first listed5 events — show timeline
- 2025-12-08 Price Changed $139,900 IRMLS
- 2025-11-26 Listed $142,000 IRMLS
- 2025-05-02 Listed $130,000 IRMLS
- 2012-09-07 Sold (Public Records) $40,000 Public Records
- 2010-05-25 Sold (Public Records) $40,000 Public Records
Property tax history
+16.6%/yrLatest (2024): $3,157 · -1.9% YoY. Source: county tax records.
Cash-flow waterfall
monthlySold comps — $/sqft
last 12 mo · ≤1 miLoading sold comps…