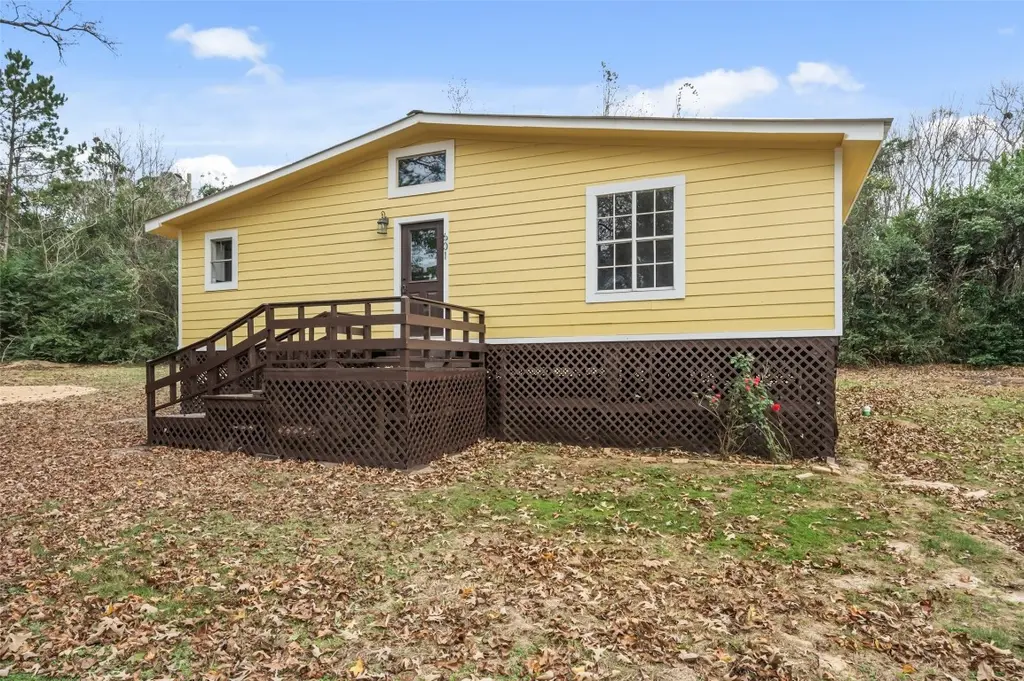
(.25 ac) 601 Faulkner Ave · Coldspring, TX
Flood risk 8/10 · Major
- FEMA flood zone
- X (unshaded)
- Chance of flooding over 30 yrs
- 0.99%
- Est. flood insurance / yr
- $507 – $1,088
Fire risk 4/10 · Minor
- Est. fire insurance / yr
- $1,222 – $2,270
Heat risk 8/10 · Major
- Hot days now (above 111°F)
- 7 days/yr
- Hot days in 30 yrs
- 24 days/yr
Wind risk 8/10 · Major
- Chance of severe wind over 30 yrs
- 99.0%
Air-quality risk 1/10 · Minimal
- Unhealthy air days now
- 0 days/yr
- Unhealthy air days in 30 yrs
- 0 days/yr
Risk factors via First Street. Map © Google.
Why this score? — see what drove the F grade
The composite is a weighted blend of 9 inputs, each scored 0–100. Each bar is that input's sub-score; the figure is the points it added to the 100-point composite (weight × sub-score).
- ARV discount +7.5/15.0
- Livability +2.8/5.0
- Rent growth +2.5/5.0
- Condition / age +2.5/5.0
- Schools +2.0/10.0
- Cash flow +0.0/30.0
- 1% rule +0.0/10.0
- DSCR +0.0/10.0
- Appreciation +0.0/10.0
$29,788
🖨 Deal sheet 📄 Offer letter ✓ Due diligence
Listing remarks MLS
Welcome to your new home! This beautifully renovated residence offers 2 bedrooms and 1 bath. This home offers a wonderful retreat from the hustle and bustle of city life. Don't miss the opportunity to make this stunning property your own. Schedule a viewing today and experience the beauty and comfort it has to offer!
Key facts
- 0.25 acre lot
- Listed 73 days
Neighborhood map
What this means for you Summary
Snapshot
- This is a manufactured listed at $30k.
Deal economics
- At list price, monthly cash flow is $-286 ($-3k/yr) — negative.
- Rent doesn't cover operating costs at any purchase price — skip.
- Recommended offer: $28k (6.0% below list) — sets the bar for market timing.
- Cap rate -2.5% vs local median 4.3% in Coldspring — below-typical yield; the buyer is paying a premium for something (appreciation thesis, condition, location) that the cap rate doesn't capture.
Location & tenants
- Location reads 55/100 on livability (#1,357 in TX) — a working-class tenant base; expect higher turnover. Strengths: cost of living A+, housing A+; Watch: crime D, schools F, amenities F.
- Coldspring-Oakhurst CISD (rural): math 18% / reading 28% proficiency, ranked #732 of 826 in TX (top 89%) — low school quality limits family demand, transient renter base, plan for 1-2y turnover; 60% free/reduced lunch — lower-income household profile, screen leases tightly.
- Market conditions: 362 active listings in the ZIP; 575 units permitted in San Jacinto County in 2024 (0 in 5+ unit buildings).
Forward outlook
- Local home prices are declining (-3.0%/yr); year-one equity from $206 of loan paydown is wiped out by about $894 of value loss. Plan a longer hold.
- San Jacinto County population projected at +7% by 2050 — modest demand growth; plan on rents tracking national, not racing it.
Negotiation context
- It's been on market 74 days — a 6% lower offer ($28k) is reasonable based on typical stale-listing flexibility.
- 9 sale attempts since 10y ago; this cycle's ask has dropped $130k (81%) from the opening price — seller is motivated, your offer sets the floor, not the list.
Risks & watch-outs
- Watch-outs: flood insurance adds $66/mo.
- Climate carrying-cost: severe flood risk; severe wind risk, 99% chance of damaging wind over 30y; extreme-heat days projected 7→24/yr by 2055 (HVAC capex compounding) — expect insurance premiums to compound above CPI over the hold.
Questions for the listing agent
- What do current leases actually rent for vs. the listed asking? Can we see a recent rent roll and the last 12 months of T-12 income?
- It's been on market 74 days. Have you received any prior offers? Is the seller open to a 6% concession, seller financing, or rate buy-down credit?
- What's the actual annual flood-insurance premium (NFIP or private), and is the property in a SFHA with mandatory coverage?
- Why hasn't it sold? Are there any deal-killer items the seller is aware of (foundation, flood, title, zoning, code violations)?
- Is there a deadline driving the sale (1031 exchange, divorce, estate, relocation)? That informs how much negotiation room exists.
- Schools are F-rated, which usually means shorter tenancies and higher turnover. Who's the typical renter profile here, and what's been the actual vacancy rate?
- Crime grade is D in this area — have there been break-ins, vandalism, or insurance claims at this property in the last 3 years? What carrier currently insures it and at what premium?
- The area grade is low — what's the realistic commute time and amenity access for the typical tenant pool here? Any planned neighborhood developments (good or bad) we should know about?
- What's the average days-on-market for RENTAL listings here right now (not sales)? A rising rental-DOM trend means longer vacancies and softer asking-rent achievability than the comps imply.
- What's the recent tenant-quality profile in this submarket — average credit score on applications, eviction rate, late-payment / NSF rate, and stable-employment percentage? A property-management company in the area should have these aggregated.
- How much new for-sale + rental construction is in the pipeline within 1–3 miles? Heavy new supply typically softens prices + rents 12–24 months out; constrained supply supports both.
Investment metrics
- 1% rule
- 0.00% ✗
- Cap rate
- -2.55%
- Cash-on-cash
- -31.57%
- DSCR
- -0.40
- GRM
- 0.0
CMA / ARV
- ARV (median comp)
- $180,604
- List price
- $29,788
- Delta
- -11.53%
- Verdict
- UNDERPRICED
- Comps
- 20 within 1.0 mi
Show comp detail 1 sale within ~0.75 mi
| Address | Dist | Beds/Ba | Sqft | Sold | Price | $/sf | Match |
|---|---|---|---|---|---|---|---|
| 2595 Fm 222 Loop N | 0.47mi | 3/2.0 | 1,120 (-4%) | 6mo | $179,000 | $160 | 66 |
Match score weights: distance 35% · size 25% · config 20% · recency 20%. Top-matched comps best support the ARV.
Projected returns pro-forma
-3.0% appreciation · 3.0% rent growth · sell at horizon
- IRR
- —
- Equity multiple
- -1.76×
- Total profit
- $-22,985
- Equity at exit
- $4,441
- IRR
- —
- Equity multiple
- -4.19×
- Total profit
- $-43,259
- Equity at exit
- $2,576
Cash invested: $8,341 (down + closing). Projections, not guarantees.
Landlord ↔ Tenant lean methodology
- Overall (STATE)
- 87 Strongly Landlord-Friendly
- State Texas
- 87 Strongly Landlord-Friendly · R+5
- County
- — inherits STATE
- City
- — inherits STATE
ZIP-level market 77331
- Active inventory
- 362
Monthly cashflow live
- Estimated rent
- $0 none
- Mortgage (P&I)
- −$156
- Tax from tax record
- −$51 /mo · $609/yr
- Insurance
- −$12
- Flood insurance flood zone
- −$66 /mo · $798/yr
- HOA
- −$0
- Vacancy / Maint / Mgmt
- −$0
- Net cashflow
- $-286
Break-even live
UW: 25.0% down · 7.5% · 30yr · 1.5% tax · 5.0% vac · 8.0% maint · 8.0% mgmt
Financing live
Cash to close
- Down payment
- $7,447
- Closing costs
- $894
- Reserves months
- —
- Total cash needed
- —
Loan-product check · same deal, 3 products live
Conventional
25% down · 7.5% · 30yr
- Down + closing
- —
- Monthly P&I
- —
- Monthly cashflow
- —
- DSCR
- —
- Eligible?
- —
Personal DTI + credit; lowest rate.
DSCR
20% down · 8.5% · 30yr
- Down + closing
- —
- Monthly P&I
- —
- Monthly cashflow
- —
- DSCR
- —
- Eligible?
- —
No personal income docs; deal must DSCR.
Hard money
10% down · 12.0% · 12mo
- Down + closing
- —
- Monthly P&I
- —
- Monthly cashflow
- —
- DSCR
- —
- Eligible?
- —
Short-term bridge; refi at stabilization.
Listing history 36 events
-
2026-06-19days on market $29,788 Active 74 DOM
-
2026-06-18days on market $29,788 Active 73 DOM
-
2026-06-17pricedays on market $29,788 Active 72 DOM
-
2026-06-17days on market $159,788 Active 47 DOM
-
2026-06-16days on market $159,788 Active 46 DOM
-
2026-06-15days on market $159,788 Active 45 DOM
-
2026-06-14days on market $159,788 Active 43 DOM
-
2026-06-13days on market $159,788 Active 42 DOM
-
2026-06-10days on market $159,788 Active 40 DOM
-
2026-06-09days on market $159,788 Active 39 DOM
-
2026-06-08days on market $159,788 Active 38 DOM
-
2026-06-07days on market $159,788 Active 37 DOM
-
2026-06-03days on market $159,788 Active 33 DOM
-
2026-06-02days on market $159,788 Active 32 DOM
-
2026-06-01days on market $159,788 Active 31 DOM
-
2026-05-31days on market $159,788 Active 30 DOM
-
2026-05-30days on market $159,788 Active 29 DOM
-
2026-05-01$159,788 Active 318-char remark
Show marketing remark (318 chars)
Welcome to your new home! This beautifully renovated residence offers 2 bedrooms and 1 bath. This home offers a wonderful retreat from the hustle and bustle of city life. Don't miss the opportunity to make this stunning property your own. Schedule a viewing today and experience the beauty and comfort it has to offer!
-
2026-04-17historical
-
2026-04-06$29,788 Active
-
2026-04-01historical
-
2026-02-19$167,788 Active
-
2026-02-16historical
-
2025-12-31$175,000 Active
-
2025-10-29$35,000 Active
-
2024-12-05historical
-
2024-10-03price $133,000
-
2024-06-07$143,000 Active
-
2024-05-16historical
-
2024-05-10price $129,900
-
2024-04-17$149,900 Active
-
2016-11-12historical
-
2016-07-11price $75,900
-
2016-06-14status Active
-
2016-06-09historical
-
2016-05-12$64,500 Active
ⓘ Source: listings_history table (triggers on properties + properties_extension) + one-shot
backfill from property_details.listing_events for pre-trigger history.
Tax reassessment forecast TX · Resets to sale price
- Current annual tax
- $609 · $51/mo
- Projected year-2 tax
- $609 · $51/mo
- Expected delta
- $0/yr ($0/mo · 0.0%)
ⓘ Screening estimate from a state-policy table — verify with the county assessor before closing.
Climate risk First Street
- Flood 8/10 Severe FEMA zone X (unshaded) · 99% chance over 30 yrs
- Wildfire 4/10 Moderate
- Heat 8/10 Severe 7 d/yr ≥111°F today · 24 d/yr by 30 yrs out
- Wind 8/10 Severe 99% chance of damaging wind over 30 yrs
- Air quality 1/10 Low 0 unhealthy d/yr today · 0 by 30 yrs out
Nearby sold comps map
Loading sold comps map…
Walkable amenities ~0.75 mi
Loading nearby amenities…
Taxation est. · year 1
- Rental income
- $0
- − Mortgage interest
- −$1,669
- − Property taxes
- −$609
- − Insurance
- −$946
- − Repairs & maintenance
- −$0
- − Management
- −$0
- − Depreciation
- −$867
- Taxable loss
- −$4,091
- Est. tax savings @ 24.0%
- +$982
- After-tax cash flow
- $-2,449/yr
For passive investors: Depreciation is non-cash, so a rental often shows a tax loss while cash-flowing — sheltering income. Rental losses are passive: they offset passive income freely, and up to $25,000/yr can offset ordinary (W-2) income if you actively participate and your MAGI is under $100k (phasing out to $0 by $150k); unused losses carry forward. On sale, claimed depreciation is recaptured at up to 25%, and gains may owe capital-gains tax (a 1031 exchange can defer both). Figures are a year-1 estimate at your 24.0% rate — not tax advice; consult a CPA.
Schools (NCES district)
- District
- Coldspring-Oakhurst CISD
- NCES district ID
- 4814520
- Math proficiency
- 18% ▼ -9.00%
- Reading proficiency
- 28% ▼ -2.00%
- Median HH income
- $46,916
- Composite
- 20.07/100
- National rank
- #8653
- State rank
- #732 of 826 in TX
Livability — Coldspring
- Score
- 55/100
- State rank
- #1357
- US rank
- #23364
Category grades
Schools grade is shown separately in the Schools card above.
Census & demographics
- Census place
- Coldspring, TX
- Population (ZIP)
- 7,348
Population outlook (San Jacinto County) Hauer SSP2
- Today (2025)
- 29,069 people
- By 2030
- 29,750 · +2.3%
- By 2040
- 30,714 · +5.7%
- By 2050
- 31,010 · +6.7%
- By 2075
- 31,616 · +8.8%
- By 2100
- 29,874 · +2.8%
Race, ethnicity, and origin ACS 2023
- Neighborhood character
- Predominantly White (78%)
- Race & ethnicity
- White 78% Black 13% Two or more races 8% Hispanic / Latino 4%
- Common ancestry
- Slovak 3% Italian 2% Romanian 2%
- Foreign-born
- 3% · Canada
- Languages at home
- 94% English-only · Spanish 5% Arabic 1%
Political lean MEDSL · San Jacinto
- 2024 margin
- Solid R (+65.3) · D 17.0% · R 82.3%
- 2008→2024 swing
- -27.0pp toward R · 2008: -38.3pp · 2024: -65.3pp
- All cycles
- 2024: R+65.3 2020: R+61.9 2016: R+58.4 2012: R+48.9 2008: R+38.3
Not yet ingested
- Civics
- —
Market trends
- HPI YoY
- ▼ -146.98%
- Current HPI
- 199.0493
- Rent YoY
- —
- Metro
- —
- State GDP YoY
- ▲ 3.95%
- F500 in state
- 110
Industry mix (Fortune 500 HQ in TX)
| Industry | F500 HQs | Revenue |
|---|---|---|
| Energy | 16 | $1,198B |
|
||
| Technology | 5 | $198B |
|
||
| Engineering / Construction | 4 | $72B |
|
||
| Energy Services | 3 | $60B |
|
||
| Utilities | 3 | $41B |
|
||
| Healthcare | 2 | $330B |
|
||
Price history
+147.7% since first listed19 events — show timeline
- 2026-05-01 Listed $159,788 HARMLS
- 2026-04-17 Listing Removed — HARMLS
- 2026-04-06 Listed $29,788 HARMLS
- 2026-04-01 Listing Removed — HARMLS
- 2026-02-19 Listed $167,788 HARMLS
- 2026-02-16 Listing Removed — HARMLS
- 2025-12-31 Listed $175,000 HARMLS
- 2025-10-29 Listed $35,000 HARMLS
- 2024-12-05 Listing Removed — HARMLS
- 2024-10-03 Price Changed $133,000 HARMLS
- 2024-06-07 Listed $143,000 HARMLS
- 2024-05-16 Listing Removed — HARMLS
- 2024-05-10 Price Changed $129,900 HARMLS
- 2024-04-17 Listed $149,900 HARMLS
- 2016-11-12 Listing Removed — HARMLS
- 2016-07-11 Price Changed $75,900 HARMLS
- 2016-06-14 Relisted — HARMLS
- 2016-06-09 Listing Removed — HARMLS
- 2016-05-12 Listed $64,500 HARMLS
Property tax history
-7.3%/yrLatest (2023): $609 · -2.9% YoY. Source: county tax records.
Cash-flow waterfall
monthlySold comps — $/sqft
last 12 mo · ≤1 miLoading sold comps…