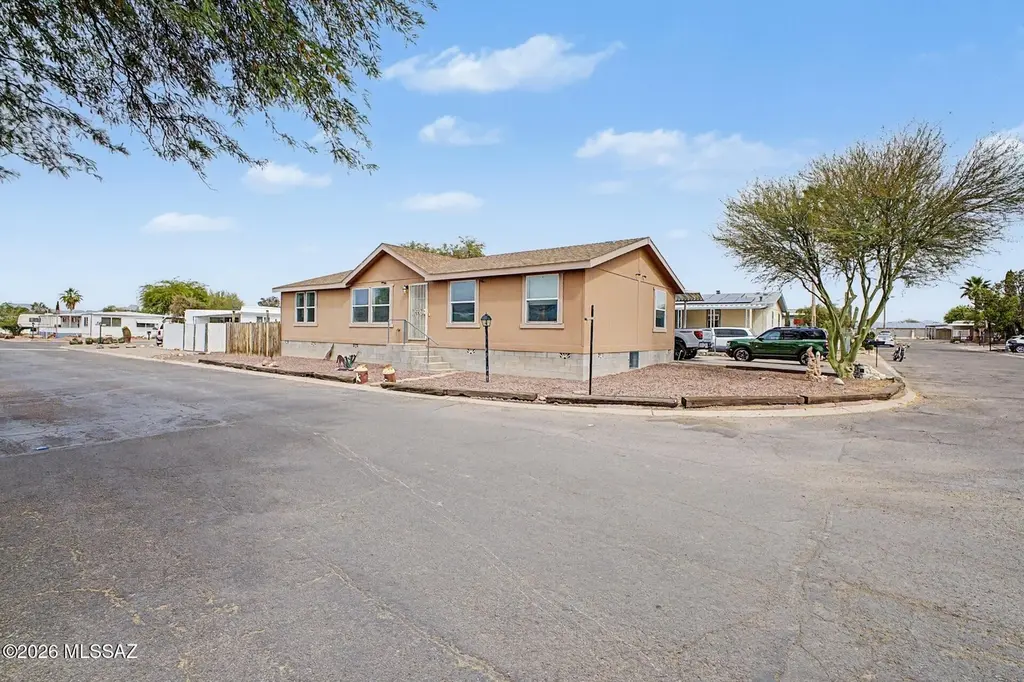
6311 N Quince Way · Casas Adobes, AZ
Flood risk 4/10 · Minor
- FEMA flood zone
- X (unshaded)
- Chance of flooding over 30 yrs
- 0.22%
- Est. flood insurance / yr
- $507 – $1,088
Fire risk 5/10 · Moderate
- Est. fire insurance / yr
- $610 – $1,132
Heat risk 8/10 · Major
- Hot days now (above 107°F)
- 6 days/yr
- Hot days in 30 yrs
- 14 days/yr
Wind risk 1/10 · Minimal
- Chance of severe wind over 30 yrs
- —
Air-quality risk 1/10 · Minimal
- Unhealthy air days now
- 0 days/yr
- Unhealthy air days in 30 yrs
- 0 days/yr
Risk factors via First Street. Map © Google.
Why this score? — see what drove the C+ grade
The composite is a weighted blend of 9 inputs, each scored 0–100. Each bar is that input's sub-score; the figure is the points it added to the 100-point composite (weight × sub-score).
- Cash flow +25.1/30.0
- ARV discount +13.3/15.0
- DSCR +8.2/10.0
- 1% rule +5.8/10.0
- Livability +4.0/5.0
- Rent growth +3.0/5.0
- Condition / age +2.5/5.0
- Schools +2.2/10.0
- Appreciation +0.0/10.0
$190,000
🖨 Deal sheet 📄 Offer letter ✓ Due diligence
Listing remarks
This well-maintained 4-bedroom, 2-bath manufactured home offers a functional layout with room for everyone. Whether you need extra bedrooms, a home office, or space for guests, this one checks the boxes. Step outside and you'll find one of the standout features a large, fully fenced lot. Perfect for pets, toys, entertaining, or just enjoying your own private outdoor space . Located in the Orange Grove Mobile Estates community, you'll enjoy convenient access to shopping, dining, and everyday essentials while still having a sense of space and privacy. Whether you're a first-time buyer, downsizing, or looking for a solid investment, this property delivers value, flexibility, and room to live.
Key facts
- Fully fenced lot
- 5,358 sq ft lot
- Garage
Tags
Neighborhood map
What this means for you Summary
Snapshot
- This is a 4-bed/2.0-bath manufactured listed at $190k.
Deal economics
- At list price, monthly cash flow is $418 ($5k/yr) — positive.
- The deal already cash-flows at list — no discount required.
- Meets the 1% rule at list price ($2k rent vs $190k).
- Cap rate 8.9% vs local median 3.5% in Casas Adobes — top-decile yield for the area; either an underpriced asset or a hidden risk that comps aren't pricing in. Stress-test before assuming the spread holds.
Location & tenants
- Location reads 79/100 on livability (#8 in AZ, #2,353 nationally) — a middle-class / working-renter tenant base. Strengths: housing A+, health & safety A, employment B+; Watch: amenities D.
- Flowing Wells Unified District (4405) (suburban): math 23% / reading 30% proficiency, ranked #143 of 249 in AZ (top 57%) — low school quality limits family demand, transient renter base, plan for 1-2y turnover; 64% free/reduced lunch — lower-income household profile, screen leases tightly.
- Zoned schools: J Robert Hendricks Elementary School (math 43% / reading 46%, grade F, #339 of 1,109 statewide, top 32%, 469 students, 61% FRL); Flowing Wells Junior High School (math 24% / reading 28%, grade F, #100 of 218 statewide, top 47%, 818 students, 74% FRL); Flowing Wells High School (math 22% / reading 24%, grade F, #208 of 381 statewide, top 55%, 1,694 students, 65% FRL) — zoned schools at 66% FRL track the district average.
- Market conditions: Rents rising (+1.9%/yr); 92 active listings in the ZIP; 18 comparable units currently listed for rent nearby; rentals at typical pace (median 24d on market — plan ~3-4 weeks tenant-placement turnaround); solid renter incomes; 5,268 units permitted in Pima County in 2024 (996 in 5+ unit buildings).
- This rent runs 32% of the median local income ($76k/yr) — at the standard rent-burdened threshold; future hikes will face affordability resistance.
Forward outlook
- Local home prices are declining (-3.0%/yr); year-one equity from $1k of loan paydown is wiped out by about $6k of value loss. Plan a longer hold.
- Pima County population projected at +8% by 2050 — modest demand growth; plan on rents tracking national, not racing it.
Negotiation context
- Only 3 days on market — expect competitive offers; lowballing is unlikely to land.
- Current owner paid $65k; list at $190k implies a 192% gain — meaningful room to come down on a strong offer.
Risks & watch-outs
- Climate carrying-cost: moderate wildfire risk; extreme-heat days projected 6→14/yr by 2055 (HVAC capex compounding) — expect insurance premiums to compound above CPI over the hold.
Questions for the listing agent
- What does the HOA fee cover, when was the last increase, and are there any pending special assessments or reserve-fund shortfalls?
- Is there a deadline driving the sale (1031 exchange, divorce, estate, relocation)? That informs how much negotiation room exists.
- What's the average days-on-market for RENTAL listings here right now (not sales)? A rising rental-DOM trend means longer vacancies and softer asking-rent achievability than the comps imply.
- What's the recent tenant-quality profile in this submarket — average credit score on applications, eviction rate, late-payment / NSF rate, and stable-employment percentage? A property-management company in the area should have these aggregated.
- How much new for-sale + rental construction is in the pipeline within 1–3 miles? Heavy new supply typically softens prices + rents 12–24 months out; constrained supply supports both.
Investment metrics
- 1% rule
- 1.08% ✓
- Cap rate
- 8.93%
- Cash-on-cash
- 9.42%
- DSCR
- 1.42
- GRM
- 7.7
CMA / ARV
- ARV (on-the-fly)
- $217,952
- Comps found
- 6
Show comp detail 6 sales within ~0.75 mi
| Address | Dist | Beds/Ba | Sqft | Sold | Price | $/sf | Match |
|---|---|---|---|---|---|---|---|
| 6311 N Quince Way | 0.00mi | 4/2.0 | 1,568 (0%) | 1mo | $190,000 | $121 | 99 |
| 3588 W Grape Dr | 0.12mi | 3/2.0 (-1) | 1,440 (-8%) | 10mo | $200,000 | $139 | 68 |
| 6361 N Lime Way | 0.07mi | 3/2.0 (-1) | 1,450 (-8%) | 14mo | $154,000 | $106 | 68 |
| 3411 W Apricot Dr | 0.12mi | 3/2.0 (-1) | 1,632 (+4%) | 20mo | $175,000 | $107 | 66 |
| 3531 W Cantaloupe Dr | 0.15mi | 3/2.0 (-1) | 1,344 (-14%) | 6mo | $235,000 | $175 | 59 |
| 6361 N Quince Way | 0.06mi | 3/2.0 (-1) | 1,344 (-14%) | 18mo | $225,000 | $167 | 53 |
Match score weights: distance 35% · size 25% · config 20% · recency 20%. Top-matched comps best support the ARV.
Projected returns pro-forma
-3.0% appreciation · 1.88% rent growth · sell at horizon
- IRR
- -3.3%
- Equity multiple
- 0.88×
- Total profit
- $-6,507
- Equity at exit
- $28,330
- IRR
- 5.2%
- Equity multiple
- 1.36×
- Total profit
- $19,281
- Equity at exit
- $16,428
Cash invested: $53,200 (down + closing). Projections, not guarantees.
Landlord ↔ Tenant lean methodology
- Overall (STATE)
- 87 Strongly Landlord-Friendly
- State Arizona
- 87 Strongly Landlord-Friendly · R+3
- County
- — inherits STATE
- City
- — inherits STATE
ZIP-level market 85741
- Rents YoY
- 1.9%
- Active inventory
- 92
- Price-to-rent
- 7.7×
Monthly cashflow live
- Estimated rent
- $2,044 high interval (Pro) →
- Mortgage (P&I)
- −$996
- Tax from tax record
- −$44 /mo · $525/yr
- Insurance
- −$79
- HOA
- −$78
- Vacancy / Maint / Mgmt
- −$429
- Net cashflow
- $418
Break-even live
UW: 25.0% down · 7.5% · 30yr · 1.5% tax · 5.0% vac · 8.0% maint · 8.0% mgmt
Financing live
Cash to close
- Down payment
- $47,500
- Closing costs
- $5,700
- Reserves months
- —
- Total cash needed
- —
Loan-product check · same deal, 3 products live
Conventional
25% down · 7.5% · 30yr
- Down + closing
- —
- Monthly P&I
- —
- Monthly cashflow
- —
- DSCR
- —
- Eligible?
- —
Personal DTI + credit; lowest rate.
DSCR
20% down · 8.5% · 30yr
- Down + closing
- —
- Monthly P&I
- —
- Monthly cashflow
- —
- DSCR
- —
- Eligible?
- —
No personal income docs; deal must DSCR.
Hard money
10% down · 12.0% · 12mo
- Down + closing
- —
- Monthly P&I
- —
- Monthly cashflow
- —
- DSCR
- —
- Eligible?
- —
Short-term bridge; refi at stabilization.
Rent comps 18 comps
| Address | Beds | Baths | Sqft | Rent | $/sqft | DOM | Units | Dist |
|---|---|---|---|---|---|---|---|---|
| 3530 W Ethan Crossing Ln Tucson, AZ | 4.0 | 2.0 | 1515 | $2,200 | $1.45 | 23d | 1 | 0.21mi |
| 3500 W Orange Grove Rd Tucson, AZ | 3.0 | 2.0 | 1200 | $1,669 | $1.39 | 23d | 1 | 0.25mi |
| 6491 N Lena Way Tucson, AZ | 3.0 | 2.0 | 1349 | $2,195 | $1.63 | 3d | 1 | 0.44mi |
| 6718 N Positano Way Tucson, AZ | 3.0 | 2.0 | 1359 | $1,796 | $1.32 | 3d | 1 | 0.64mi |
| 3777 W Horizon Hills Dr Tucson, AZ | 3.0 | 2.0 | 1263 | $1,750 | $1.39 | 23d | 1 | 0.68mi |
| 3213 W Northstar Dr Tucson, AZ | 4.0 | 2.0 | 1270 | $1,800 | $1.42 | 43d | 1 | 0.79mi |
| 3073 W Placita Montessa Tucson, AZ | 3.0 | 2.0 | 1479 | $1,900 | $1.28 | 23d | 1 | 0.94mi |
| 3201 W Ina Rd Tucson, AZ | 1.0–3.0 | 1.0–2.0 | 803 | $1,895 | $2.36 | 43d | 34 | 1.04mi |
| 4105 W Aerie Dr Tucson, AZ | 1.0–3.0 | 1.0–2.0 | 1257 | $4,300 | $3.42 | 1d | 24 | 1.09mi |
| 3220 W Ina Rd Tucson, AZ | 3.0 | 2.0 | 1180 | $1,871 | $1.59 | 44d | 1 | 1.12mi |
| 3220 W Ina Rd Tucson, AZ | 3.0 | 2.0 | 1180 | $1,848 | $1.57 | 11d | 1 | 1.12mi |
| 5841 N Belbrook Dr Tucson, AZ | 3.0 | 2.5 | 1619 | $2,200 | $1.36 | 16d | 1 | 1.21mi |
| 3415 W Simone St Tucson, AZ | 3.0 | 2.0 | 1418 | $1,925 | $1.36 | 43d | 1 | 1.28mi |
| 7406 N Boston Pl Tucson, AZ | 3.0 | 1.0 | 1095 | $1,750 | $1.60 | 23d | 1 | 1.34mi |
| 2356 W Ian Pl Tucson, AZ | 3.0 | 2.0 | 1595 | $2,200 | $1.38 | 1d | 1 | 1.38mi |
| 2255 W Orange Grove Rd Tucson, AZ | 1.0–3.0 | 1.0–2.0 | 858 | $1,649 | $1.92 | 11d | 7 | 1.39mi |
| 7490 N Thornwood Rd Tucson, AZ | 3.0 | 2.0 | 1600 | $2,000 | $1.25 | 43d | 1 | 1.44mi |
| 7290 N Oldfather Rd Unit 404 Tucson, AZ | 3.0 | 2.5 | 1321 | $1,825 | $1.38 | 21d | 1 | 1.48mi |
HOA detail
- Monthly dues
- $78 · $936/yr
Listing history 3 events
-
2026-04-21status Pending
-
2026-04-17$190,000 Active
-
2002-08-27soldstatus $65,000
ⓘ Source: listings_history table (triggers on properties + properties_extension) + one-shot
backfill from property_details.listing_events for pre-trigger history.
Tax reassessment forecast AZ · Resets to sale price
- Current annual tax
- $525 · $44/mo
- Projected year-2 tax
- $1,254 · $104/mo
- Expected delta
- +$729/yr (+$61/mo · 139.0%)
ⓘ Screening estimate from a state-policy table — verify with the county assessor before closing.
Climate risk First Street
- Flood 4/10 Moderate FEMA zone X (unshaded) · 22% chance over 30 yrs
- Wildfire 5/10 Major
- Heat 8/10 Severe 6 d/yr ≥107°F today · 14 d/yr by 30 yrs out
- Wind 1/10 Low
- Air quality 1/10 Low 0 unhealthy d/yr today · 0 by 30 yrs out
Nearby sold comps map
Loading sold comps map…
Walkable amenities ~0.75 mi
Loading nearby amenities…
Taxation est. · year 1
- Rental income
- $24,530
- − Mortgage interest
- −$10,643
- − Property taxes
- −$525
- − Insurance
- −$950
- − Repairs & maintenance
- −$1,962
- − Management
- −$1,962
- − HOA
- −$936
- − Depreciation
- −$5,527
- Taxable income
- $2,024
- Est. tax owed @ 24.0%
- −$486
- After-tax cash flow
- $4,526/yr
For passive investors: Depreciation is non-cash, so a rental often shows a tax loss while cash-flowing — sheltering income. Rental losses are passive: they offset passive income freely, and up to $25,000/yr can offset ordinary (W-2) income if you actively participate and your MAGI is under $100k (phasing out to $0 by $150k); unused losses carry forward. On sale, claimed depreciation is recaptured at up to 25%, and gains may owe capital-gains tax (a 1031 exchange can defer both). Figures are a year-1 estimate at your 24.0% rate — not tax advice; consult a CPA.
Schools (NCES district)
- District
- Flowing Wells Unified District (4405)
- NCES district ID
- 0403010
- Math proficiency
- 23% ▼ -19.00%
- Reading proficiency
- 30% ▼ -14.00%
- Median HH income
- $33,361
- Composite
- 21.69/100
- National rank
- #8271
- State rank
- #143 of 249 in AZ
Livability — Casas Adobes
- Score
- 79/100
- State rank
- #8
- US rank
- #2353
Category grades
Schools grade is shown separately in the Schools card above.
Census & demographics
- Census place
- Casas Adobes, AZ
- County
- Pima County · 1,012,107 people
- City population
- 67,940
- Metro
- Tucson, AZ
- Population (ZIP)
- 33,679
- Household income
- $76,271
- Rent vs Own
- Severe rent burden
- 1242.0
Population outlook (Pima County) Hauer SSP2
- Today (2025)
- 1,066,056 people
- By 2030
- 1,086,684 · +1.9%
- By 2040
- 1,117,160 · +4.8%
- By 2050
- 1,149,778 · +7.9%
- By 2075
- 1,271,480 · +19.3%
- By 2100
- 1,321,160 · +23.9%
Race, ethnicity, and origin ACS 2023
- Neighborhood character
- Diverse neighborhood (Simpson 0.62)
- Race & ethnicity
- White 53% Hispanic / Latino 31% Two or more races 21% Asian 5% Black 3% Native American 2%
- Hispanic origin (detail)
- Mexican 26% Puerto Rican 2%
- Common ancestry
- Italian 3% Romanian 3% Slovak 2%
- Foreign-born
- 10% · Canada, China, Jamaica
- Languages at home
- 81% English-only · Spanish 14% Chinese 1% Vietnamese 1%
Political lean MEDSL · Pima
- 2024 margin
- D (+15.2) · D 57.0% · R 41.8% · Other 1.2%
- 2008→2024 swing
- +9.1pp toward D · 2008: 6.1pp · 2024: 15.2pp
- All cycles
- 2024: D+15.2 2020: D+18.7 2016: D+13.5 2012: D+5.8 2008: D+6.1
Not yet ingested
- Civics
- —
Market trends
- HPI YoY
- ▼ -254.77%
- Current HPI
- 275.8273
- Rent YoY
- ▲ 1.88%
- Metro
- Tucson, AZ
- State GDP YoY
- ▲ 4.54%
- F500 in state
- 20
Industry mix (Fortune 500 HQ in AZ)
| Industry | F500 HQs | Revenue |
|---|---|---|
| Technology | 2 | $13B |
|
||
| Mining / Metals | 1 | $23B |
|
||
| Environmental Services | 1 | $16B |
|
||
| Metals / Steel | 1 | $14B |
|
||
| Technology Distribution | 1 | $9B |
|
||
| Homebuilding | 1 | $8B |
|
||
Price history
+192.3% since first listed3 events — show timeline
- 2026-04-21 Pending — MLSSAZ
- 2026-04-17 Listed $190,000 MLSSAZ
- 2002-08-27 Sold (Public Records) $65,000 Public Records
Property tax history
-2.1%/yrLatest (2025): $525 · +4.6% YoY. Source: county tax records.
Cash-flow waterfall
monthlySold comps — $/sqft
last 12 mo · ≤1 miLoading sold comps…