 Triplex
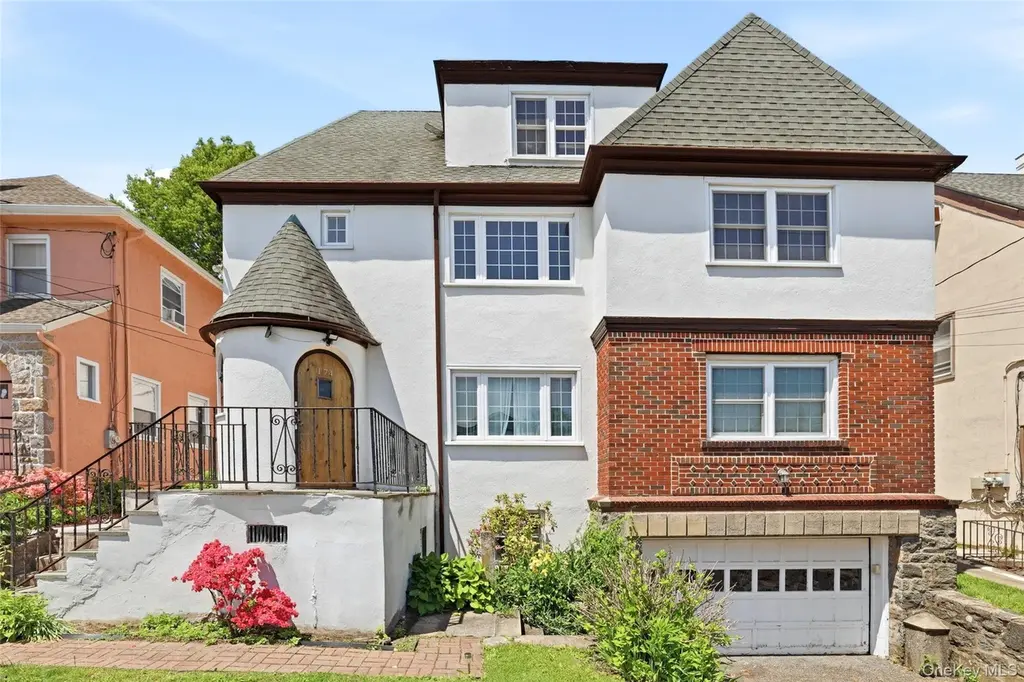
174 Fairview Ave · Port Chester, NY
Flood risk 1/10 · Minimal
- FEMA flood zone
- X (unshaded)
- Chance of flooding over 30 yrs
- 0.0%
- Est. flood insurance / yr
- $473 – $860
Fire risk 1/10 · Minimal
- Est. fire insurance / yr
- $691 – $1,283
Heat risk 6/10 · Moderate
- Hot days now (above 98°F)
- 7 days/yr
- Hot days in 30 yrs
- 16 days/yr
Wind risk 6/10 · Moderate
- Chance of severe wind over 30 yrs
- 27.0%
Air-quality risk 4/10 · Minor
- Unhealthy air days now
- 5 days/yr
- Unhealthy air days in 30 yrs
- 7 days/yr
Risk factors via First Street. Map © Google.
Why this score? — see what drove the B grade
The composite is a weighted blend of 9 inputs, each scored 0–100. Each bar is that input's sub-score; the figure is the points it added to the 100-point composite (weight × sub-score).
- Cash flow +30.0/30.0
- ARV discount +10.9/15.0
- 1% rule +10.0/10.0
- DSCR +10.0/10.0
- Schools +4.1/10.0
- Livability +3.7/5.0
- Condition / age +2.5/5.0
- Rent growth +2.1/5.0
- Appreciation +0.0/10.0
$899,000
🖨 Deal sheet (PDF) 📄 Offer letter ✓ Due diligence
Multi-family units
County records classify this as Multi-Family (2-4 Unit). Listing-text estimate: 3 units. confirmed
Listing remarks
On the market for the first time in over 30 years, this exceptional income-producing three-family home presents a rare opportunity for investors and end users alike. Family-owned and lovingly maintained for generations, this circa-1900 residence is filled with character, craftsmanship, and old-world charm that simply cannot be replicated today. Ideally located within walking distance of Port Chester schools and Rye Brook shops, the home offers three spacious and light-filled apartments, each loaded with warmth and architectural details. The turnkey first-floor unit features a gracious living room with fireplace, formal dining room, oversized eat-in kitchen, office area, two large bedrooms,
Key facts
- Three family home
- Flat backyard
- First floor unit
Tags
Property features AI
Finance
- Financial info: Property is a triplex (multifamily) with three residential units
Exterior
- Parking: Driveway; On-street parking; 1-car garage
- Utilities: Electricity connected (Con-Edison); Public sewer; Water connected
- Home design: Triplex; Actual condition
- Construction: Stucco construction
- Exterior features: Stucco exterior; Back yard; Garden; Landscaped; Level lot; Near public transit; Near shops; Near schools; Not waterfront
Interior
- Kitchen: Eat-in kitchen(s)
- Bedrooms: One 1-bedroom unit; Two 2-bedroom units
- Flooring: Combination flooring; Hardwood floors
- Bathrooms: Three full bathrooms
- Heating & cooling: Hot water heating; Natural gas heating; No central cooling
- Interior features: Chandelier; Eat-in kitchen; Storage; Patio access
- Laundry & utility: Laundry in basement
Neighborhood map
What this means for you Summary
Snapshot
- This is a 3 × 5-bed/3.0-bath units multifamily listed at $899k.
Deal economics
- At list price, monthly cash flow is $7k ($82k/yr) — positive. Per door: $2k/mo.
- The deal already cash-flows at list — no discount required.
- Meets the 1% rule at list price ($17k rent vs $899k).
- Recommended offer: $886k (1.5% below list) — sets the bar for market timing.
- Cap rate 15.4% vs local median 4.3% in Port Chester — top-decile yield for the area; either an underpriced asset or a hidden risk that comps aren't pricing in. Stress-test before assuming the spread holds.
Location & tenants
- Location reads 73/100 on livability (#315 in NY) — a middle-class / working-renter tenant base. Strengths: commute A+, employment A+, health & safety A; Watch: amenities D, cost of living F.
- Port Chester-Rye Union Free School District (suburban): math 44% / reading 49% proficiency, ranked #428 of 590 in NY (top 72%) — families likely to look elsewhere, expect single-tenant / working-renter base with shorter leases.
- Zoned schools: Park Avenue School (math 42% / reading 52%, grade D-, #1,195 of 2,108 statewide, top 60%, 446 students, 66% FRL); Port Chester Middle School (math 20% / reading 43%, grade F, #522 of 729 statewide, top 73%, 971 students, 75% FRL); Port Chester Senior High School (math 88% / reading 92%, grade A+, #238 of 1,100 statewide, top 23%, 1,555 students, 73% FRL).
- Market conditions: Rents soft (-1.7%/yr); 144 active listings in the ZIP; 4 comparable units currently listed for rent nearby; rentals leasing fast (median 12d on market — plan ~1-2 weeks tenant-placement turnaround); solid renter incomes; 954 units permitted in Westchester County in 2024 (649 in 5+ unit buildings).
- At $17,140/mo this rent would consume 195% of the median local household income ($106k/yr) (locally 1362% of renters already pay >50% of income on rent) — very limited rent-growth headroom before tenants either downsize or default.
Forward outlook
- Local home prices are declining (-3.0%/yr); year-one equity from $6k of loan paydown is wiped out by about $27k of value loss. Plan a longer hold.
- Westchester County population projected at +10% by 2050 — modest demand growth; plan on rents tracking national, not racing it.
- At projected returns (-3.0% appreciation + 0.0% rent growth), your $252k cash investment doubles in ~5 years — after that, you're playing with house money.
Negotiation context
- It's been on market 17 days — a 2% lower offer ($886k) is reasonable based on typical stale-listing flexibility.
- 2 sale attempts with the ask held roughly flat each time — persistent listings suggest the price (not the market) is what's stuck; bring a comps-based counter.
Risks & watch-outs
- Watch-outs: built in 1900 — expect roof / HVAC / electrical / plumbing capex.
- Climate carrying-cost: major wind risk, 27% chance of damaging wind over 30y; extreme-heat days projected 7→16/yr by 2055 (HVAC capex compounding) — expect insurance premiums to compound above CPI over the hold.
Questions for the listing agent
- Can we see the unit-by-unit rent roll, current vacancy, and any below-market leases? What's the average tenancy length?
- What capital expenditures (roof, boiler, parking lot, exteriors) have been made in the last 5 years, and what's planned in the next 2?
- Built in 1900 — when were the roof, HVAC, electrical panel, plumbing, and water heater last replaced?
- Is there a deadline driving the sale (1031 exchange, divorce, estate, relocation)? That informs how much negotiation room exists.
- Schools are D-rated, which usually means shorter tenancies and higher turnover. Who's the typical renter profile here, and what's been the actual vacancy rate?
- What's the average days-on-market for RENTAL listings here right now (not sales)? A rising rental-DOM trend means longer vacancies and softer asking-rent achievability than the comps imply.
- What's the recent tenant-quality profile in this submarket — average credit score on applications, eviction rate, late-payment / NSF rate, and stable-employment percentage? A property-management company in the area should have these aggregated.
- How much new apartment / multifamily construction is in the pipeline within 1–3 miles? Heavy new supply (>2% of stock underway) typically softens rents 12–24 months out; light construction supports rent growth.
Investment metrics
- 1% rule
- 1.91% ✓
- Cap rate
- 15.38%
- Cash-on-cash
- 32.44%
- DSCR
- 2.44
- GRM
- 4.4
CMA / ARV
- ARV (on-the-fly)
- $971,568
- Comps found
- 1
Show comp detail 1 sale within ~0.75 mi
| Address | Dist | Beds/Ba | Sqft | Sold | Price | $/sf | Match |
|---|---|---|---|---|---|---|---|
| 142 Fairview Ave | 0.10mi | 6/3.0 (+1) | 3,637 (-12%) | 20mo | $850,000 | $234 | 51 |
Match score weights: distance 35% · size 25% · config 20% · recency 20%. Top-matched comps best support the ARV.
Projected returns pro-forma
-3.0% appreciation · 0.0% rent growth · sell at horizon
- IRR
- 24.0%
- Equity multiple
- 1.95×
- Total profit
- $238,141
- Equity at exit
- $134,044
- IRR
- 29.8%
- Equity multiple
- 3.28×
- Total profit
- $573,761
- Equity at exit
- $77,729
Cash invested: $251,720 (down + closing). Projections, not guarantees.
Landlord ↔ Tenant lean methodology
- Overall (STATE)
- 15 Strongly Tenant-Friendly
- State New York
- 15 Strongly Tenant-Friendly · D+10
- County
- — inherits STATE
- City
- — inherits STATE
ZIP-level market 10573
- Rents YoY
- -1.7%
- Active inventory
- 144
- Price-to-rent
- 13.1×
Monthly cashflow live
- Estimated rent
- $17,140 medium interval (Pro) →
- Mortgage (P&I)
- −$4,714
- Tax from tax record
- −$1,646 /mo · $19,748/yr
- Insurance
- −$375
- HOA
- −$0
- Vacancy / Maint / Mgmt
- −$3,599
- Net cashflow
- $6,806
Break-even live
Sensitivity live
| Price | -10% $7,315 | -5% $7,060 | +0% $6,806 | +5% $6,551 | +10% $6,297 |
|---|---|---|---|---|---|
| Rent | -10% $5,452 | -5% $6,129 | +0% $6,806 | +5% $7,483 | +10% $8,160 |
| Rate | -1.0pp $7,259 | -0.5pp $7,035 | base $6,806 | +0.5pp $6,573 | +1.0pp $6,336 |
3-unit breakdown (identical units grouped — click to expand)
| Units | Beds | Baths | Est. rent |
|---|---|---|---|
| 3× units | 5 | 3 | $17,139 |
| #1 | 5 | 3 | $5,713 |
| #2 | 5 | 3 | $5,713 |
| #3 | 5 | 3 | $5,713 |
| Total (3 units) | $17,140 | ||
UW: 25.0% down · 7.5% · 30yr · 1.5% tax · 5.0% vac · 8.0% maint · 8.0% mgmt
Financing live
Cash to close
- Down payment
- $224,750
- Closing costs
- $26,970
- Reserves months
- —
- Total cash needed
- —
Loan-product check · same deal, 3 products live
Conventional
25% down · 7.5% · 30yr
- Down + closing
- —
- Monthly P&I
- —
- Monthly cashflow
- —
- DSCR
- —
- Eligible?
- —
Personal DTI + credit; lowest rate.
DSCR
20% down · 8.5% · 30yr
- Down + closing
- —
- Monthly P&I
- —
- Monthly cashflow
- —
- DSCR
- —
- Eligible?
- —
No personal income docs; deal must DSCR.
Hard money
10% down · 12.0% · 12mo
- Down + closing
- —
- Monthly P&I
- —
- Monthly cashflow
- —
- DSCR
- —
- Eligible?
- —
Short-term bridge; refi at stabilization.
Rent comps 4 comps
| Address | Beds | Baths | Sqft | Rent | $/sqft | DOM | Units | Dist |
|---|---|---|---|---|---|---|---|---|
| 195 S Water St Greenwich, CT | 5.0 | 4.5 | 3000 | $9,500 | $3.17 | 0d | 1 | 1.35mi |
| 185 S Water St Greenwich, CT | 5.0 | 5.5 | 4000 | $13,000 | $3.25 | 12d | 1 | 1.36mi |
| 185 S Water St Unit S Greenwich, CT | 6.0 | 5.5 | 4000 | $13,000 | $3.25 | 11d | 1 | 1.36mi |
| 185 S Water St Unit S Greenwich, CT | 6.0 | 5.5 | 4000 | $13,000 | $3.25 | 14d | 1 | 1.36mi |
Listing history 11 events
-
2026-06-21days on market $899,000 Active 17 DOM
-
2026-06-18days on market $899,000 Active 14 DOM
-
2026-06-17days on market $899,000 Active 13 DOM
-
2026-06-16days on market $899,000 Active 12 DOM
-
2026-06-15days on market $899,000 Active 11 DOM
-
2026-06-13days on market $899,000 Active 9 DOM
-
2026-06-13days on market $899,000 Active 8 DOM
-
2026-06-09days on market $899,000 Active 5 DOM
-
2026-06-08days on market $899,000 Active 4 DOM
-
2026-06-07remarks 699-char remark
-
2026-06-07$899,000 Active 3 DOM
ⓘ Source: listings_history table (triggers on properties + properties_extension) + one-shot
backfill from property_details.listing_events for pre-trigger history.
Tax reassessment forecast NY · Partial reset (capped growth)
- Current annual tax
- $19,748 · $1,646/mo
- Projected year-2 tax
- $19,748 · $1,646/mo
- Expected delta
- $0/yr ($0/mo · 0.0%)
ⓘ Screening estimate from a state-policy table — verify with the county assessor before closing.
Climate risk First Street
- Flood 1/10 Low FEMA zone X (unshaded) · 0% chance over 30 yrs
- Wildfire 1/10 Low
- Heat 6/10 Major 7 d/yr ≥98°F today · 16 d/yr by 30 yrs out
- Wind 6/10 Major 27% chance of damaging wind over 30 yrs
- Air quality 4/10 Moderate 5 unhealthy d/yr today · 7 by 30 yrs out
Nearby sold comps map
Loading sold comps map…
Walkable amenities ~0.75 mi
Loading nearby amenities…
Taxation est. · year 1
- Rental income
- $205,680
- − Mortgage interest
- −$50,358
- − Property taxes
- −$19,748
- − Insurance
- −$4,495
- − Repairs & maintenance
- −$16,454
- − Management
- −$16,454
- − Depreciation
- −$26,153
- Taxable income
- $72,017
- Est. tax owed @ 24.0%
- −$17,284
- After-tax cash flow
- $64,386/yr
For passive investors: Depreciation is non-cash, so a rental often shows a tax loss while cash-flowing — sheltering income. Rental losses are passive: they offset passive income freely, and up to $25,000/yr can offset ordinary (W-2) income if you actively participate and your MAGI is under $100k (phasing out to $0 by $150k); unused losses carry forward. On sale, claimed depreciation is recaptured at up to 25%, and gains may owe capital-gains tax (a 1031 exchange can defer both). Figures are a year-1 estimate at your 24.0% rate — not tax advice; consult a CPA.
Schools (NCES district)
- District
- Port Chester-Rye Union Free School District
- NCES district ID
- 3623460
- Math proficiency
- 44% ▲ 2.00%
- Reading proficiency
- 49% ▲ 6.00%
- Median HH income
- $58,362
- Composite
- 40.67/100
- National rank
- #3676
- State rank
- #428 of 590 in NY
Livability — Port Chester
- Score
- 73/100
- State rank
- #315
- US rank
- #5245
Category grades
Schools grade is shown separately in the Schools card above.
Census & demographics
- Census place
- Port Chester, NY
- County
- Westchester County · 709,332 people
- City population
- 40,786
- Metro
- New York-Newark-Jersey City, NY-NJ-PA
- Population (ZIP)
- 40,786
- Household income
- $105,686
- Rent vs Own
- Severe rent burden
- 1362.0
Population outlook (Westchester County) Hauer SSP2
- Today (2025)
- 1,028,035 people
- By 2030
- 1,051,636 · +2.3%
- By 2040
- 1,098,520 · +6.9%
- By 2050
- 1,136,044 · +10.5%
- By 2075
- 1,196,925 · +16.4%
- By 2100
- 1,175,147 · +14.3%
Race, ethnicity, and origin ACS 2023
- Neighborhood character
- Diverse neighborhood (Simpson 0.61)
- Race & ethnicity
- Hispanic / Latino 48% White 40% Two or more races 16% Black 5% Asian 4%
- Hispanic origin (detail)
- Mexican 7% Puerto Rican 6% Dominican 3%
- Common ancestry
- Romanian 3% Scotch-Irish 2% Italian 1%
- Foreign-born
- 37% · Canada, Jamaica, China
- Languages at home
- 50% English-only · Spanish 41% Other Indo-European 5% Chinese 1%
Political lean MEDSL · Westchester
- 2024 margin
- Strong D (+26.3) · D 63.1% · R 36.9%
- 2008→2024 swing
- -1.3pp toward R · 2008: 27.6pp · 2024: 26.3pp
- All cycles
- 2024: D+26.3 2020: D+36.3 2016: D+32.8 2012: D+22.2 2008: D+27.6
Not yet ingested
- Civics
- —
Market trends
- HPI YoY
- ▼ -389.46%
- Current HPI
- 258.9227
- Rent YoY
- ▼ -1.70%
- Metro
- New York-Newark-Jersey City, NY-NJ-PA
- State GDP YoY
- ▲ 2.60%
- F500 in state
- 92
Industry mix (Fortune 500 HQ in NY)
| Industry | F500 HQs | Revenue |
|---|---|---|
| Financial Services | 10 | $950B |
|
||
| Consumer Goods | 9 | $162B |
|
||
| Insurance | 4 | $225B |
|
||
| Telecommunications | 2 | $144B |
|
||
| Pharmaceuticals | 2 | $112B |
|
||
| Media / Entertainment | 2 | $69B |
|
||
Price history
+32007.1% since first listed3 events — show timeline
- 2026-05-28 Listed $899,000 OneKey® MLS as Distributed by MLS Grid
- 2025-05-27 Rental Removed $2,800 ONEKEY
- 2025-05-23 Listed for Rent $2,800 ONEKEY
Property tax history
+2.7%/yrLatest (2025): $19,748 · +8.3% YoY. Source: county tax records.
Cash-flow waterfall
monthlySold comps — $/sqft
last 12 mo · ≤1 miLoading sold comps…