229 NW 93rd Ln · Spring Ridge, FL
Flood risk 1/10 · Minimal
- FEMA flood zone
- X (unshaded)
- Chance of flooding over 30 yrs
- 0.0%
- Est. flood insurance / yr
- $507 – $1,088
Fire risk 7/10 · Major
- Est. fire insurance / yr
- $947 – $1,759
Heat risk 8/10 · Major
- Hot days now (above 108°F)
- 7 days/yr
- Hot days in 30 yrs
- 22 days/yr
Wind risk 9/10 · Severe
- Chance of severe wind over 30 yrs
- 99.0%
Air-quality risk 3/10 · Minor
- Unhealthy air days now
- 3 days/yr
- Unhealthy air days in 30 yrs
- 3 days/yr
Risk factors via First Street. Map © Google.
Why this score? — see what drove the D grade
The composite is a weighted blend of 9 inputs, each scored 0–100. Each bar is that input's sub-score; the figure is the points it added to the 100-point composite (weight × sub-score).
- ARV discount +10.4/15.0
- Appreciation +10.0/10.0
- Cash flow +7.5/30.0
- Schools +5.3/10.0
- Livability +3.4/5.0
- Rent growth +2.5/5.0
- Condition / age +2.5/5.0
- DSCR +1.6/10.0
- 1% rule +1.0/10.0
$220,000
🖨 Deal sheet 📄 Offer letter ✓ Due diligence
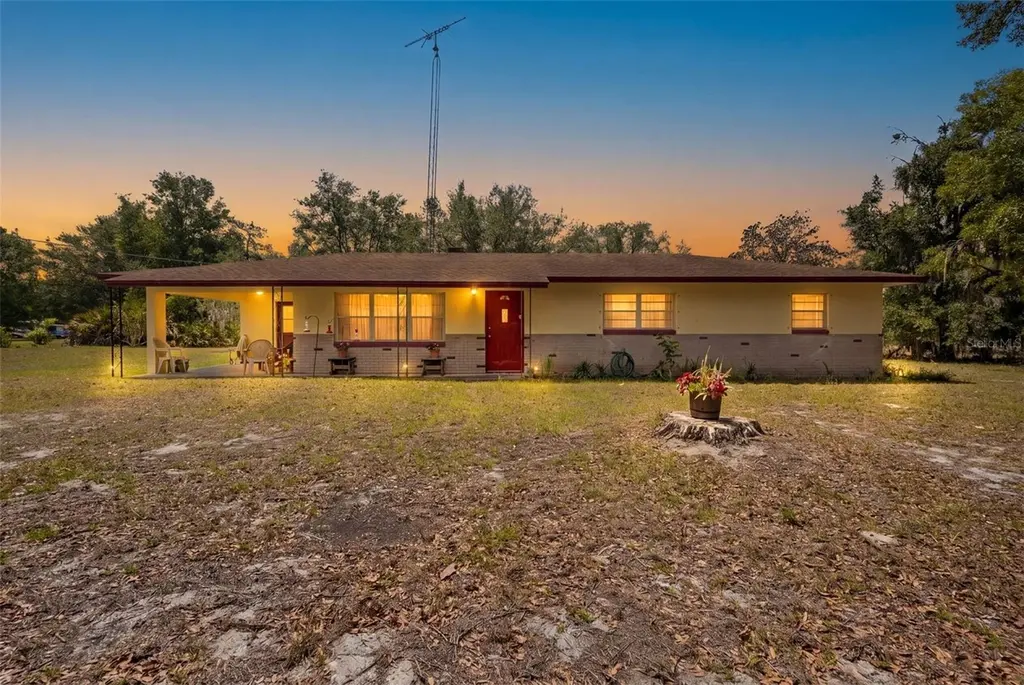
Listing remarks
Under contract-accepting backup offers. Welcome to your private slice of North Florida on 6.30 acres in Branford. This 3 bedroom, 2 bathroom concrete block home offers approximately 1,300 square feet with a functional layout and great potential. Surrounded by mature trees and open space, the property provides privacy and room to spread out. A large covered structure on site is perfect for use as a barn, workshop, equipment storage, or hobby space. The home is ready for your personal touches and cosmetic updates. Whether you are looking for a homestead, a peaceful retreat, or space to create your own vision, this property offers a rare opportunity. Great value for a concrete block home on ac
Key facts
- 6.3 acre lot
- Built 1975
- Listed 3 days
Property features AI
Finance
- Other: Property zoned RES
- HOA & community: No HOA/association
Exterior
- Parking: Road access via dirt road
- Utilities: Private well water; Septic tank; Electricity connected
- Home design: Single family residence; Residential property; One story; North facing; Homestead
- Construction: Concrete construction; Shingle roof; Slab foundation; Built on a property of 6.3 acres (oversized, level, private, in county)
- Exterior features: Lighting; Private mailbox; Storage; Barn(s); Shed(s)
Interior
- Kitchen: Range; Refrigerator
- Bedrooms: 3 bedrooms
- Flooring: Carpet; Tile
- Bathrooms: 2 full bathrooms
- Heating & cooling: Electric heating; Central air conditioning
- Interior features: Living room/dining room combo; Window treatments; Inside utility
- Laundry & utility: Laundry inside
Neighborhood map
What this means for you Summary
Snapshot
- This is a 3-bed/2.0-bath single-family listed at $220k.
Deal economics
- At list price, monthly cash flow is $-272 ($-3k/yr) — negative.
- To cash-flow at today's rent, offer at most $172k (21.8% below list).
- To meet the 1% rule (rent ≥ 1% of price), the offer needs to be $133k (39.7% below list).
- Recommended offer: $133k (39.7% below list) — sets the bar for 1% rule.
Location & tenants
- Location reads 67/100 on livability (#547 in FL) — a middle-class / working-renter tenant base. Strengths: cost of living A+, housing A+, crime B+; Watch: health & safety D, schools D-, amenities F.
- Gilchrist (rural): math 66% / reading 61% proficiency, ranked #9 of 73 in FL (top 12%) — acceptable for families but not a draw, mixed tenant base, ~2y average lease.
- Market conditions: 105 active listings in the ZIP; 94 units permitted in Gilchrist County in 2024 (0 in 5+ unit buildings).
Forward outlook
- In year one you build about $24k of equity ($2k loan paydown + $22k appreciation (10.0% local appreciation)).
- Gilchrist County population projected to shrink 6% by 2050 — rents likely to lag national; underwrite the cash flow, not the appreciation.
- By year 2, paydown + projected appreciation supports a ~$38k cash-out refi (75% LTV) — recoverable capital for the next deal without selling this one.
Negotiation context
- Only 3 days on market — expect competitive offers; lowballing is unlikely to land.
Risks & watch-outs
- Climate carrying-cost: severe wind risk, 99% chance of damaging wind over 30y; major wildfire risk; extreme-heat days projected 7→22/yr by 2055 (HVAC capex compounding) — expect insurance premiums to compound above CPI over the hold.
Questions for the listing agent
- What do current leases actually rent for vs. the listed asking? Can we see a recent rent roll and the last 12 months of T-12 income?
- Built in 1975 — when were the roof, HVAC, electrical panel, plumbing, and water heater last replaced?
- Is there a deadline driving the sale (1031 exchange, divorce, estate, relocation)? That informs how much negotiation room exists.
- Schools are D-rated, which usually means shorter tenancies and higher turnover. Who's the typical renter profile here, and what's been the actual vacancy rate?
- The area grade is low — what's the realistic commute time and amenity access for the typical tenant pool here? Any planned neighborhood developments (good or bad) we should know about?
- What's the average days-on-market for RENTAL listings here right now (not sales)? A rising rental-DOM trend means longer vacancies and softer asking-rent achievability than the comps imply.
- What's the recent tenant-quality profile in this submarket — average credit score on applications, eviction rate, late-payment / NSF rate, and stable-employment percentage? A property-management company in the area should have these aggregated.
- How much new for-sale + rental construction is in the pipeline within 1–3 miles? Heavy new supply typically softens prices + rents 12–24 months out; constrained supply supports both.
Investment metrics
- 1% rule
- 0.60% ✗
- Cap rate
- 4.81%
- Cash-on-cash
- -5.30%
- DSCR
- 0.76
- GRM
- 13.8
CMA / ARV
- ARV (on-the-fly)
- $235,300
- Comps found
- 2
Show comp detail 2 sales within ~0.75 mi
| Address | Dist | Beds/Ba | Sqft | Sold | Price | $/sf | Match |
|---|---|---|---|---|---|---|---|
| 229 NW 93rd Ln | 0.00mi | 3/2.0 | 1,300 (0%) | 1mo | $220,000 | $169 | 99 |
| 609 NW 96th Pl | 0.42mi | 3/2.0 | 1,358 (+4%) | 2mo | $246,000 | $181 | 71 |
Match score weights: distance 35% · size 25% · config 20% · recency 20%. Top-matched comps best support the ARV.
Projected returns pro-forma
10.0% appreciation · 3.0% rent growth · sell at horizon
- IRR
- 20.5%
- Equity multiple
- 2.66×
- Total profit
- $102,394
- Equity at exit
- $198,193
- IRR
- 18.7%
- Equity multiple
- 6.11×
- Total profit
- $314,950
- Equity at exit
- $427,412
Cash invested: $61,600 (down + closing). Projections, not guarantees.
Landlord ↔ Tenant lean methodology
- Overall (STATE)
- 87 Strongly Landlord-Friendly
- State Florida
- 87 Strongly Landlord-Friendly · R+3
- County
- — inherits STATE
- City
- — inherits STATE
ZIP-level market 32008
- Home prices YoY
- 23.4%
- Active inventory
- 105
- Price-to-rent
- 13.8×
Monthly cashflow live
- Estimated rent
- $1,327 medium interval (Pro) →
- Mortgage (P&I)
- −$1,154
- Tax from tax record
- −$75 /mo · $899/yr
- Insurance
- −$92
- HOA
- −$0
- Vacancy / Maint / Mgmt
- −$279
- Net cashflow
- $-272
Break-even live
UW: 25.0% down · 7.5% · 30yr · 1.5% tax · 5.0% vac · 8.0% maint · 8.0% mgmt
Financing live
Cash to close
- Down payment
- $55,000
- Closing costs
- $6,600
- Reserves months
- —
- Total cash needed
- —
Loan-product check · same deal, 3 products live
Conventional
25% down · 7.5% · 30yr
- Down + closing
- —
- Monthly P&I
- —
- Monthly cashflow
- —
- DSCR
- —
- Eligible?
- —
Personal DTI + credit; lowest rate.
DSCR
20% down · 8.5% · 30yr
- Down + closing
- —
- Monthly P&I
- —
- Monthly cashflow
- —
- DSCR
- —
- Eligible?
- —
No personal income docs; deal must DSCR.
Hard money
10% down · 12.0% · 12mo
- Down + closing
- —
- Monthly P&I
- —
- Monthly cashflow
- —
- DSCR
- —
- Eligible?
- —
Short-term bridge; refi at stabilization.
Listing history 2 events
-
2026-05-09status Pending
-
2026-05-06$220,000 Active
ⓘ Source: listings_history table (triggers on properties + properties_extension) + one-shot
backfill from property_details.listing_events for pre-trigger history.
Tax reassessment forecast FL · Resets to sale price
- Current annual tax
- $899 · $75/mo
- Projected year-2 tax
- $1,826 · $152/mo
- Expected delta
- +$927/yr (+$77/mo · 103.0%)
ⓘ Screening estimate from a state-policy table — verify with the county assessor before closing.
Climate risk First Street
- Flood 1/10 Low FEMA zone X (unshaded) · 0% chance over 30 yrs
- Wildfire 7/10 Severe
- Heat 8/10 Severe 7 d/yr ≥108°F today · 22 d/yr by 30 yrs out
- Wind 9/10 Extreme 99% chance of damaging wind over 30 yrs
- Air quality 3/10 Moderate 3 unhealthy d/yr today · 3 by 30 yrs out
Nearby sold comps map
Loading sold comps map…
Walkable amenities ~0.75 mi
Loading nearby amenities…
Taxation est. · year 1
- Rental income
- $15,924
- − Mortgage interest
- −$12,323
- − Property taxes
- −$899
- − Insurance
- −$1,100
- − Repairs & maintenance
- −$1,274
- − Management
- −$1,274
- − Depreciation
- −$6,400
- Taxable loss
- −$7,346
- Est. tax savings @ 24.0%
- +$1,763
- After-tax cash flow
- $-1,500/yr
For passive investors: Depreciation is non-cash, so a rental often shows a tax loss while cash-flowing — sheltering income. Rental losses are passive: they offset passive income freely, and up to $25,000/yr can offset ordinary (W-2) income if you actively participate and your MAGI is under $100k (phasing out to $0 by $150k); unused losses carry forward. On sale, claimed depreciation is recaptured at up to 25%, and gains may owe capital-gains tax (a 1031 exchange can defer both). Figures are a year-1 estimate at your 24.0% rate — not tax advice; consult a CPA.
Schools (NCES district)
- District
- Gilchrist
- NCES district ID
- 1200630
- Math proficiency
- 66% ▼ -4.00%
- Reading proficiency
- 61% ▼ -5.00%
- Median HH income
- $39,610
- Composite
- 53.01/100
- National rank
- #1522
- State rank
- #9 of 73 in FL
Livability — Spring Ridge
- Score
- 67/100
- State rank
- #547
- US rank
- #10343
Category grades
Schools grade is shown separately in the Schools card above.
Census & demographics
- Population (ZIP)
- 6,263
Population outlook (Gilchrist County) Hauer SSP2
- Today (2025)
- 17,730 people
- By 2030
- 17,722 · +-0.0%
- By 2040
- 17,393 · -1.9%
- By 2050
- 16,597 · -6.4%
- By 2075
- 14,300 · -19.3%
- By 2100
- 11,498 · -35.1%
Race, ethnicity, and origin ACS 2023
- Neighborhood character
- Predominantly White (81%)
- Race & ethnicity
- White 81% Hispanic / Latino 11% Black 6% Two or more races 2%
- Hispanic origin (detail)
- Mexican 10%
- Common ancestry
- Danish 2% Iranian 2% Italian 2%
- Foreign-born
- 6% · Canada
- Languages at home
- 89% English-only · Spanish 10%
Political lean MEDSL · Gilchrist
- 2024 margin
- Solid R (+68.0) · D 15.6% · R 83.6%
- 2008→2024 swing
- -21.2pp toward R · 2008: -46.8pp · 2024: -68.0pp
- All cycles
- 2024: R+68.0 2020: R+64.0 2016: R+62.8 2012: R+51.0 2008: R+46.8
Not yet ingested
- Civics
- —
Market trends
- HPI YoY
- ▲ 75.94%
- Current HPI
- 399.7214
- Rent YoY
- —
- Metro
- —
- State GDP YoY
- ▲ 3.28%
- F500 in state
- 36
Industry mix (Fortune 500 HQ in FL)
| Industry | F500 HQs | Revenue |
|---|---|---|
| Industrial Technology | 2 | $29B |
|
||
| Insurance | 2 | $17B |
|
||
| Retail | 1 | $60B |
|
||
| Technology Distribution | 1 | $58B |
|
||
| Homebuilding | 1 | $35B |
|
||
| Technology Manufacturing | 1 | $35B |
|
||
Price history
2 events — show timeline
- 2026-05-09 Pending — Stellar MLS as Distributed by MLS Grid
- 2026-05-06 Listed $220,000 Stellar MLS as Distributed by MLS Grid
Property tax history
+2.0%/yrLatest (2025): $899 · +2.4% YoY. Source: county tax records.
Cash-flow waterfall
monthlySold comps — $/sqft
last 12 mo · ≤1 miLoading sold comps…