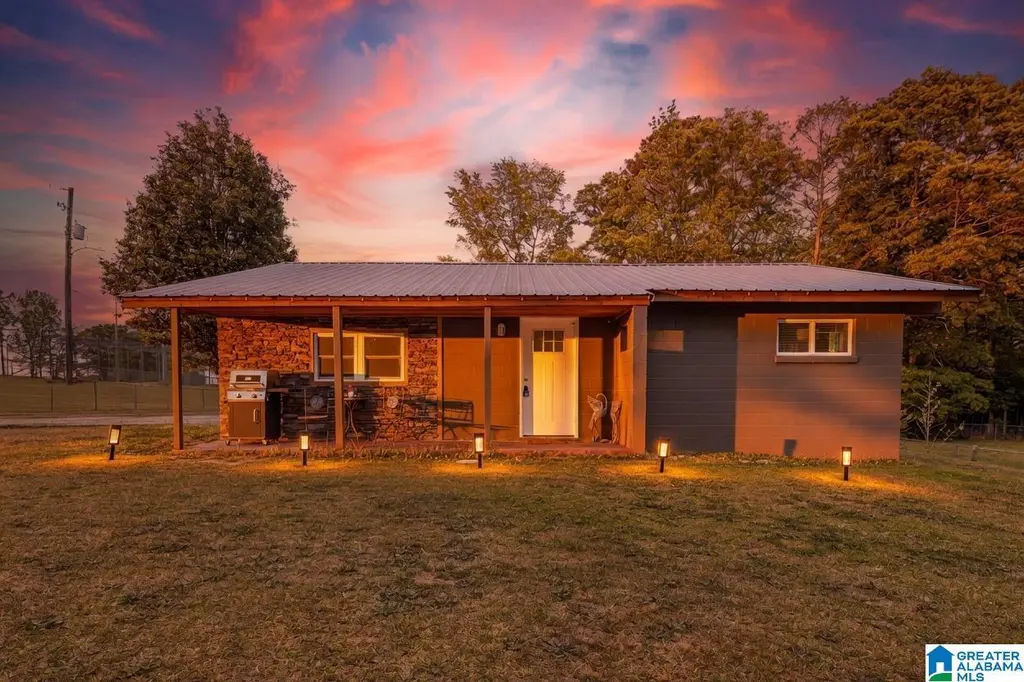
23 Williamson Rd · Ashland, AL
Flood risk 1/10 · Minimal
- FEMA flood zone
- X (unshaded)
- Chance of flooding over 30 yrs
- 0.0%
- Est. flood insurance / yr
- $507 – $1,088
Fire risk 5/10 · Moderate
- Est. fire insurance / yr
- $916 – $1,700
Heat risk 5/10 · Moderate
- Hot days now (above 103°F)
- 7 days/yr
- Hot days in 30 yrs
- 20 days/yr
Wind risk 6/10 · Moderate
- Chance of severe wind over 30 yrs
- 27.0%
Air-quality risk 3/10 · Minor
- Unhealthy air days now
- 3 days/yr
- Unhealthy air days in 30 yrs
- 3 days/yr
Risk factors via First Street. Map © Google.
Why this score? — see what drove the D grade
The composite is a weighted blend of 9 inputs, each scored 0–100. Each bar is that input's sub-score; the figure is the points it added to the 100-point composite (weight × sub-score).
- ARV discount +14.0/15.0
- Appreciation +8.9/10.0
- Cash flow +7.0/30.0
- Livability +2.7/5.0
- Rent growth +2.5/5.0
- Condition / age +2.5/5.0
- Schools +2.2/10.0
- 1% rule +1.9/10.0
- DSCR +1.2/10.0
$129,900
🖨 Deal sheet 📄 Offer letter ✓ Due diligence
Listing remarks
Welcome to this beautifully updated 2 bedroom, 1 bath home perfectly situated on a flat corner lot! Conveniently located next to Williamson Field and Ashland City Park, this property offers both comfort and location. Step inside to a fresh, neutral color scheme that complements any style. The updated kitchen features brand new cabinets, gorgeous countertops, and stainless steel appliances; ready for everyday living or entertaining. This home is a great opportunity whether you’re looking for a primary residence or an investment. Don’t miss your chance to own this move-in ready home in a great location!
Key facts
- Gorgeous countertops
- Updated kitchen
- Flat corner lot
Tags
Property features AI
Exterior
- Parking: Driveway parking; Parking on main level
- Security: No security features listed
- Utilities: Public water; Septic system; Electric water heater; Internet service availability unknown
- Home design: Existing single-family property; Crawl space foundation; Concrete/block construction
- Construction: Concrete/block construction; Crawl space foundation; Existing (previously built) structure
- Exterior features: Covered patio; No pool; No waterfront or notable view; 0.29 acre lot
Interior
- Kitchen: Laminate countertops; Built-in dishwasher; Electric oven
- Bedrooms: Three bedrooms on the main level
- Flooring: Vinyl flooring
- Bathrooms: One full bathroom with tub/shower combination
- Heating & cooling: Electric heating; Electric cooling
- Interior features: Smooth ceilings; No additional built-in interior features listed
- Laundry & utility: Main-level laundry room; Utility sink; Electric dryer hookup; Pull-down attic access
Neighborhood map
What this means for you Summary
Snapshot
- This is a 2-bed/1.0-bath single-family listed at $130k.
Deal economics
- At list price, monthly cash flow is $-193 ($-2k/yr) — negative.
- To cash-flow at today's rent, offer at most $102k (21.5% below list).
- To meet the 1% rule (rent ≥ 1% of price), the offer needs to be $89k (31.3% below list).
- Recommended offer: $89k (31.3% below list) — sets the bar for 1% rule.
Location & tenants
- Location reads 54/100 on livability (#471 in AL) — a working-class tenant base; expect higher turnover. Strengths: cost of living A+, housing B; Watch: crime F, amenities F, commute F.
- Clay County (rural): math 15% / reading 37% proficiency, ranked #88 of 129 in AL (top 68%) — low school quality limits family demand, transient renter base, plan for 1-2y turnover.
- Zoned schools: Ashland Elementary School (math 17% / reading 38%, grade F, #387 of 627 statewide, top 62%, 486 students, 77% FRL); Central High School of Clay County (math 12% / reading 12%, grade F, #242 of 305 statewide, top 80%, 524 students, 71% FRL) — zoned schools average 74% FRL vs 55% district-wide (19 pts higher); higher-poverty schools than district average — tighter screening recommended.
- Market conditions: 37 active listings in the ZIP; 9 units permitted in Clay County in 2024 (0 in 5+ unit buildings).
Forward outlook
- In year one you build about $11k of equity ($898 loan paydown + $10k appreciation (7.8% local appreciation)).
- Clay County population projected at -22% by 2050 — secular population decline; favor cash flow + early exit over multi-decade hold.
- By year 4, paydown + projected appreciation supports a ~$38k cash-out refi (75% LTV) — recoverable capital for the next deal without selling this one.
Negotiation context
- It's been on market 54 days — a 3% lower offer ($126k) is reasonable based on typical stale-listing flexibility.
Risks & watch-outs
- Watch-outs: built in 1900 — expect roof / HVAC / electrical / plumbing capex.
- Climate carrying-cost: major wind risk, 27% chance of damaging wind over 30y; moderate wildfire risk; extreme-heat days projected 7→20/yr by 2055 (HVAC capex compounding) — expect insurance premiums to compound above CPI over the hold.
Questions for the listing agent
- What do current leases actually rent for vs. the listed asking? Can we see a recent rent roll and the last 12 months of T-12 income?
- It's been on market 54 days. Have you received any prior offers? Is the seller open to a 31% concession, seller financing, or rate buy-down credit?
- Built in 1900 — when were the roof, HVAC, electrical panel, plumbing, and water heater last replaced?
- Is there a deadline driving the sale (1031 exchange, divorce, estate, relocation)? That informs how much negotiation room exists.
- Schools are D-rated, which usually means shorter tenancies and higher turnover. Who's the typical renter profile here, and what's been the actual vacancy rate?
- Crime grade is F in this area — have there been break-ins, vandalism, or insurance claims at this property in the last 3 years? What carrier currently insures it and at what premium?
- The area grade is low — what's the realistic commute time and amenity access for the typical tenant pool here? Any planned neighborhood developments (good or bad) we should know about?
- What's the average days-on-market for RENTAL listings here right now (not sales)? A rising rental-DOM trend means longer vacancies and softer asking-rent achievability than the comps imply.
- What's the recent tenant-quality profile in this submarket — average credit score on applications, eviction rate, late-payment / NSF rate, and stable-employment percentage? A property-management company in the area should have these aggregated.
- How much new for-sale + rental construction is in the pipeline within 1–3 miles? Heavy new supply typically softens prices + rents 12–24 months out; constrained supply supports both.
Investment metrics
- 1% rule
- 0.69% ✗
- Cap rate
- 4.51%
- Cash-on-cash
- -6.37%
- DSCR
- 0.72
- GRM
- 12.1
CMA / ARV
- ARV (median comp)
- $151,879
- List price
- $129,900
- Delta
- -14.47%
- Verdict
- UNDERPRICED
- Comps
- 2 within 1.0 mi
Show comp detail 1 sale within ~0.75 mi
| Address | Dist | Beds/Ba | Sqft | Sold | Price | $/sf | Match |
|---|---|---|---|---|---|---|---|
| 490 County Road 31 | 0.47mi | 2/1.0 | 988 (0%) | 20mo | $115,000 | $116 | 62 |
Match score weights: distance 35% · size 25% · config 20% · recency 20%. Top-matched comps best support the ARV.
Projected returns pro-forma
7.84% appreciation · 3.0% rent growth · sell at horizon
- IRR
- 14.8%
- Equity multiple
- 2.10×
- Total profit
- $39,935
- Equity at exit
- $97,309
- IRR
- 14.7%
- Equity multiple
- 4.44×
- Total profit
- $124,991
- Equity at exit
- $191,857
Cash invested: $36,372 (down + closing). Projections, not guarantees.
Landlord ↔ Tenant lean methodology
- Overall (STATE)
- 90 Strongly Landlord-Friendly
- State Alabama
- 90 Strongly Landlord-Friendly · R+15
- County
- — inherits STATE
- City
- — inherits STATE
ZIP-level market 36251
- Home prices YoY
- 4.2%
- Active inventory
- 37
- Price-to-rent
- 12.1×
Monthly cashflow live
- Estimated rent
- $892 medium interval (Pro) →
- Mortgage (P&I)
- −$681
- Tax est. 1.5%
- −$162 /mo · $1,948/yr
- Insurance
- −$54
- HOA
- −$0
- Vacancy / Maint / Mgmt
- −$187
- Net cashflow
- $-193
Break-even live
UW: 25.0% down · 7.5% · 30yr · 1.5% tax · 5.0% vac · 8.0% maint · 8.0% mgmt
Financing live
Cash to close
- Down payment
- $32,475
- Closing costs
- $3,897
- Reserves months
- —
- Total cash needed
- —
Loan-product check · same deal, 3 products live
Conventional
25% down · 7.5% · 30yr
- Down + closing
- —
- Monthly P&I
- —
- Monthly cashflow
- —
- DSCR
- —
- Eligible?
- —
Personal DTI + credit; lowest rate.
DSCR
20% down · 8.5% · 30yr
- Down + closing
- —
- Monthly P&I
- —
- Monthly cashflow
- —
- DSCR
- —
- Eligible?
- —
No personal income docs; deal must DSCR.
Hard money
10% down · 12.0% · 12mo
- Down + closing
- —
- Monthly P&I
- —
- Monthly cashflow
- —
- DSCR
- —
- Eligible?
- —
Short-term bridge; refi at stabilization.
Listing history 16 events
-
2026-06-19days on market $129,900 Active 54 DOM
-
2026-06-18days on market $129,900 Active 53 DOM
-
2026-06-17days on market $129,900 Active 52 DOM
-
2026-06-16days on market $129,900 Active 51 DOM
-
2026-06-15days on market $129,900 Active 50 DOM
-
2026-06-14days on market $129,900 Active 48 DOM
-
2026-06-12days on market $129,900 Active 47 DOM
-
2026-06-09days on market $129,900 Active 44 DOM
-
2026-06-08days on market $129,900 Active 43 DOM
-
2026-06-07days on market $129,900 Active 42 DOM
-
2026-06-04days on market $129,900 Active 38 DOM
-
2026-06-02days on market $129,900 Active 37 DOM
-
2026-06-01days on market $129,900 Active 36 DOM
-
2026-05-31days on market $129,900 Active 35 DOM
-
2026-05-31days on market $129,900 Active 34 DOM
-
2026-04-26$129,900 Active 620-char remark
ⓘ Source: listings_history table (triggers on properties + properties_extension) + one-shot
backfill from property_details.listing_events for pre-trigger history.
Climate risk First Street
- Flood 1/10 Low FEMA zone X (unshaded) · 0% chance over 30 yrs
- Wildfire 5/10 Major
- Heat 5/10 Major 7 d/yr ≥103°F today · 20 d/yr by 30 yrs out
- Wind 6/10 Major 27% chance of damaging wind over 30 yrs
- Air quality 3/10 Moderate 3 unhealthy d/yr today · 3 by 30 yrs out
Nearby sold comps map
Loading sold comps map…
Walkable amenities ~0.75 mi
Loading nearby amenities…
Taxation est. · year 1
- Rental income
- $10,704
- − Mortgage interest
- −$7,276
- − Property taxes
- −$1,948
- − Insurance
- −$650
- − Repairs & maintenance
- −$856
- − Management
- −$856
- − Depreciation
- −$3,779
- Taxable loss
- −$4,662
- Est. tax savings @ 24.0%
- +$1,119
- After-tax cash flow
- $-1,197/yr
For passive investors: Depreciation is non-cash, so a rental often shows a tax loss while cash-flowing — sheltering income. Rental losses are passive: they offset passive income freely, and up to $25,000/yr can offset ordinary (W-2) income if you actively participate and your MAGI is under $100k (phasing out to $0 by $150k); unused losses carry forward. On sale, claimed depreciation is recaptured at up to 25%, and gains may owe capital-gains tax (a 1031 exchange can defer both). Figures are a year-1 estimate at your 24.0% rate — not tax advice; consult a CPA.
Schools (NCES district)
- District
- Clay County
- NCES district ID
- 0100750
- Math proficiency
- 15% ▼ -28.00%
- Reading proficiency
- 37% ▬ 0.00%
- Median HH income
- $36,719
- Composite
- 21.53/100
- National rank
- #8315
- State rank
- #88 of 129 in AL
Livability — Ashland
- Score
- 54/100
- State rank
- #471
- US rank
- #24069
Category grades
Schools grade is shown separately in the Schools card above.
Census & demographics
- Census place
- Ashland, AL
- Population (ZIP)
- 5,146
Population outlook (Clay County) Hauer SSP2
- Today (2025)
- 12,758 people
- By 2030
- 12,233 · -4.1%
- By 2040
- 11,105 · -13.0%
- By 2050
- 9,935 · -22.1%
- By 2075
- 7,615 · -40.3%
- By 2100
- 5,715 · -55.2%
Race, ethnicity, and origin ACS 2023
- Neighborhood character
- Predominantly White (81%)
- Race & ethnicity
- White 81% Black 8% Two or more races 7% Hispanic / Latino 6%
- Hispanic origin (detail)
- Mexican 5%
- Common ancestry
- Serbian 4% Slovak 3% Italian 2%
- Foreign-born
- 1% · Canada
- Languages at home
- 94% English-only · Spanish 6%
Political lean MEDSL · Clay
- 2024 margin
- Solid R (+70.2) · D 14.7% · R 84.9%
- 2008→2024 swing
- -22.9pp toward R · 2008: -47.3pp · 2024: -70.2pp
- All cycles
- 2024: R+70.2 2020: R+62.5 2016: R+60.8 2012: R+45.7 2008: R+47.3
Not yet ingested
- Civics
- —
Market trends
- HPI YoY
- ▲ 7.84%
- Current HPI
- 193.2598
- Rent YoY
- —
- Metro
- —
- State GDP YoY
- ▲ 2.94%
- F500 in state
- 4
Industry mix (Fortune 500 HQ in AL)
| Industry | F500 HQs | Revenue |
|---|---|---|
| Financial Services | 1 | $8B |
|
||
| Healthcare | 1 | $5B |
|
||
Price history
1 event — show timeline
- 2026-04-26 Listed $129,900 Greater Alabama MLS
Cash-flow waterfall
monthlySold comps — $/sqft
last 12 mo · ≤1 miLoading sold comps…