865 N Glen Oaks Dr · Alpine, CA
Flood risk 9/10 · Severe
- FEMA flood zone
- A
- Chance of flooding over 30 yrs
- 0.99%
- Est. flood insurance / yr
- $1,009 – $1,996
Fire risk 9/10 · Severe
- Est. fire insurance / yr
- $659 – $1,223
Heat risk 5/10 · Moderate
- Hot days now (above 97°F)
- 7 days/yr
- Hot days in 30 yrs
- 19 days/yr
Wind risk 1/10 · Minimal
- Chance of severe wind over 30 yrs
- —
Air-quality risk 4/10 · Minor
- Unhealthy air days now
- 6 days/yr
- Unhealthy air days in 30 yrs
- 7 days/yr
Risk factors via First Street. Map © Google.
Why this score? — see what drove the C+ grade
The composite is a weighted blend of 9 inputs, each scored 0–100. Each bar is that input's sub-score; the figure is the points it added to the 100-point composite (weight × sub-score).
- Cash flow +27.2/30.0
- DSCR +9.5/10.0
- ARV discount +7.5/15.0
- 1% rule +7.4/10.0
- Schools +4.0/10.0
- Livability +2.9/5.0
- Rent growth +2.5/5.0
- Condition / age +2.5/5.0
- Appreciation +0.0/10.0
$190,000
🖨 Deal sheet 📄 Offer letter ✓ Due diligence
Listing remarks MLS
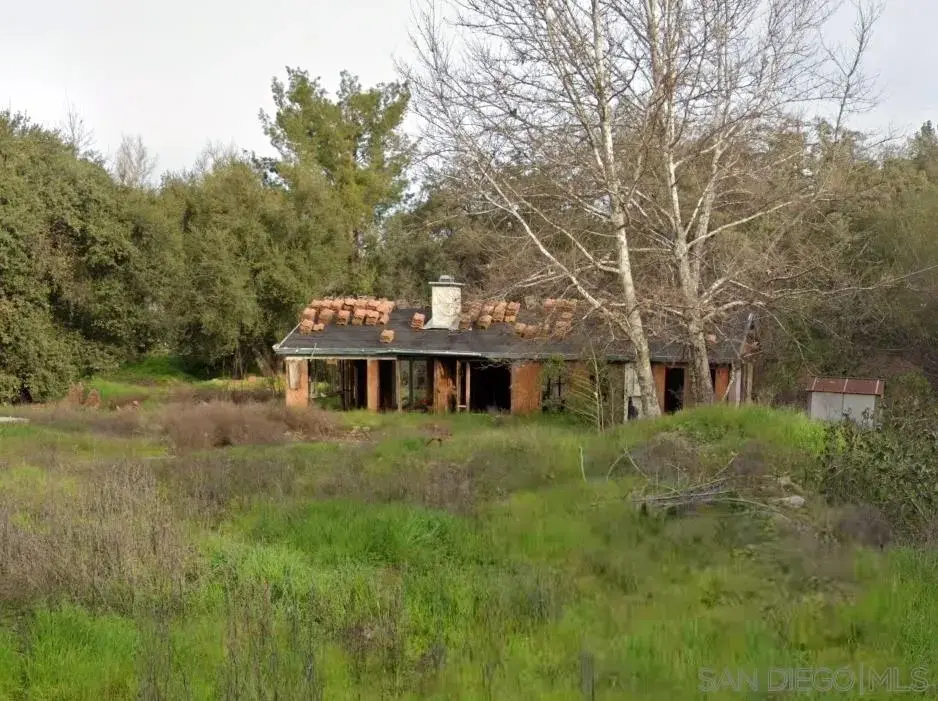
Great Opportunity for investors FIXER FIXER FIXER SOLD AS IS CONDITION, It is in a flood zone area, Need a septic tank, Lowest comps are in 500K
Key facts
- 4 parking spots
- Built 1960
- Listed 36 days
Property features AI
Finance
- HOA & community: Located in the Glen Oaks subdivision
Exterior
- Parking: 4 parking spaces
- Utilities: No utilities information provided; No sewer information provided
- Home design: Detached single-family residence; Residential property; 1 story
- Construction: Built detached (year built not provided)
- Exterior features: No roof information provided
Interior
- Bedrooms: Space for 2 bedrooms
- Bathrooms: 1 full bathroom
- Interior features: One-story layout
Neighborhood map
What this means for you Summary
Snapshot
- This is a 2-bed/1.0-bath land listed at $190k.
Deal economics
- At list price, monthly cash flow is $421 ($5k/yr) — positive.
- The deal already cash-flows at list — no discount required.
- Meets the 1% rule at list price ($2k rent vs $190k).
- Recommended offer: $184k (3.0% below list) — sets the bar for market timing.
- Cap rate 9.7% vs local median 1.4% in Alpine — top-decile yield for the area; either an underpriced asset or a hidden risk that comps aren't pricing in. Stress-test before assuming the spread holds.
Location & tenants
- Location reads 58/100 on livability (#711 in CA) — a working-class tenant base; expect higher turnover. Strengths: employment A+, commute A-, crime B; Watch: amenities F, cost of living F, health & safety F.
- Grossmont Union High (suburban): math 31% / reading 60% proficiency, ranked #173 of 517 in CA (top 34%) — families likely to look elsewhere, expect single-tenant / working-renter base with shorter leases; only 17% free/reduced lunch — higher-income household profile.
- Market conditions: Rents flat; 85 active listings in the ZIP; 3 comparable units currently listed for rent nearby; rentals leasing fast (median 2d on market — plan ~1-2 weeks tenant-placement turnaround); high-income renter base; 11,759 units permitted in San Diego County in 2024 (7,244 in 5+ unit buildings).
Forward outlook
- Local home prices are declining (-3.0%/yr); year-one equity from $1k of loan paydown is wiped out by about $6k of value loss. Plan a longer hold.
- San Diego County population projected at +20% by 2050 — long-run rental-demand tailwind backs the buy-and-hold thesis.
Negotiation context
- It's been on market 36 days — a 3% lower offer ($184k) is reasonable based on typical stale-listing flexibility.
- 5 sale attempts since 13y ago with the ask held roughly flat each time — persistent listings suggest the price (not the market) is what's stuck; bring a comps-based counter.
- Current owner paid $100k; list at $190k implies a 90% gain — meaningful room to come down on a strong offer.
Risks & watch-outs
- Watch-outs: flood insurance adds $125/mo.
- Climate carrying-cost: in FEMA flood zone A (mandatory federal flood insurance); severe wildfire risk; extreme-heat days projected 7→19/yr by 2055 (HVAC capex compounding) — expect insurance premiums to compound above CPI over the hold.
Questions for the listing agent
- It's been on market 36 days. Have you received any prior offers? Is the seller open to a 3% concession, seller financing, or rate buy-down credit?
- Built in 1960 — when were the roof, HVAC, electrical panel, plumbing, and water heater last replaced?
- What's the actual annual flood-insurance premium (NFIP or private), and is the property in a SFHA with mandatory coverage?
- Is there a deadline driving the sale (1031 exchange, divorce, estate, relocation)? That informs how much negotiation room exists.
- What's the average days-on-market for RENTAL listings here right now (not sales)? A rising rental-DOM trend means longer vacancies and softer asking-rent achievability than the comps imply.
- What's the recent tenant-quality profile in this submarket — average credit score on applications, eviction rate, late-payment / NSF rate, and stable-employment percentage? A property-management company in the area should have these aggregated.
- How much new for-sale + rental construction is in the pipeline within 1–3 miles? Heavy new supply typically softens prices + rents 12–24 months out; constrained supply supports both.
Investment metrics
- 1% rule
- 1.24% ✓
- Cap rate
- 9.75%
- Cash-on-cash
- 12.33%
- DSCR
- 1.55
- GRM
- 6.7
CMA / ARV
No comps found within radius.
Projected returns pro-forma
-3.0% appreciation · 0.1% rent growth · sell at horizon
- IRR
- -5.5%
- Equity multiple
- 0.80×
- Total profit
- $-10,511
- Equity at exit
- $28,330
- IRR
- 0.0%
- Equity multiple
- 1.00×
- Total profit
- $17
- Equity at exit
- $16,428
Cash invested: $53,200 (down + closing). Projections, not guarantees.
Landlord ↔ Tenant lean methodology
- Overall (STATE)
- 18 Strongly Tenant-Friendly
- State California
- 18 Strongly Tenant-Friendly · D+13
- County
- — inherits STATE
- City
- — inherits STATE
ZIP-level market 91901
- Rents YoY
- 0.1%
- Active inventory
- 85
- Price-to-rent
- 6.7×
Monthly cashflow live
- Estimated rent
- $2,354 medium interval (Pro) →
- Mortgage (P&I)
- −$996
- Tax est. 1.5%
- −$238 /mo · $2,850/yr
- Insurance
- −$79
- Flood insurance flood zone
- −$125 /mo · $1,502/yr
- HOA
- −$0
- Vacancy / Maint / Mgmt
- −$494
- Net cashflow
- $421
Break-even live
UW: 25.0% down · 7.5% · 30yr · 1.5% tax · 5.0% vac · 8.0% maint · 8.0% mgmt
Financing live
Cash to close
- Down payment
- $47,500
- Closing costs
- $5,700
- Reserves months
- —
- Total cash needed
- —
Loan-product check · same deal, 3 products live
Conventional
25% down · 7.5% · 30yr
- Down + closing
- —
- Monthly P&I
- —
- Monthly cashflow
- —
- DSCR
- —
- Eligible?
- —
Personal DTI + credit; lowest rate.
DSCR
20% down · 8.5% · 30yr
- Down + closing
- —
- Monthly P&I
- —
- Monthly cashflow
- —
- DSCR
- —
- Eligible?
- —
No personal income docs; deal must DSCR.
Hard money
10% down · 12.0% · 12mo
- Down + closing
- —
- Monthly P&I
- —
- Monthly cashflow
- —
- DSCR
- —
- Eligible?
- —
Short-term bridge; refi at stabilization.
Rent comps 3 comps
| Address | Beds | Baths | Sqft | Rent | $/sqft | DOM | Units | Dist |
|---|---|---|---|---|---|---|---|---|
| 1750 Arnold Way Alpine, CA | 1.0 | 1.0 | 700 | $2,202 | $3.15 | 1d | 6 | 1.11mi |
| 1829 Arnold Way Alpine, CA | 2.0 | 2.0 | 987 | $2,738 | $2.77 | 1d | 7 | 1.37mi |
| 1539 Tavern Rd Alpine, CA | 2.0 | 1.0–2.0 | 900 | $2,379 | $2.64 | 1d | 12 | 1.49mi |
Listing history 23 events
-
2026-06-18days on market $190,000 Active 36 DOM
-
2026-06-17days on market $190,000 Active 35 DOM
-
2026-06-16days on market $190,000 Active 34 DOM
-
2026-06-15days on market $190,000 Active 33 DOM
-
2026-06-13days on market $190,000 Active 31 DOM
-
2026-06-09days on market $190,000 Active 27 DOM
-
2026-06-08days on market $190,000 Active 26 DOM
-
2026-06-07days on market $190,000 Active 25 DOM
-
2026-06-04days on market $190,000 Active 22 DOM
-
2026-06-03days on market $190,000 Active 21 DOM
-
2026-06-02days on market $190,000 Active 20 DOM
-
2026-06-01days on market $190,000 Active 19 DOM
-
2026-05-31days on market $190,000 Active 18 DOM
-
2026-05-12$190,000 Active
-
2021-01-18soldstatus $99,900 Closed Sale 144-char remark
Show marketing remark (144 chars)
Great Opportunity for investors FIXER FIXER FIXER SOLD AS IS CONDITION, It is in a flood zone area, Need a septic tank, Lowest comps are in 500K
-
2021-01-07status Pending Sale 144-char remark
Show marketing remark (144 chars)
Great Opportunity for investors FIXER FIXER FIXER SOLD AS IS CONDITION, It is in a flood zone area, Need a septic tank, Lowest comps are in 500K
-
2021-01-07status Active 144-char remark
Show marketing remark (144 chars)
Great Opportunity for investors FIXER FIXER FIXER SOLD AS IS CONDITION, It is in a flood zone area, Need a septic tank, Lowest comps are in 500K
-
2021-01-04$99,999 Active 144-char remark
Show marketing remark (144 chars)
Great Opportunity for investors FIXER FIXER FIXER SOLD AS IS CONDITION, It is in a flood zone area, Need a septic tank, Lowest comps are in 500K
-
2019-07-03historical
-
2017-03-09$99,000
-
2013-10-03historical
-
2013-04-03$69,000
-
2005-12-20soldstatus $30,000
ⓘ Source: listings_history table (triggers on properties + properties_extension) + one-shot
backfill from property_details.listing_events for pre-trigger history.
Climate risk First Street
- Flood 9/10 Extreme FEMA zone A · 99% chance over 30 yrs
- Wildfire 9/10 Extreme
- Heat 5/10 Major 7 d/yr ≥97°F today · 19 d/yr by 30 yrs out
- Wind 1/10 Low
- Air quality 4/10 Moderate 6 unhealthy d/yr today · 7 by 30 yrs out
Nearby sold comps map
Loading sold comps map…
Walkable amenities ~0.75 mi
Loading nearby amenities…
Taxation est. · year 1
- Rental income
- $28,248
- − Mortgage interest
- −$10,643
- − Property taxes
- −$2,850
- − Insurance
- −$2,452
- − Repairs & maintenance
- −$2,260
- − Management
- −$2,260
- − Depreciation
- −$5,527
- Taxable income
- $2,256
- Est. tax owed @ 24.0%
- −$541
- After-tax cash flow
- $4,516/yr
For passive investors: Depreciation is non-cash, so a rental often shows a tax loss while cash-flowing — sheltering income. Rental losses are passive: they offset passive income freely, and up to $25,000/yr can offset ordinary (W-2) income if you actively participate and your MAGI is under $100k (phasing out to $0 by $150k); unused losses carry forward. On sale, claimed depreciation is recaptured at up to 25%, and gains may owe capital-gains tax (a 1031 exchange can defer both). Figures are a year-1 estimate at your 24.0% rate — not tax advice; consult a CPA.
Schools (NCES district)
- District
- Grossmont Union High
- NCES district ID
- 0616230
- Math proficiency
- 31% ▼ -1.00%
- Reading proficiency
- 60% ▲ 5.00%
- Median HH income
- $61,801
- Composite
- 40.07/100
- National rank
- #3810
- State rank
- #173 of 517 in CA
Livability — Alpine
- Score
- 58/100
- State rank
- #711
- US rank
- #21327
Category grades
Schools grade is shown separately in the Schools card above.
Census & demographics
- Census place
- Alpine, CA
- County
- San Diego County · 3,178,799 people
- City population
- 18,197
- Metro
- San Diego-Chula Vista-Carlsbad, CA
- Population (ZIP)
- 18,197
- Household income
- $114,167
- Rent vs Own
- Severe rent burden
- 417.0
Population outlook (San Diego County) Hauer SSP2
- Today (2025)
- 3,678,185 people
- By 2030
- 3,856,546 · +4.8%
- By 2040
- 4,171,407 · +13.4%
- By 2050
- 4,421,607 · +20.2%
- By 2075
- 4,831,599 · +31.4%
- By 2100
- 4,832,502 · +31.4%
Race, ethnicity, and origin ACS 2023
- Neighborhood character
- Predominantly White (73%)
- Race & ethnicity
- White 73% Hispanic / Latino 19% Two or more races 10% Asian 3% Black 2%
- Hispanic origin (detail)
- Mexican 15%
- Common ancestry
- Italian 5% Slovak 4% Lithuanian 3%
- Foreign-born
- 9% · Canada, China, South Korea
- Languages at home
- 84% English-only · Spanish 11% German/W. Germanic 2% Chinese 1%
Political lean MEDSL · San Diego
- 2024 margin
- D (+16.8) · D 56.9% · R 40.1% · Other 2.9%
- 2008→2024 swing
- +6.6pp toward D · 2008: 10.2pp · 2024: 16.8pp
- All cycles
- 2024: D+16.8 2020: D+22.8 2016: D+17.8 2012: D+5.1 2008: D+10.2
Not yet ingested
- Civics
- —
Market trends
- HPI YoY
- ▼ -453.14%
- Current HPI
- 320.0778
- Rent YoY
- ▲ 0.10%
- Metro
- San Diego-Chula Vista-Carlsbad, CA
- State GDP YoY
- ▲ 3.21%
- F500 in state
- 116
Industry mix (Fortune 500 HQ in CA)
| Industry | F500 HQs | Revenue |
|---|---|---|
| Technology | 27 | $1,492B |
|
||
| Financial Services | 3 | $174B |
|
||
| Retail | 3 | $44B |
|
||
| Insurance | 3 | $26B |
|
||
| Media / Entertainment | 2 | $115B |
|
||
| Pharmaceuticals / Biotech | 2 | $62B |
|
||
Price history
+533.3% since first listed10 events — show timeline
- 2026-05-12 Listed $190,000 SDMLS
- 2021-01-18 Sold (MLS) $99,900 CRMLS
- 2021-01-07 Pending — CRMLS
- 2021-01-07 Relisted — CRMLS
- 2021-01-04 Listed $99,999 CRMLS
- 2019-07-03 Listing Removed — CRMLS
- 2017-03-09 Listed $99,000 CRMLS
- 2013-10-03 Listing Removed — CRMLS
- 2013-04-03 Listed $69,000 CRMLS
- 2005-12-20 Sold (Public Records) $30,000 Public Records
Property tax history
+1.0%/yrLatest (2025): $107 · +2.5% YoY. Source: county tax records.
Cash-flow waterfall
monthlySold comps — $/sqft
last 12 mo · ≤1 miLoading sold comps…