9064 Pr 3353 · Gilmer, TX
Flood risk 1/10 · Minimal
- FEMA flood zone
- X (unshaded)
- Chance of flooding over 30 yrs
- 0.0%
- Est. flood insurance / yr
- $507 – $1,088
Fire risk 7/10 · Major
- Est. fire insurance / yr
- $1,222 – $2,270
Heat risk 7/10 · Major
- Hot days now (above 110°F)
- 7 days/yr
- Hot days in 30 yrs
- 25 days/yr
Wind risk 6/10 · Moderate
- Chance of severe wind over 30 yrs
- 66.0%
Air-quality risk 2/10 · Minimal
- Unhealthy air days now
- 1 days/yr
- Unhealthy air days in 30 yrs
- 1 days/yr
Risk factors via First Street. Map © Google.
Why this score? — see what drove the D+ grade
The composite is a weighted blend of 9 inputs, each scored 0–100. Each bar is that input's sub-score; the figure is the points it added to the 100-point composite (weight × sub-score).
- Cash flow +11.6/30.0
- Appreciation +10.0/10.0
- ARV discount +7.5/15.0
- Schools +4.6/10.0
- DSCR +3.4/10.0
- Livability +2.9/5.0
- 1% rule +2.7/10.0
- Rent growth +2.5/5.0
- Condition / age +2.5/5.0
$139,900
🖨 Deal sheet 📄 Offer letter ✓ Due diligence
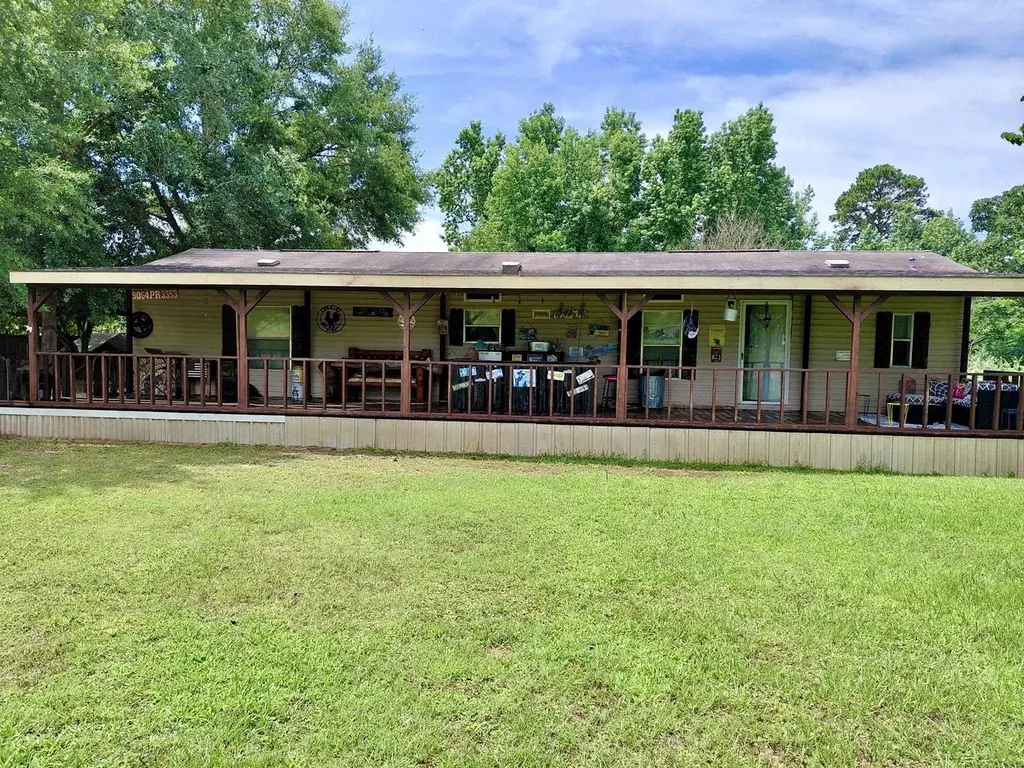
Listing remarks
Welcome to country living at its finest! Nestled on a spacious 1.4-acre corner lot in the highly sought-after Union Grove ISD, this charming 2-bedroom, 2-bath home offers the perfect blend of comfort, functionality, and rural charm. With 1,080 square feet of thoughtfully designed living space, this home is ideal for first-time buyers, downsizers, or anyone looking to enjoy a quieter lifestyle. Relax and take in the peaceful surroundings from the covered front and back porches that span the entire length of the home, providing plenty of space for outdoor entertaining, morning coffee, or evening sunsets. The property is well-equipped for animal lovers and hobby farmers, featuring a fenced are
Key facts
- Move-in ready
- Spacious corner lot
- 1.4 acre lot
Tags
Property features AI
Exterior
- Parking: Gravel parking
- Security: Smoke detector(s)
- Utilities: Electric heating; Central air
- Home design: Manufactured home; Residential property
- Construction: Composition roof
- Exterior features: Storm door(s); Wood fencing; Composition roof; Storage structure; Corner lot; Private maintained road
Interior
- Kitchen: Dishwasher; Microwave; Electric oven; Refrigerator
- Bedrooms: 5 total rooms (includes bedroom count and living spaces)
- Bathrooms: 2 full bathrooms
- Interior features: Dishwasher; Microwave; Electric oven; Refrigerator; Electric water heater; Ceiling fan(s); Central air; Central heating; Electric heating; Smoke detector(s)
- Laundry & utility: Electric water heater
Neighborhood map
What this means for you Summary
Snapshot
- This is a 2-bed/2.0-bath manufactured listed at $140k.
Deal economics
- At list price, monthly cash flow is $-44 ($-532/yr) — negative.
- To cash-flow at today's rent, offer at most $132k (5.6% below list).
- To meet the 1% rule (rent ≥ 1% of price), the offer needs to be $108k (22.6% below list).
- Recommended offer: $108k (22.6% below list) — sets the bar for 1% rule.
- Cap rate 5.9% vs local median 2.9% in Gilmer — top-decile yield for the area; either an underpriced asset or a hidden risk that comps aren't pricing in. Stress-test before assuming the spread holds.
Location & tenants
- Location reads 57/100 on livability (#1,257 in TX) — a working-class tenant base; expect higher turnover. Strengths: cost of living A+, housing A+; Watch: schools D-, amenities F, commute F.
- Union Grove ISD (rural): math 54% / reading 52% proficiency, ranked #117 of 826 in TX (top 14%) — acceptable for families but not a draw, mixed tenant base, ~2y average lease.
- Market conditions: 207 active listings in the ZIP; 34 units permitted in Upshur County in 2024 (0 in 5+ unit buildings).
Forward outlook
- In year one you build about $15k of equity ($967 loan paydown + $14k appreciation (10.0% local appreciation)).
- Upshur County population projected at +9% by 2050 — modest demand growth; plan on rents tracking national, not racing it.
- At projected returns (10.0% appreciation + 3.0% rent growth), your $39k cash investment doubles in ~3 years — after that, you're playing with house money.
- By year 3, paydown + projected appreciation supports a ~$38k cash-out refi (75% LTV) — recoverable capital for the next deal without selling this one.
Negotiation context
- It's been on market 17 days — a 2% lower offer ($138k) is reasonable based on typical stale-listing flexibility.
- Current owner paid $80k; list at $140k implies a 75% gain — meaningful room to come down on a strong offer.
Risks & watch-outs
- Climate carrying-cost: major wind risk, 66% chance of damaging wind over 30y; major wildfire risk; extreme-heat days projected 7→25/yr by 2055 (HVAC capex compounding) — expect insurance premiums to compound above CPI over the hold.
Questions for the listing agent
- What do current leases actually rent for vs. the listed asking? Can we see a recent rent roll and the last 12 months of T-12 income?
- Is there a deadline driving the sale (1031 exchange, divorce, estate, relocation)? That informs how much negotiation room exists.
- Schools are D-rated, which usually means shorter tenancies and higher turnover. Who's the typical renter profile here, and what's been the actual vacancy rate?
- The area grade is low — what's the realistic commute time and amenity access for the typical tenant pool here? Any planned neighborhood developments (good or bad) we should know about?
- What's the average days-on-market for RENTAL listings here right now (not sales)? A rising rental-DOM trend means longer vacancies and softer asking-rent achievability than the comps imply.
- What's the recent tenant-quality profile in this submarket — average credit score on applications, eviction rate, late-payment / NSF rate, and stable-employment percentage? A property-management company in the area should have these aggregated.
- How much new for-sale + rental construction is in the pipeline within 1–3 miles? Heavy new supply typically softens prices + rents 12–24 months out; constrained supply supports both.
Investment metrics
- 1% rule
- 0.77% ✗
- Cap rate
- 5.91%
- Cash-on-cash
- -1.36%
- DSCR
- 0.94
- GRM
- 10.8
CMA / ARV
No comps found within radius.
Projected returns pro-forma
10.0% appreciation · 3.0% rent growth · sell at horizon
- IRR
- 23.3%
- Equity multiple
- 2.87×
- Total profit
- $73,347
- Equity at exit
- $126,033
- IRR
- 20.8%
- Equity multiple
- 6.57×
- Total profit
- $218,166
- Equity at exit
- $271,795
Cash invested: $39,172 (down + closing). Projections, not guarantees.
Landlord ↔ Tenant lean methodology
- Overall (STATE)
- 87 Strongly Landlord-Friendly
- State Texas
- 87 Strongly Landlord-Friendly · R+5
- County
- — inherits STATE
- City
- — inherits STATE
ZIP-level market 75644
- Home prices YoY
- 10.0%
- Active inventory
- 207
- Price-to-rent
- 10.8×
Monthly cashflow live
- Estimated rent
- $1,083 medium interval (Pro) →
- Mortgage (P&I)
- −$734
- Tax from tax record
- −$108 /mo · $1,299/yr
- Insurance
- −$58
- HOA
- −$0
- Vacancy / Maint / Mgmt
- −$228
- Net cashflow
- $-44
Break-even live
UW: 25.0% down · 7.5% · 30yr · 1.5% tax · 5.0% vac · 8.0% maint · 8.0% mgmt
Financing live
Cash to close
- Down payment
- $34,975
- Closing costs
- $4,197
- Reserves months
- —
- Total cash needed
- —
Loan-product check · same deal, 3 products live
Conventional
25% down · 7.5% · 30yr
- Down + closing
- —
- Monthly P&I
- —
- Monthly cashflow
- —
- DSCR
- —
- Eligible?
- —
Personal DTI + credit; lowest rate.
DSCR
20% down · 8.5% · 30yr
- Down + closing
- —
- Monthly P&I
- —
- Monthly cashflow
- —
- DSCR
- —
- Eligible?
- —
No personal income docs; deal must DSCR.
Hard money
10% down · 12.0% · 12mo
- Down + closing
- —
- Monthly P&I
- —
- Monthly cashflow
- —
- DSCR
- —
- Eligible?
- —
Short-term bridge; refi at stabilization.
Listing history 14 events
-
2026-06-18days on market $139,900 Active 17 DOM
-
2026-06-17days on market $139,900 Active 16 DOM
-
2026-06-16days on market $139,900 Active 15 DOM
-
2026-06-15days on market $139,900 Active 14 DOM
-
2026-06-15days on market $139,900 Active 13 DOM
-
2026-06-13days on market $139,900 Active 12 DOM
-
2026-06-12days on market $139,900 Active 11 DOM
-
2026-06-09days on market $139,900 Active 8 DOM
-
2026-06-08days on market $139,900 Active 7 DOM
-
2026-06-08days on market $139,900 Active 6 DOM
-
2026-06-07days on market $139,900 Active 5 DOM
-
2026-06-03days on market $139,900 Active 2 DOM
-
2026-06-02remarks 699-char remark
-
2026-06-02$139,900 Active 1 DOM
ⓘ Source: listings_history table (triggers on properties + properties_extension) + one-shot
backfill from property_details.listing_events for pre-trigger history.
Tax reassessment forecast TX · Resets to sale price
- Current annual tax
- $1,299 · $108/mo
- Projected year-2 tax
- $2,560 · $213/mo
- Expected delta
- +$1,261/yr (+$105/mo · 97.0%)
ⓘ Screening estimate from a state-policy table — verify with the county assessor before closing.
Climate risk First Street
- Flood 1/10 Low FEMA zone X (unshaded) · 0% chance over 30 yrs
- Wildfire 7/10 Severe
- Heat 7/10 Severe 7 d/yr ≥110°F today · 25 d/yr by 30 yrs out
- Wind 6/10 Major 66% chance of damaging wind over 30 yrs
- Air quality 2/10 Low 1 unhealthy d/yr today · 1 by 30 yrs out
Nearby sold comps map
Loading sold comps map…
Walkable amenities ~0.75 mi
Loading nearby amenities…
Taxation est. · year 1
- Rental income
- $13,001
- − Mortgage interest
- −$7,837
- − Property taxes
- −$1,299
- − Insurance
- −$700
- − Repairs & maintenance
- −$1,040
- − Management
- −$1,040
- − Depreciation
- −$4,070
- Taxable loss
- −$2,984
- Est. tax savings @ 24.0%
- +$716
- After-tax cash flow
- $185/yr
For passive investors: Depreciation is non-cash, so a rental often shows a tax loss while cash-flowing — sheltering income. Rental losses are passive: they offset passive income freely, and up to $25,000/yr can offset ordinary (W-2) income if you actively participate and your MAGI is under $100k (phasing out to $0 by $150k); unused losses carry forward. On sale, claimed depreciation is recaptured at up to 25%, and gains may owe capital-gains tax (a 1031 exchange can defer both). Figures are a year-1 estimate at your 24.0% rate — not tax advice; consult a CPA.
Schools (NCES district)
- District
- Union Grove ISD
- NCES district ID
- 4843530
- Math proficiency
- 54% ▼ -7.00%
- Reading proficiency
- 52% ▼ -4.00%
- Median HH income
- $61,597
- Composite
- 46.4/100
- National rank
- #2458
- State rank
- #117 of 826 in TX
Livability — Gilmer
- Score
- 57/100
- State rank
- #1257
- US rank
- #21903
Category grades
Schools grade is shown separately in the Schools card above.
Census & demographics
- Population (ZIP)
- 12,785
Population outlook (Upshur County) Hauer SSP2
- Today (2025)
- 42,771 people
- By 2030
- 43,788 · +2.4%
- By 2040
- 45,574 · +6.6%
- By 2050
- 46,683 · +9.1%
- By 2075
- 49,137 · +14.9%
- By 2100
- 47,457 · +11.0%
Race, ethnicity, and origin ACS 2023
- Neighborhood character
- Predominantly White (73%)
- Race & ethnicity
- White 73% Black 11% Hispanic / Latino 10% Two or more races 10%
- Hispanic origin (detail)
- Mexican 10%
- Common ancestry
- Serbian 4% Slovak 2% Lithuanian 2%
- Foreign-born
- 2% · Canada, Philippines
- Languages at home
- 95% English-only · Spanish 4% Chinese 1%
Political lean MEDSL · Upshur
- 2024 margin
- Solid R (+71.0) · D 14.2% · R 85.2%
- 2008→2024 swing
- -22.0pp toward R · 2008: -49.0pp · 2024: -71.0pp
- All cycles
- 2024: R+71.0 2020: R+68.5 2016: R+68.0 2012: R+59.8 2008: R+49.0
Not yet ingested
- Civics
- —
Market trends
- HPI YoY
- ▲ 27.46%
- Current HPI
- 300.86
- Rent YoY
- —
- Metro
- —
- State GDP YoY
- ▲ 3.95%
- F500 in state
- 110
Industry mix (Fortune 500 HQ in TX)
| Industry | F500 HQs | Revenue |
|---|---|---|
| Energy | 16 | $1,198B |
|
||
| Technology | 5 | $198B |
|
||
| Engineering / Construction | 4 | $72B |
|
||
| Energy Services | 3 | $60B |
|
||
| Utilities | 3 | $41B |
|
||
| Healthcare | 2 | $330B |
|
||
Price history
+74.9% since first listed2 events — show timeline
- 2026-06-01 Listed $139,900 LAAR
- 2020-10-05 Sold (Public Records) $80,000 Public Records
Property tax history
+5.4%/yrLatest (2025): $1,299 · -3.1% YoY. Source: county tax records.
Cash-flow waterfall
monthlySold comps — $/sqft
last 12 mo · ≤1 miLoading sold comps…