None · Jenkintown, PA
Flood risk 1/10 · Minimal
- FEMA flood zone
- X (unshaded)
- Chance of flooding over 30 yrs
- 0.0%
- Est. flood insurance / yr
- $507 – $1,088
Fire risk 1/10 · Minimal
- Est. fire insurance / yr
- $511 – $949
Heat risk 6/10 · Moderate
- Hot days now (above 102°F)
- 7 days/yr
- Hot days in 30 yrs
- 15 days/yr
Wind risk 6/10 · Moderate
- Chance of severe wind over 30 yrs
- 27.0%
Air-quality risk 4/10 · Minor
- Unhealthy air days now
- 4 days/yr
- Unhealthy air days in 30 yrs
- 7 days/yr
Risk factors via First Street. Map © Google.
Why this score? — see what drove the D grade
The composite is a weighted blend of 9 inputs, each scored 0–100. Each bar is that input's sub-score; the figure is the points it added to the 100-point composite (weight × sub-score).
- ARV discount +15.0/15.0
- 1% rule +7.2/10.0
- Schools +5.6/10.0
- Livability +4.7/5.0
- Rent growth +3.8/5.0
- Condition / age +2.5/5.0
- Cash flow +2.4/30.0
- DSCR +0.0/10.0
- Appreciation +0.0/10.0
$130,000
🖨 Deal sheet 📄 Offer letter ✓ Due diligence
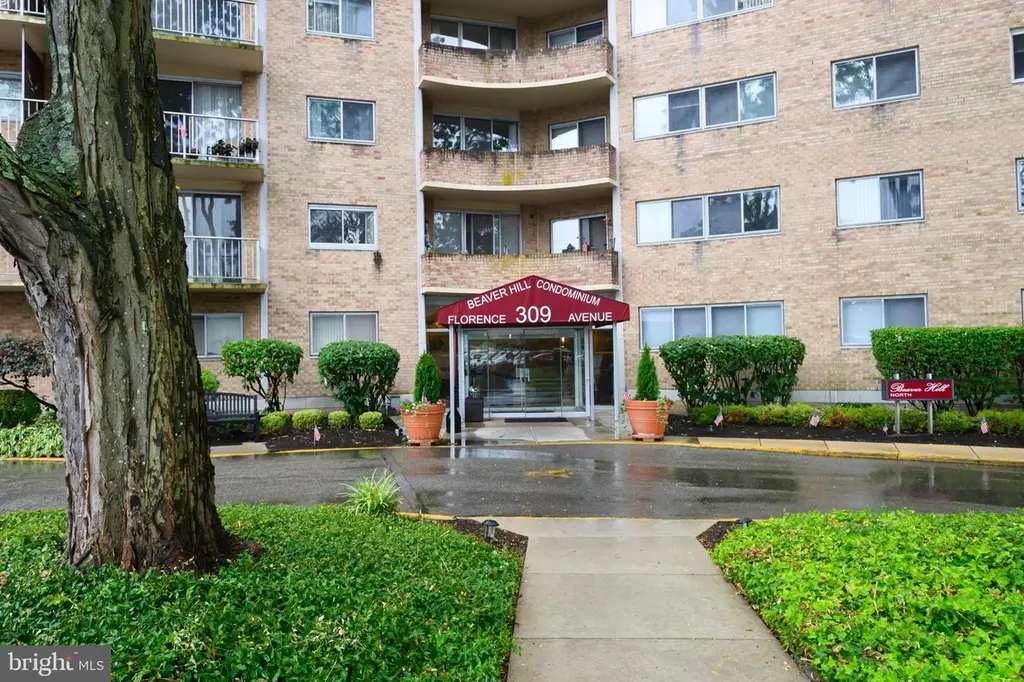
Listing remarks MLS
Beautiful one bedroom condo ready for you to move in! The lovely lobby is welcoming and warm offering a mail room and elevators. Upon entering the unit, you'll find two spacious closets and a new kitchen! The spacious living room and bedroom are newly finished as well. Large patio for you to enjoy! There is also a community pool available.
Key facts
- New kitchen
- Spacious closets
- Lovely lobby
Tags
Neighborhood map
What this means for you Summary
Snapshot
- This is a 1-bed/1.0-bath condo listed at $130k.
Deal economics
- At list price, monthly cash flow is $-455 ($-5k/yr) — negative.
- To cash-flow at today's rent, offer at most $64k (50.9% below list).
- Meets the 1% rule at list price ($2k rent vs $130k).
- Recommended offer: $64k (50.9% below list) — sets the bar for cash-flow.
- Cap rate 2.1% vs local median 1.5% in Jenkintown — top-decile yield for the area; either an underpriced asset or a hidden risk that comps aren't pricing in. Stress-test before assuming the spread holds.
Location & tenants
- Location reads 94/100 on livability (#3 in PA, #7 nationally) — a professional / high-income tenant draw. Strengths: schools A+, amenities A+, commute A+; Watch: cost of living D.
- Jenkintown SD (suburban): math 47% / reading 81% proficiency, ranked #49 of 539 in PA (top 9%) — acceptable for families but not a draw, mixed tenant base, ~2y average lease; only 12% free/reduced lunch — higher-income household profile.
- Market conditions: Rents rising fast (+5.0%/yr); 38 active listings in the ZIP; 7 comparable units currently listed for rent nearby; rentals lingering (median 44d on market — plan ~5-8 weeks vacancy on turnover, expect pricing pressure); 57% of comp listings sitting > 30 days — soft ceiling on asking rent; solid renter incomes; 1,936 units permitted in Montgomery County in 2024 (530 in 5+ unit buildings).
- This rent is only 17% of the median local income ($110k/yr) — well below the 30% rent-burden line; pricing power to push rent on renewal without tenant pushback.
Forward outlook
- Local home prices are declining (-3.0%/yr); year-one equity from $899 of loan paydown is wiped out by about $4k of value loss. Plan a longer hold.
- Montgomery County population projected at +5% by 2050 — modest demand growth; plan on rents tracking national, not racing it.
Negotiation context
- It's been on market 135 days — a 12% lower offer ($114k) is reasonable based on typical stale-listing flexibility.
- 2 sale attempts with the ask held roughly flat each time — persistent listings suggest the price (not the market) is what's stuck; bring a comps-based counter.
- Current owner paid $68k; list at $130k implies a 90% gain — meaningful room to come down on a strong offer.
Risks & watch-outs
- Watch-outs: HOA is 44% of rent.
- Climate carrying-cost: major wind risk, 27% chance of damaging wind over 30y; extreme-heat days projected 7→15/yr by 2055 (HVAC capex compounding) — expect insurance premiums to compound above CPI over the hold.
Questions for the listing agent
- What do current leases actually rent for vs. the listed asking? Can we see a recent rent roll and the last 12 months of T-12 income?
- It's been on market 135 days. Have you received any prior offers? Is the seller open to a 51% concession, seller financing, or rate buy-down credit?
- Built in 1968 — when were the roof, HVAC, electrical panel, plumbing, and water heater last replaced?
- What does the HOA fee cover, when was the last increase, and are there any pending special assessments or reserve-fund shortfalls?
- Any open or pending special assessments — roof, HVAC, plumbing, elevator, façade? What's the per-unit balance and payoff schedule, and is the seller paying it off at close or rolling it to the buyer?
- Why hasn't it sold? Are there any deal-killer items the seller is aware of (foundation, flood, title, zoning, code violations)?
- Is there a deadline driving the sale (1031 exchange, divorce, estate, relocation)? That informs how much negotiation room exists.
- Schools are A-rated — typically a magnet for longer-tenancy family renters. What's the average tenant stay here, and is there a school-zone premium baked into asking?
- The area grade is low — what's the realistic commute time and amenity access for the typical tenant pool here? Any planned neighborhood developments (good or bad) we should know about?
- What's the average days-on-market for RENTAL listings here right now (not sales)? A rising rental-DOM trend means longer vacancies and softer asking-rent achievability than the comps imply.
- What's the recent tenant-quality profile in this submarket — average credit score on applications, eviction rate, late-payment / NSF rate, and stable-employment percentage? A property-management company in the area should have these aggregated.
- How much new apartment / multifamily construction is in the pipeline within 1–3 miles? Heavy new supply (>2% of stock underway) typically softens rents 12–24 months out; light construction supports rent growth.
Investment metrics
- 1% rule
- 1.22% ✓
- Cap rate
- 2.09%
- Cash-on-cash
- -15.01%
- DSCR
- 0.33
- GRM
- 6.8
CMA / ARV
- ARV (median comp)
- $162,049
- List price
- $130,000
- Delta
- -19.78%
- Verdict
- UNDERPRICED
- Comps
- 20 within 1.0 mi
Projected returns pro-forma
-3.0% appreciation · 5.0% rent growth · sell at horizon
- IRR
- -38.9%
- Equity multiple
- -0.27×
- Total profit
- $-46,297
- Equity at exit
- $19,383
- IRR
- -31.8%
- Equity multiple
- -0.69×
- Total profit
- $-61,654
- Equity at exit
- $11,240
Cash invested: $36,400 (down + closing). Projections, not guarantees.
Landlord ↔ Tenant lean methodology
- Overall (STATE)
- 62 Landlord-Friendly
- State Pennsylvania
- 62 Landlord-Friendly · EVEN
- County
- — inherits STATE
- City
- — inherits STATE
ZIP-level market 19046
- Rents YoY
- 5.0%
- Active inventory
- 38
- Price-to-rent
- 6.8×
Monthly cashflow live
- Estimated rent
- $1,583 high interval (Pro) →
- Mortgage (P&I)
- −$682
- Tax from tax record
- −$266 /mo · $3,194/yr
- Insurance
- −$54
- HOA
- −$704
- Vacancy / Maint / Mgmt
- −$332
- Net cashflow
- $-455
Break-even live
UW: 25.0% down · 7.5% · 30yr · 1.5% tax · 5.0% vac · 8.0% maint · 8.0% mgmt
Financing live
Cash to close
- Down payment
- $32,500
- Closing costs
- $3,900
- Reserves months
- —
- Total cash needed
- —
Loan-product check · same deal, 3 products live
Conventional
25% down · 7.5% · 30yr
- Down + closing
- —
- Monthly P&I
- —
- Monthly cashflow
- —
- DSCR
- —
- Eligible?
- —
Personal DTI + credit; lowest rate.
DSCR
20% down · 8.5% · 30yr
- Down + closing
- —
- Monthly P&I
- —
- Monthly cashflow
- —
- DSCR
- —
- Eligible?
- —
No personal income docs; deal must DSCR.
Hard money
10% down · 12.0% · 12mo
- Down + closing
- —
- Monthly P&I
- —
- Monthly cashflow
- —
- DSCR
- —
- Eligible?
- —
Short-term bridge; refi at stabilization.
Rent comps 7 comps
| Address | Beds | Baths | Sqft | Rent | $/sqft | DOM | Units | Dist |
|---|---|---|---|---|---|---|---|---|
| 414 West Ave Unit G Jenkintown, PA | 1.0 | 1.0 | 590 | $1,250 | $2.12 | 4d | 1 | 0.30mi |
| 500 West Ave Unit A06 Jenkintown, PA | 1.0 | 1.0 | 700 | $1,400 | $2.00 | 5d | 1 | 0.32mi |
| 501 Washington Ln Unit 308 Jenkintown, PA | — | 1.0 | 558 | $1,725 | $3.09 | 43d | 1 | 0.48mi |
| 501 Washington Ln Ste 207 Jenkintown, PA | 1.0 | 1.0 | 600 | $2,008 | $3.35 | 43d | 1 | 0.48mi |
| 501 Washington Ln Ste 402 Jenkintown, PA | 1.0 | 1.0 | 600 | $2,034 | $3.39 | 43d | 1 | 0.48mi |
| 501 Washington Ln Ste 204 Jenkintown, PA | — | 1.0 | 558 | $1,625 | $2.91 | 43d | 1 | 0.48mi |
| 400 York Rd Unit 301 Jenkintown, PA | 2.0 | 1.0 | 1100 | $2,195 | $2.00 | 18d | 1 | 0.53mi |
HOA detail condo
- Monthly dues
- $704 · $8,448/yr
- Likely covers
- pool
- Assessments
- None detected in remarks — confirm with the listing agent.
Listing history 21 events
-
2026-06-18days on market $130,000 Active 135 DOM
-
2026-06-17days on market $130,000 Active 134 DOM
-
2026-06-16days on market $130,000 Active 133 DOM
-
2026-06-15days on market $130,000 Active 132 DOM
-
2026-06-13days on market $130,000 Active 130 DOM
-
2026-06-13days on market $130,000 Active 129 DOM
-
2026-06-09days on market $130,000 Active 126 DOM
-
2026-06-08days on market $130,000 Active 125 DOM
-
2026-06-07days on market $130,000 Active 124 DOM
-
2026-06-04days on market $130,000 Active 121 DOM
-
2026-06-03days on market $130,000 Active 120 DOM
-
2026-06-02days on market $130,000 Active 119 DOM
-
2026-06-01days on market $130,000 Active 118 DOM
-
2026-05-31days on market $130,000 Active 117 DOM
-
2026-02-03$130,000 Active 344-char remark
Show marketing remark (344 chars)
Beautiful one bedroom condo ready for you to move in! The lovely lobby is welcoming and warm offering a mail room and elevators. Upon entering the unit, you'll find two spacious closets and a new kitchen! The spacious living room and bedroom are newly finished as well. Large patio for you to enjoy! There is also a community pool available.
-
2026-01-12historical
-
2025-10-16price $140,000
-
2025-09-03$150,000 Active
-
2013-08-20soldstatus $68,500
-
2001-03-22soldstatus $72,500
-
1981-02-01soldstatus $48,365
ⓘ Source: listings_history table (triggers on properties + properties_extension) + one-shot
backfill from property_details.listing_events for pre-trigger history.
Tax reassessment forecast PA · Partial reset (capped growth)
- Current annual tax
- $3,194 · $266/mo
- Projected year-2 tax
- $3,194 · $266/mo
- Expected delta
- $0/yr ($0/mo · 0.0%)
ⓘ Screening estimate from a state-policy table — verify with the county assessor before closing.
Climate risk First Street
- Flood 1/10 Low FEMA zone X (unshaded) · 0% chance over 30 yrs
- Wildfire 1/10 Low
- Heat 6/10 Major 7 d/yr ≥102°F today · 15 d/yr by 30 yrs out
- Wind 6/10 Major 27% chance of damaging wind over 30 yrs
- Air quality 4/10 Moderate 4 unhealthy d/yr today · 7 by 30 yrs out
Nearby sold comps map
Loading sold comps map…
Walkable amenities ~0.75 mi
Loading nearby amenities…
Taxation est. · year 1
- Rental income
- $18,998
- − Mortgage interest
- −$7,282
- − Property taxes
- −$3,194
- − Insurance
- −$650
- − Repairs & maintenance
- −$1,520
- − Management
- −$1,520
- − HOA
- −$8,448
- − Depreciation
- −$3,782
- Taxable loss
- −$7,397
- Est. tax savings @ 24.0%
- +$1,775
- After-tax cash flow
- $-3,689/yr
For passive investors: Depreciation is non-cash, so a rental often shows a tax loss while cash-flowing — sheltering income. Rental losses are passive: they offset passive income freely, and up to $25,000/yr can offset ordinary (W-2) income if you actively participate and your MAGI is under $100k (phasing out to $0 by $150k); unused losses carry forward. On sale, claimed depreciation is recaptured at up to 25%, and gains may owe capital-gains tax (a 1031 exchange can defer both). Figures are a year-1 estimate at your 24.0% rate — not tax advice; consult a CPA.
Schools (NCES district)
- District
- Jenkintown SD
- NCES district ID
- 4212420
- Math proficiency
- 47% ▼ -14.00%
- Reading proficiency
- 81% ▲ 5.00%
- Median HH income
- $68,672
- Composite
- 56.04/100
- National rank
- #1187
- State rank
- #49 of 539 in PA
Livability — Jenkintown
- Score
- 94/100
- State rank
- #3
- US rank
- #7
Category grades
Schools grade is shown separately in the Schools card above.
Census & demographics
- Census place
- Jenkintown, PA
- County
- Montgomery County · 712,331 people
- City population
- 19,640
- Metro
- Philadelphia-Camden-Wilmington, PA-NJ-DE-MD
- Population (ZIP)
- 19,640
- Household income
- $109,818
- Rent vs Own
- Severe rent burden
- 745.0
Population outlook (Montgomery County) Hauer SSP2
- Today (2025)
- 856,074 people
- By 2030
- 870,887 · +1.7%
- By 2040
- 891,195 · +4.1%
- By 2050
- 896,417 · +4.7%
- By 2075
- 903,212 · +5.5%
- By 2100
- 843,240 · -1.5%
Race, ethnicity, and origin ACS 2023
- Neighborhood character
- Predominantly White (81%)
- Race & ethnicity
- White 81% Two or more races 7% Hispanic / Latino 6% Black 5% Asian 3%
- Hispanic origin (detail)
- Mexican 1% Puerto Rican 3%
- Common ancestry
- Romanian 5% Scotch-Irish 3% Subsaharan African 2%
- Foreign-born
- 9% · Canada, South Korea, Vietnam
- Languages at home
- 89% English-only · Other Indo-European 3% Spanish 2% Russian/Polish/Slavic 2%
Political lean MEDSL · Montgomery
- 2024 margin
- Strong D (+22.8) · D 60.9% · R 38.1% · Other 1.1%
- 2008→2024 swing
- +2.0pp toward D · 2008: 20.8pp · 2024: 22.8pp
- All cycles
- 2024: D+22.8 2020: D+26.3 2016: D+21.1 2012: D+14.3 2008: D+20.8
Not yet ingested
- Civics
- —
Market trends
- HPI YoY
- ▼ -304.21%
- Current HPI
- 285.5688
- Rent YoY
- ▲ 5.00%
- Metro
- Philadelphia-Camden-Wilmington, PA-NJ-DE-MD
- State GDP YoY
- ▲ 1.68%
- F500 in state
- 34
Industry mix (Fortune 500 HQ in PA)
| Industry | F500 HQs | Revenue |
|---|---|---|
| Healthcare | 2 | $309B |
|
||
| Insurance | 2 | $27B |
|
||
| Telecommunications / Media | 1 | $124B |
|
||
| Industrial Distribution | 1 | $22B |
|
||
| Financial Services | 1 | $20B |
|
||
| Chemicals / Materials | 1 | $18B |
|
||
Price history
+168.8% since first listed7 events — show timeline
- 2026-02-03 Listed $130,000 BRIGHT MLS
- 2026-01-12 Listing Removed — BRIGHT MLS
- 2025-10-16 Price Changed $140,000 BRIGHT MLS
- 2025-09-03 Listed $150,000 BRIGHT MLS
- 2013-08-20 Sold (Public Records) $68,500 Public Records
- 2001-03-22 Sold (Public Records) $72,500 Public Records
- 1981-02-01 Sold (Public Records) $48,365 Public Records
Property tax history
+1.9%/yrLatest (2026): $3,194 · +3.5% YoY. Source: county tax records.
Cash-flow waterfall
monthlySold comps — $/sqft
last 12 mo · ≤1 miLoading sold comps…