211 Sunset Ave NW · Altura, MN
Flood risk 1/10 · Minimal
- FEMA flood zone
- —
- Chance of flooding over 30 yrs
- 0.0%
- Est. flood insurance / yr
- —
Fire risk 1/10 · Minimal
- Est. fire insurance / yr
- $888 – $1,650
Heat risk 2/10 · Minimal
- Hot days now (above 99°F)
- 7 days/yr
- Hot days in 30 yrs
- 14 days/yr
Wind risk 2/10 · Minimal
- Chance of severe wind over 30 yrs
- —
Air-quality risk 1/10 · Minimal
- Unhealthy air days now
- 0 days/yr
- Unhealthy air days in 30 yrs
- 0 days/yr
Risk factors via First Street. Map © Google.
Why this score? — see what drove the D grade
The composite is a weighted blend of 9 inputs, each scored 0–100. Each bar is that input's sub-score; the figure is the points it added to the 100-point composite (weight × sub-score).
- Cash flow +9.1/30.0
- ARV discount +7.5/15.0
- Appreciation +6.5/10.0
- Schools +3.6/10.0
- Livability +3.3/5.0
- 1% rule +2.5/10.0
- DSCR +2.5/10.0
- Rent growth +2.5/5.0
- Condition / age +2.5/5.0
$150,000
🖨 Deal sheet 📄 Offer letter ✓ Due diligence
Listing remarks
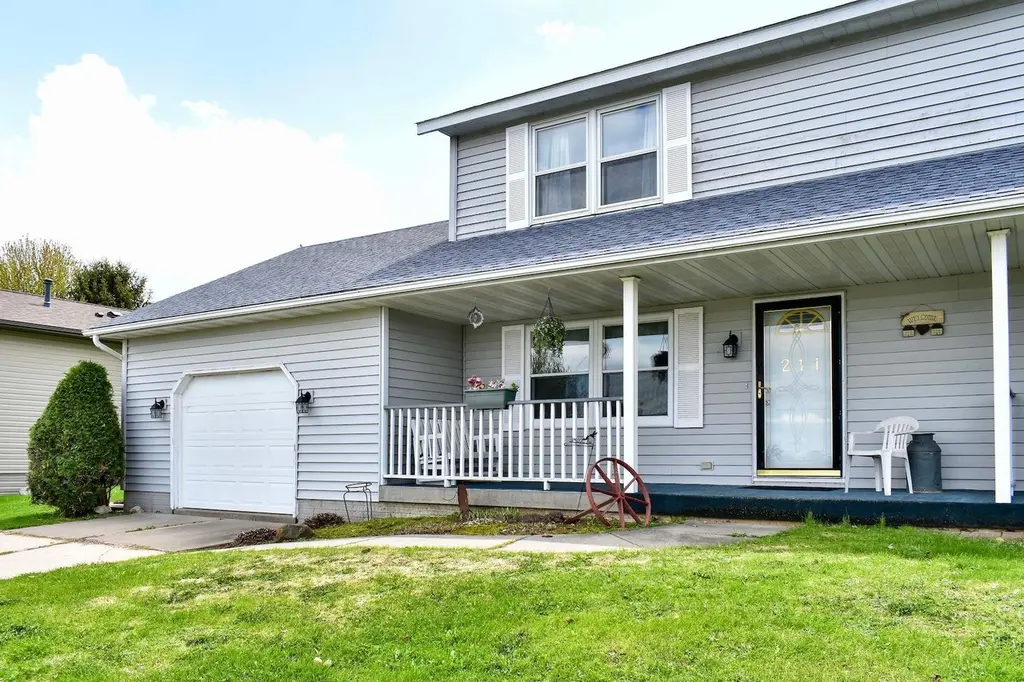
Welcome to this unique twin home opportunity in a peaceful small-town setting, ideally located between Winona and Rochester. Both sides of this property are available for purchase, offering incredible flexibility—perfect for multi-generational living, investing, or owner-occupying one side while renting the other. This wonderful home features an inviting open-concept layout, seamlessly connecting the kitchen and living room for easy everyday living and entertaining. Upstairs, you’ll find two generously sized bedrooms, including a spacious primary bedroom with a desirable walk-in closet. A full bathroom serves the upper level, while a convenient half bath is located on the m
Key facts
- Walk-in closet
- New roof installed
- Open-concept layout
Tags
Property features AI
Exterior
- Parking: Attached garage (1 car)
- Utilities: City water; City sewer; Natural gas; Electric service with circuit breakers
- Home design: Residential attached property; Two levels; Entry on main level
- Construction: Poured concrete foundation; Block basement with egress window(s), full and unfinished
- Exterior features: Vinyl exterior; Porch; Lot approximately 50 x 120 (0.13 acres)
Interior
- Kitchen: Dishwasher; Range; Microwave; Refrigerator; Kitchen sized 16.7 x 13
- Bedrooms: 2 bedrooms (both on the upper level)
- Bathrooms: One full bathroom on the upper level; Half bath on the main level
- Heating & cooling: Forced air heating; Central air conditioning
- Interior features: Ceiling fans; Kitchen window; Primary bedroom with walk-in closet; Porch
- Laundry & utility: Washer and dryer included; Washer hookup; Laundry sink; Laundry in basement
Neighborhood map
What this means for you Summary
Snapshot
- This is a 2-bed/2.0-bath single-family listed at $150k.
Deal economics
- At list price, monthly cash flow is $-116 ($-1k/yr) — negative.
- To cash-flow at today's rent, offer at most $130k (13.6% below list).
- To meet the 1% rule (rent ≥ 1% of price), the offer needs to be $113k (24.8% below list).
- Recommended offer: $113k (24.8% below list) — sets the bar for 1% rule.
Location & tenants
- Location reads 66/100 on livability (#514 in MN) — a middle-class / working-renter tenant base. Strengths: cost of living A+, housing A, employment B+; Watch: health & safety C-, amenities F, commute F.
- Lewiston-Altura Public School District (rural): math 31% / reading 51% proficiency, ranked #208 of 301 in MN (top 69%) — families likely to look elsewhere, expect single-tenant / working-renter base with shorter leases.
- Market conditions: 5 active listings in the ZIP; 37 units permitted in Winona County in 2024 (0 in 5+ unit buildings).
Forward outlook
- In year one you build about $5k of equity ($1k loan paydown + $4k appreciation (2.9% local appreciation)).
- Winona County population projected to shrink 9% by 2050 — rents likely to lag national; underwrite the cash flow, not the appreciation.
- By year 7, paydown + projected appreciation supports a ~$34k cash-out refi (75% LTV) — recoverable capital for the next deal without selling this one.
Negotiation context
- It's been on market 17 days — a 2% lower offer ($148k) is reasonable based on typical stale-listing flexibility.
- 3 sale attempts since 18y ago with the ask held roughly flat each time — persistent listings suggest the price (not the market) is what's stuck; bring a comps-based counter.
Questions for the listing agent
- What do current leases actually rent for vs. the listed asking? Can we see a recent rent roll and the last 12 months of T-12 income?
- Is there a deadline driving the sale (1031 exchange, divorce, estate, relocation)? That informs how much negotiation room exists.
- The area grade is low — what's the realistic commute time and amenity access for the typical tenant pool here? Any planned neighborhood developments (good or bad) we should know about?
- What's the average days-on-market for RENTAL listings here right now (not sales)? A rising rental-DOM trend means longer vacancies and softer asking-rent achievability than the comps imply.
- What's the recent tenant-quality profile in this submarket — average credit score on applications, eviction rate, late-payment / NSF rate, and stable-employment percentage? A property-management company in the area should have these aggregated.
- How much new for-sale + rental construction is in the pipeline within 1–3 miles? Heavy new supply typically softens prices + rents 12–24 months out; constrained supply supports both.
Investment metrics
- 1% rule
- 0.75% ✗
- Cap rate
- 5.37%
- Cash-on-cash
- -3.30%
- DSCR
- 0.85
- GRM
- 11.1
CMA / ARV
No comps found within radius.
Projected returns pro-forma
2.94% appreciation · 3.0% rent growth · sell at horizon
- IRR
- 4.3%
- Equity multiple
- 1.24×
- Total profit
- $10,231
- Equity at exit
- $66,941
- IRR
- 7.5%
- Equity multiple
- 2.13×
- Total profit
- $47,352
- Equity at exit
- $102,772
Cash invested: $42,000 (down + closing). Projections, not guarantees.
Landlord ↔ Tenant lean methodology
- Overall (STATE)
- 46 Balanced
- State Minnesota
- 46 Balanced · D+2
- County
- — inherits STATE
- City
- — inherits STATE
ZIP-level market 55910
- Home prices YoY
- 1.6%
- Active inventory
- 5
- Price-to-rent
- 11.1×
Monthly cashflow live
- Estimated rent
- $1,128 medium interval (Pro) →
- Mortgage (P&I)
- −$787
- Tax from tax record
- −$158 /mo · $1,894/yr
- Insurance
- −$62
- HOA
- −$0
- Vacancy / Maint / Mgmt
- −$237
- Net cashflow
- $-116
Break-even live
UW: 25.0% down · 7.5% · 30yr · 1.5% tax · 5.0% vac · 8.0% maint · 8.0% mgmt
Financing live
Cash to close
- Down payment
- $37,500
- Closing costs
- $4,500
- Reserves months
- —
- Total cash needed
- —
Loan-product check · same deal, 3 products live
Conventional
25% down · 7.5% · 30yr
- Down + closing
- —
- Monthly P&I
- —
- Monthly cashflow
- —
- DSCR
- —
- Eligible?
- —
Personal DTI + credit; lowest rate.
DSCR
20% down · 8.5% · 30yr
- Down + closing
- —
- Monthly P&I
- —
- Monthly cashflow
- —
- DSCR
- —
- Eligible?
- —
No personal income docs; deal must DSCR.
Hard money
10% down · 12.0% · 12mo
- Down + closing
- —
- Monthly P&I
- —
- Monthly cashflow
- —
- DSCR
- —
- Eligible?
- —
Short-term bridge; refi at stabilization.
Listing history 6 events
-
2026-05-18status Pending 1028-char remark
-
2026-05-11historical Contingent - Inspection 1028-char remark
-
2026-05-01$150,000 Active 1028-char remark
-
2018-12-10historical
-
2008-09-30$101,900
-
2008-09-30$101,900
ⓘ Source: listings_history table (triggers on properties + properties_extension) + one-shot
backfill from property_details.listing_events for pre-trigger history.
Tax reassessment forecast MN · Partial reset (capped growth)
- Current annual tax
- $1,894 · $158/mo
- Projected year-2 tax
- $1,894 · $158/mo
- Expected delta
- $0/yr ($0/mo · 0.0%)
ⓘ Screening estimate from a state-policy table — verify with the county assessor before closing.
Climate risk First Street
- Flood 1/10 Low 0% chance over 30 yrs
- Wildfire 1/10 Low
- Heat 2/10 Low 7 d/yr ≥99°F today · 14 d/yr by 30 yrs out
- Wind 2/10 Low
- Air quality 1/10 Low 0 unhealthy d/yr today · 0 by 30 yrs out
Nearby sold comps map
Loading sold comps map…
Walkable amenities ~0.75 mi
Loading nearby amenities…
Taxation est. · year 1
- Rental income
- $13,540
- − Mortgage interest
- −$8,402
- − Property taxes
- −$1,894
- − Insurance
- −$750
- − Repairs & maintenance
- −$1,083
- − Management
- −$1,083
- − Depreciation
- −$4,364
- Taxable loss
- −$4,037
- Est. tax savings @ 24.0%
- +$969
- After-tax cash flow
- $-418/yr
For passive investors: Depreciation is non-cash, so a rental often shows a tax loss while cash-flowing — sheltering income. Rental losses are passive: they offset passive income freely, and up to $25,000/yr can offset ordinary (W-2) income if you actively participate and your MAGI is under $100k (phasing out to $0 by $150k); unused losses carry forward. On sale, claimed depreciation is recaptured at up to 25%, and gains may owe capital-gains tax (a 1031 exchange can defer both). Figures are a year-1 estimate at your 24.0% rate — not tax advice; consult a CPA.
Schools (NCES district)
- District
- Lewiston-Altura Public School District
- NCES district ID
- 2718090
- Math proficiency
- 31% ▼ -18.00%
- Reading proficiency
- 51% ▼ -12.00%
- Median HH income
- $58,763
- Composite
- 36.09/100
- National rank
- #4760
- State rank
- #208 of 301 in MN
Livability — Altura
- Score
- 66/100
- State rank
- #514
- US rank
- #12368
Category grades
Schools grade is shown separately in the Schools card above.
Census & demographics
- Census place
- Altura, MN
- Population (ZIP)
- 1,232
Population outlook (Winona County) Hauer SSP2
- Today (2025)
- 50,614 people
- By 2030
- 50,243 · -0.7%
- By 2040
- 48,142 · -4.9%
- By 2050
- 45,872 · -9.4%
- By 2075
- 42,416 · -16.2%
- By 2100
- 40,031 · -20.9%
Race, ethnicity, and origin ACS 2023
- Neighborhood character
- Predominantly White (93%)
- Race & ethnicity
- White 93% Hispanic / Latino 5% Two or more races 2%
- Common ancestry
- Portuguese 12% Lithuanian 3% Romanian 3%
- Foreign-born
- 1% · Canada
- Languages at home
- 98% English-only · Spanish 1%
Political lean MEDSL · Winona
- 2024 margin
- Toss-up / Even · D 46.6% · R 51.5% · Other 1.8%
- 2008→2024 swing
- -24.0pp toward R · 2008: 19.1pp · 2024: -4.9pp
- All cycles
- 2024: R+4.9 2020: D+0.4 2016: R+2.9 2012: D+12.9 2008: D+19.1
Not yet ingested
- Civics
- —
Market trends
- HPI YoY
- ▲ 2.94%
- Current HPI
- 182.83
- Rent YoY
- —
- Metro
- —
- State GDP YoY
- ▲ 2.41%
- F500 in state
- 34
Industry mix (Fortune 500 HQ in MN)
| Industry | F500 HQs | Revenue |
|---|---|---|
| Healthcare | 2 | $407B |
|
||
| Retail | 2 | $150B |
|
||
| Consumer Goods | 2 | $32B |
|
||
| Industrial Machinery | 2 | $6B |
|
||
| Agriculture | 1 | $40B |
|
||
| Healthcare / Medical Devices | 1 | $32B |
|
||
Price history
+49.4% since first listed8 events — show timeline
- 2026-06-05 Sold (Public Records) $152,250 Public Records
- 2026-06-05 Sold (MLS) $152,250 NORTHSTARMLS as Distributed by MLS Grid
- 2026-05-18 Pending — NORTHSTARMLS as Distributed by MLS Grid
- 2026-05-11 Contingent — NORTHSTARMLS as Distributed by MLS Grid
- 2026-05-01 Listed $150,000 NORTHSTARMLS as Distributed by MLS Grid
- 2018-12-10 Listing Removed — NORTHSTARMLS as Distributed by MLS Grid
- 2008-09-30 Listed $101,900 NORTHSTARMLS as Distributed by MLS Grid
- 2008-09-30 Listed $101,900 NORTHSTARMLS as Distributed by MLS Grid
Property tax history
+5.6%/yrLatest (2025): $1,894 · +28.3% YoY. Source: county tax records.
Cash-flow waterfall
monthlySold comps — $/sqft
last 12 mo · ≤1 miLoading sold comps…