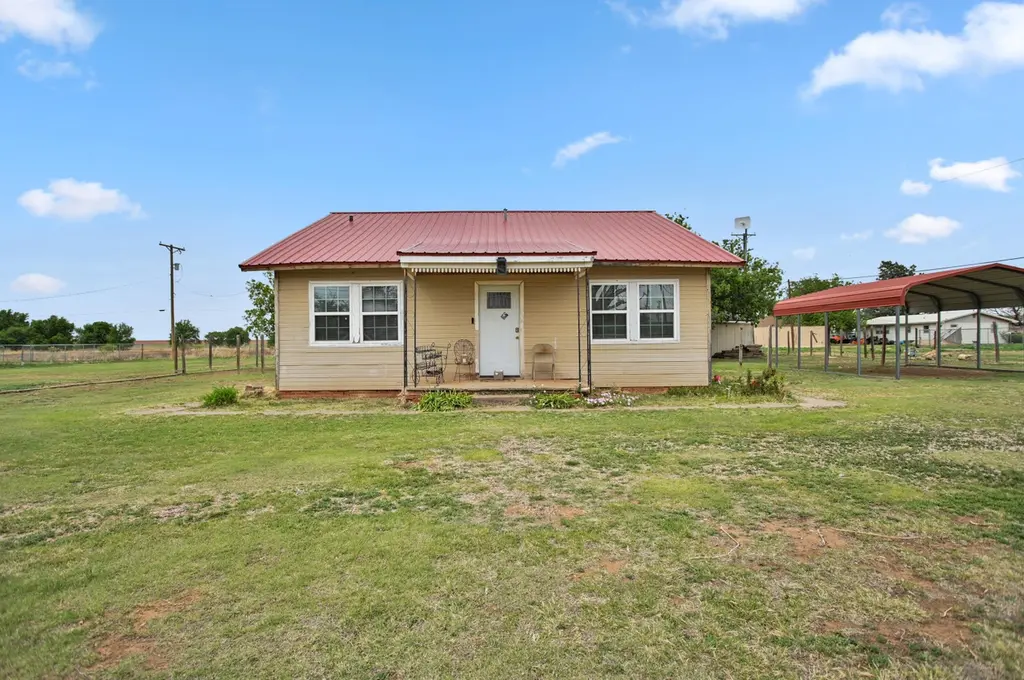
618 W 1st St · Crosbyton, TX
Flood risk No data
- FEMA flood zone
- —
- Chance of flooding over 30 yrs
- —
- Est. flood insurance / yr
- —
Fire risk No data
- Est. fire insurance / yr
- —
Heat risk No data
- Hot days now (above threshold)
- —
- Hot days in 30 yrs
- —
Wind risk No data
- Chance of severe wind over 30 yrs
- —
Air-quality risk No data
- Unhealthy air days now
- —
- Unhealthy air days in 30 yrs
- —
Risk factors via First Street. Map © Google.
Why this score? — see what drove the D- grade
The composite is a weighted blend of 9 inputs, each scored 0–100. Each bar is that input's sub-score; the figure is the points it added to the 100-point composite (weight × sub-score).
- Appreciation +9.4/10.0
- ARV discount +7.5/15.0
- Cash flow +7.3/30.0
- Livability +3.0/5.0
- Schools +2.6/10.0
- Rent growth +2.5/5.0
- Condition / age +2.5/5.0
- 1% rule +2.2/10.0
- DSCR +1.5/10.0
$138,500
🖨 Deal sheet (PDF) 📄 Offer letter ✓ Due diligence
Listing remarks
Welcome to 618 W 1st Street — a rare opportunity to own a spacious 5-acre property in Crosbyton offering privacy, flexibility, and incredible potential. This two-story home features 4 bedrooms and 1 bathroom, with a functional layout designed to accommodate a variety of living needs. The main level offers comfortable everyday living, while the second story includes two additional rooms that can serve as bedrooms, playrooms, home offices, or versatile flex spaces. The property has seen several key updates, including a new water heater installed in 2022, a brand-new sewer line completed in 2024, and a recently installed exterior electrical box—providing added peace of mind on majo
Key facts
- Two hvac units
- New water heater
- 5 acre property
Tags
Property features AI
Exterior
- Parking: 2-space carport
- Utilities: Utilities not specifically listed
- Home design: Single-family residence; 2 stories; Residential property
- Construction: Brick construction; Slab foundation; Built in earlier construction (year not provided)
- Exterior features: Private yard; Storage; Composition roof
Interior
- Bathrooms: 1 full bathroom
- Heating & cooling: Natural gas heating; Ceiling fan(s) and electric cooling
- Interior features: Ceiling fan(s)
Neighborhood map
What this means for you Summary
Snapshot
- This is a 4-bed/1.0-bath single-family listed at $138k.
Deal economics
- At list price, monthly cash flow is $-182 ($-2k/yr) — negative.
- To cash-flow at today's rent, offer at most $106k (23.2% below list).
- To meet the 1% rule (rent ≥ 1% of price), the offer needs to be $100k (27.9% below list).
- Recommended offer: $100k (27.9% below list) — sets the bar for 1% rule.
Location & tenants
- Location reads 59/100 on livability (#1,147 in TX) — a working-class tenant base; expect higher turnover. Strengths: cost of living A+, housing A+; Watch: health & safety C-, crime F, amenities F.
- Crosbyton CISD (rural): math 25% / reading 30% proficiency, ranked #1,055 of 1,141 in TX (top 92%) — low school quality limits family demand, transient renter base, plan for 1-2y turnover; 65% free/reduced lunch — lower-income household profile, screen leases tightly.
- Zoned schools: Crosbyton El (math 15% / reading 24%).
- Market conditions: 16 active listings in the ZIP.
Forward outlook
- In year one you build about $13k of equity ($958 loan paydown + $12k appreciation (8.7% local appreciation)).
- Crosby County population projected at -19% by 2050 — secular population decline; favor cash flow + early exit over multi-decade hold.
- By year 3, paydown + projected appreciation supports a ~$33k cash-out refi (75% LTV) — recoverable capital for the next deal without selling this one.
Negotiation context
- It's been on market 58 days — a 3% lower offer ($134k) is reasonable based on typical stale-listing flexibility.
Risks & watch-outs
- Watch-outs: built in 1950 — expect roof / HVAC / electrical / plumbing capex.
Questions for the listing agent
- What do current leases actually rent for vs. the listed asking? Can we see a recent rent roll and the last 12 months of T-12 income?
- It's been on market 58 days. Have you received any prior offers? Is the seller open to a 28% concession, seller financing, or rate buy-down credit?
- Built in 1950 — when were the roof, HVAC, electrical panel, plumbing, and water heater last replaced?
- Is there a deadline driving the sale (1031 exchange, divorce, estate, relocation)? That informs how much negotiation room exists.
- Schools are F-rated, which usually means shorter tenancies and higher turnover. Who's the typical renter profile here, and what's been the actual vacancy rate?
- Crime grade is F in this area — have there been break-ins, vandalism, or insurance claims at this property in the last 3 years? What carrier currently insures it and at what premium?
- The area grade is low — what's the realistic commute time and amenity access for the typical tenant pool here? Any planned neighborhood developments (good or bad) we should know about?
- What's the average days-on-market for RENTAL listings here right now (not sales)? A rising rental-DOM trend means longer vacancies and softer asking-rent achievability than the comps imply.
- What's the recent tenant-quality profile in this submarket — average credit score on applications, eviction rate, late-payment / NSF rate, and stable-employment percentage? A property-management company in the area should have these aggregated.
- How much new for-sale + rental construction is in the pipeline within 1–3 miles? Heavy new supply typically softens prices + rents 12–24 months out; constrained supply supports both.
Investment metrics
- 1% rule
- 0.72% ✗
- Cap rate
- 4.72%
- Cash-on-cash
- -5.63%
- DSCR
- 0.75
- GRM
- 11.6
CMA / ARV
No comps found within radius.
Projected returns pro-forma
8.72% appreciation · 3.0% rent growth · sell at horizon
- IRR
- 17.4%
- Equity multiple
- 2.34×
- Total profit
- $51,924
- Equity at exit
- $112,069
- IRR
- 16.5%
- Equity multiple
- 5.12×
- Total profit
- $159,866
- Equity at exit
- $229,325
Cash invested: $38,780 (down + closing). Projections, not guarantees.
Landlord ↔ Tenant lean methodology
- Overall (STATE)
- 87 Strongly Landlord-Friendly
- State Texas
- 87 Strongly Landlord-Friendly · R+5
- County
- — inherits STATE
- City
- — inherits STATE
ZIP-level market 79322
- Home prices YoY
- 8.3%
- Active inventory
- 16
- Price-to-rent
- 11.6×
Monthly cashflow live
- Estimated rent
- $998 medium interval (Pro) →
- Mortgage (P&I)
- −$726
- Tax from tax record
- −$187 /mo · $2,240/yr
- Insurance
- −$58
- HOA
- −$0
- Vacancy / Maint / Mgmt
- −$210
- Net cashflow
- $-182
Break-even live
Sensitivity live
| Price | -10% $-104 | -5% $-143 | +0% $-182 | +5% $-221 | +10% $-260 |
|---|---|---|---|---|---|
| Rent | -10% $-261 | -5% $-221 | +0% $-182 | +5% $-143 | +10% $-103 |
| Rate | -1.0pp $-112 | -0.5pp $-147 | base $-182 | +0.5pp $-218 | +1.0pp $-254 |
UW: 25.0% down · 7.5% · 30yr · 1.5% tax · 5.0% vac · 8.0% maint · 8.0% mgmt
Financing live
Cash to close
- Down payment
- $34,625
- Closing costs
- $4,155
- Reserves months
- —
- Total cash needed
- —
Loan-product check · same deal, 3 products live
Conventional
25% down · 7.5% · 30yr
- Down + closing
- —
- Monthly P&I
- —
- Monthly cashflow
- —
- DSCR
- —
- Eligible?
- —
Personal DTI + credit; lowest rate.
DSCR
20% down · 8.5% · 30yr
- Down + closing
- —
- Monthly P&I
- —
- Monthly cashflow
- —
- DSCR
- —
- Eligible?
- —
No personal income docs; deal must DSCR.
Hard money
10% down · 12.0% · 12mo
- Down + closing
- —
- Monthly P&I
- —
- Monthly cashflow
- —
- DSCR
- —
- Eligible?
- —
Short-term bridge; refi at stabilization.
Listing history 21 events
-
2026-06-21days on market $138,500 Active 58 DOM
-
2026-06-21days on market $138,500 Active 57 DOM
-
2026-06-18days on market $138,500 Active 55 DOM
-
2026-06-17days on market $138,500 Active 54 DOM
-
2026-06-16days on market $138,500 Active 53 DOM
-
2026-06-15days on market $138,500 Active 52 DOM
-
2026-06-13days on market $138,500 Active 50 DOM
-
2026-06-12days on market $138,500 Active 49 DOM
-
2026-06-09days on market $138,500 Active 46 DOM
-
2026-06-08days on market $138,500 Active 45 DOM
-
2026-06-08days on market $138,500 Active 44 DOM
-
2026-06-05days on market $138,500 Active 42 DOM
-
2026-06-03days on market $138,500 Active 40 DOM
-
2026-06-02days on market $138,500 Active 39 DOM
-
2026-06-01days on market $138,500 Active 38 DOM
-
2026-05-31days on market $138,500 Active 37 DOM
-
2026-04-24$138,500 Active 1286-char remark
-
2024-12-26soldstatus
-
2021-06-15soldstatus
-
2019-01-03soldstatus
-
2014-03-05soldstatus
ⓘ Source: listings_history table (triggers on properties + properties_extension) + one-shot
backfill from property_details.listing_events for pre-trigger history.
Tax reassessment forecast TX · Resets to sale price
- Current annual tax
- $2,240 · $187/mo
- Projected year-2 tax
- $2,535 · $211/mo
- Expected delta
- +$294/yr (+$25/mo · 13.1%)
ⓘ Screening estimate from a state-policy table — verify with the county assessor before closing.
Nearby sold comps map
Loading sold comps map…
Walkable amenities ~0.75 mi
Loading nearby amenities…
Taxation est. · year 1
- Rental income
- $11,981
- − Mortgage interest
- −$7,758
- − Property taxes
- −$2,240
- − Insurance
- −$692
- − Repairs & maintenance
- −$958
- − Management
- −$958
- − Depreciation
- −$4,029
- Taxable loss
- −$4,656
- Est. tax savings @ 24.0%
- +$1,117
- After-tax cash flow
- $-1,066/yr
For passive investors: Depreciation is non-cash, so a rental often shows a tax loss while cash-flowing — sheltering income. Rental losses are passive: they offset passive income freely, and up to $25,000/yr can offset ordinary (W-2) income if you actively participate and your MAGI is under $100k (phasing out to $0 by $150k); unused losses carry forward. On sale, claimed depreciation is recaptured at up to 25%, and gains may owe capital-gains tax (a 1031 exchange can defer both). Figures are a year-1 estimate at your 24.0% rate — not tax advice; consult a CPA.
Schools (NCES district)
- District
- Crosbyton CISD
- NCES district ID
- 4800001
- Math proficiency
- 25% ▼ -1.00%
- Reading proficiency
- 30% ▲ 5.00%
- Median HH income
- $37,076
- Composite
- 25.82/100
- National rank
- #12789
- State rank
- #1055 of 1141 in TX
Livability — Crosbyton
- Score
- 59/100
- State rank
- #1147
- US rank
- #20185
Category grades
Schools grade is shown separately in the Schools card above.
Census & demographics
- Census place
- Crosbyton, TX
- Population (ZIP)
- 1,945
Population outlook (Crosby County) Hauer SSP2
- Today (2025)
- 5,795 people
- By 2030
- 5,626 · -2.9%
- By 2040
- 5,198 · -10.3%
- By 2050
- 4,696 · -19.0%
- By 2075
- 3,250 · -43.9%
- By 2100
- 2,123 · -63.4%
Race, ethnicity, and origin ACS 2023
- Neighborhood character
- Majority Hispanic (63%)
- Race & ethnicity
- Hispanic / Latino 63% White 34% Two or more races 16% Black 1%
- Hispanic origin (detail)
- Mexican 59%
- Common ancestry
- Italian 4% Serbian 4% Iranian 3%
- Foreign-born
- 6% · Canada
- Languages at home
- 60% English-only · Spanish 39% Other Asian/Pacific 1%
Political lean MEDSL · Crosby
- 2024 margin
- Solid R (+51.3) · D 24.0% · R 75.3%
- 2008→2024 swing
- -23.3pp toward R · 2008: -28.1pp · 2024: -51.3pp
- All cycles
- 2024: R+51.3 2020: R+44.5 2016: R+41.6 2012: R+27.6 2008: R+28.1
Not yet ingested
- Civics
- —
Market trends
- HPI YoY
- ▲ 8.72%
- Current HPI
- 114.2754
- Rent YoY
- —
- Metro
- —
- State GDP YoY
- ▲ 3.95%
- F500 in state
- 110
Industry mix (Fortune 500 HQ in TX)
| Industry | F500 HQs | Revenue |
|---|---|---|
| Energy | 16 | $1,198B |
|
||
| Technology | 5 | $198B |
|
||
| Engineering / Construction | 4 | $72B |
|
||
| Energy Services | 3 | $60B |
|
||
| Utilities | 3 | $41B |
|
||
| Healthcare | 2 | $330B |
|
||
Price history
5 events — show timeline
- 2026-04-24 Listed $138,500 LARMLS
- 2024-12-26 Sold (Public Records) — Public Records
- 2021-06-15 Sold (Public Records) — Public Records
- 2019-01-03 Sold (Public Records) — Public Records
- 2014-03-05 Sold (Public Records) — Public Records
Property tax history
+7.7%/yrLatest (2025): $2,240 · +46.2% YoY. Source: county tax records.
Cash-flow waterfall
monthlySold comps — $/sqft
last 12 mo · ≤1 miLoading sold comps…