221 Holly Hill Dr · Rogersville, TN
Flood risk 1/10 · Minimal
- FEMA flood zone
- X (unshaded)
- Chance of flooding over 30 yrs
- 0.0%
- Est. flood insurance / yr
- $507 – $1,088
Fire risk 5/10 · Moderate
- Est. fire insurance / yr
- $949 – $1,763
Heat risk 5/10 · Moderate
- Hot days now (above 102°F)
- 7 days/yr
- Hot days in 30 yrs
- 21 days/yr
Wind risk 2/10 · Minimal
- Chance of severe wind over 30 yrs
- —
Air-quality risk 3/10 · Minor
- Unhealthy air days now
- 2 days/yr
- Unhealthy air days in 30 yrs
- 3 days/yr
Risk factors via First Street. Map © Google.
Why this score? — see what drove the B grade
The composite is a weighted blend of 9 inputs, each scored 0–100. Each bar is that input's sub-score; the figure is the points it added to the 100-point composite (weight × sub-score).
- Cash flow +30.0/30.0
- 1% rule +10.0/10.0
- DSCR +10.0/10.0
- ARV discount +7.5/15.0
- Appreciation +6.8/10.0
- Livability +3.2/5.0
- Rent growth +2.5/5.0
- Condition / age +2.5/5.0
- Schools +2.0/10.0
$48,000
🖨 Deal sheet (PDF) 📄 Offer letter ✓ Due diligence
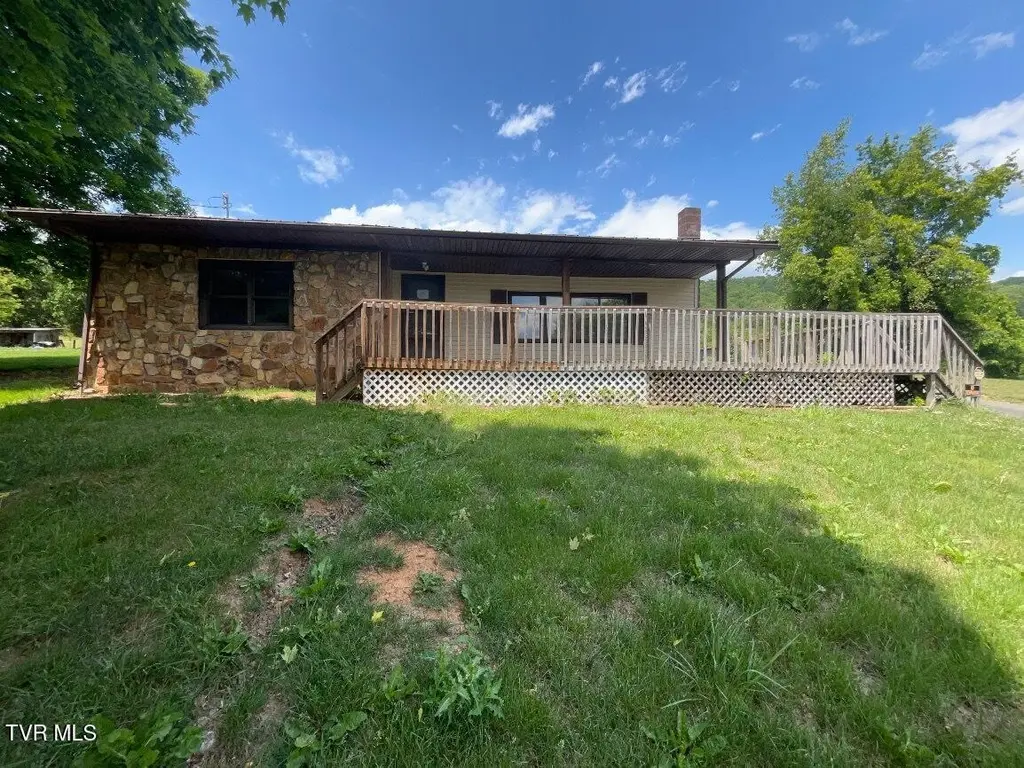
Listing remarks
Ranch style house built in 1950. Convenient location just a couple miles to the Historic Town of Rogersville. Potential here at a great price. ''Due to condition, the property may have health/safety risk(s). Prior to entry / access, all parties must sign a Hold Harmless Agreement, and the property may only be shown by appointment''.
Key facts
- 0.48 acre lot
- Built 1950
- Listed 7 days
Property features AI
Exterior
- Utilities: Public water available; Septic tank sewer; Electricity connected
- Home design: Single-family house; Fixer condition
- Construction: Stone and vinyl siding exterior; Metal roof
- Exterior features: Deck; Shed(s); Sloped lot; Residential zoning
Interior
- Bathrooms: One full bathroom
- Heating & cooling: Heat pump heating; Heat pump cooling
- Interior features: Insulated windows; Five total rooms
Neighborhood map
What this means for you Summary
Snapshot
- This is a 3-bed/1.0-bath single-family listed at $48k.
Deal economics
- At list price, monthly cash flow is $398 ($5k/yr) — positive.
- The deal already cash-flows at list — no discount required.
- Meets the 1% rule at list price ($907 rent vs $48k).
- Cap rate 16.3% vs local median 2.8% in Rogersville — top-decile yield for the area; either an underpriced asset or a hidden risk that comps aren't pricing in. Stress-test before assuming the spread holds.
Location & tenants
- Location reads 64/100 on livability (#168 in TN) — a middle-class / working-renter tenant base. Strengths: cost of living A+, housing A+, crime B+; Watch: amenities F, commute F, employment F.
- Hawkins County (rural): math 23% / reading 26% proficiency, ranked #93 of 139 in TN (top 67%) — low school quality limits family demand, transient renter base, plan for 1-2y turnover.
- Zoned schools: Hawkins Elementary (math 22% / reading 21%, grade F, #630 of 952 statewide, top 66%, 290 students, 0% FRL); Rogersville Middle School (math 15% / reading 16%, grade F, #229 of 333 statewide, top 69%, 382 students, 0% FRL); Cherokee High School (math 17% / reading 36%, grade F, #112 of 332 statewide, top 35%, 1,055 students, 0% FRL) — zoned schools average 0% FRL vs 57% district-wide (57 pts lower); this property's tenant base skews higher-income than the district average.
- Market conditions: 209 active listings in the ZIP; 3 comparable units currently listed for rent nearby; rentals lingering (median 45d on market — plan ~5-8 weeks vacancy on turnover, expect pricing pressure); 67% of comp listings sitting > 30 days — soft ceiling on asking rent; 151 units permitted in Hawkins County in 2024 (0 in 5+ unit buildings).
Forward outlook
- In year one you build about $2k of equity ($332 loan paydown + $2k appreciation (3.6% local appreciation)).
- Hawkins County population projected at -17% by 2050 — secular population decline; favor cash flow + early exit over multi-decade hold.
- At projected returns (3.6% appreciation + 3.0% rent growth), your $13k cash investment doubles in ~2 years — after that, you're playing with house money.
Negotiation context
- Only 7 days on market — expect competitive offers; lowballing is unlikely to land.
Risks & watch-outs
- Watch-outs: built in 1950 — expect roof / HVAC / electrical / plumbing capex.
- Climate carrying-cost: moderate wildfire risk; extreme-heat days projected 7→21/yr by 2055 (HVAC capex compounding) — expect insurance premiums to compound above CPI over the hold.
Questions for the listing agent
- Built in 1950 — when were the roof, HVAC, electrical panel, plumbing, and water heater last replaced?
- Is there a deadline driving the sale (1031 exchange, divorce, estate, relocation)? That informs how much negotiation room exists.
- Schools are F-rated, which usually means shorter tenancies and higher turnover. Who's the typical renter profile here, and what's been the actual vacancy rate?
- What's the average days-on-market for RENTAL listings here right now (not sales)? A rising rental-DOM trend means longer vacancies and softer asking-rent achievability than the comps imply.
- What's the recent tenant-quality profile in this submarket — average credit score on applications, eviction rate, late-payment / NSF rate, and stable-employment percentage? A property-management company in the area should have these aggregated.
- How much new for-sale + rental construction is in the pipeline within 1–3 miles? Heavy new supply typically softens prices + rents 12–24 months out; constrained supply supports both.
Investment metrics
- 1% rule
- 1.89% ✓
- Cap rate
- 16.25%
- Cash-on-cash
- 35.57%
- DSCR
- 2.58
- GRM
- 4.4
CMA / ARV
- ARV (median comp)
- $241,199
- List price
- $48,000
- Delta
- -80.10%
- Verdict
- UNDERPRICED
- Comps
- 12 within 1.0 mi
Show comp detail 3 sales within ~0.75 mi
| Address | Dist | Beds/Ba | Sqft | Sold | Price | $/sf | Match |
|---|---|---|---|---|---|---|---|
| 307 Western Heights Dr | 0.45mi | 3/1.0 | 1,040 (-1%) | 10mo | $184,150 | $177 | 69 |
| 309 Western Heights Dr | 0.47mi | 3/1.5 | 1,160 (+10%) | 8mo | $249,500 | $215 | 52 |
| 218 Livesay Cir | 0.41mi | 3/2.0 | 1,196 (+14%) | 13mo | $262,000 | $219 | 43 |
Match score weights: distance 35% · size 25% · config 20% · recency 20%. Top-matched comps best support the ARV.
Projected returns pro-forma
3.64% appreciation · 3.0% rent growth · sell at horizon
- IRR
- 42.2%
- Equity multiple
- 3.44×
- Total profit
- $32,800
- Equity at exit
- $23,324
- IRR
- 41.4%
- Equity multiple
- 6.90×
- Total profit
- $79,244
- Equity at exit
- $37,362
Cash invested: $13,440 (down + closing). Projections, not guarantees.
Landlord ↔ Tenant lean methodology
- Overall (STATE)
- 87 Strongly Landlord-Friendly
- State Tennessee
- 87 Strongly Landlord-Friendly · R+13
- County
- — inherits STATE
- City
- — inherits STATE
ZIP-level market 37857
- Home prices YoY
- 1.1%
- Active inventory
- 209
- Price-to-rent
- 4.4×
Monthly cashflow live
- Estimated rent
- $907 medium interval (Pro) →
- Mortgage (P&I)
- −$252
- Tax from tax record
- −$47 /mo · $559/yr
- Insurance
- −$20
- HOA
- −$0
- Vacancy / Maint / Mgmt
- −$191
- Net cashflow
- $398
Break-even live
Sensitivity live
| Price | -10% $426 | -5% $412 | +0% $398 | +5% $385 | +10% $371 |
|---|---|---|---|---|---|
| Rent | -10% $327 | -5% $363 | +0% $398 | +5% $434 | +10% $470 |
| Rate | -1.0pp $423 | -0.5pp $411 | base $398 | +0.5pp $386 | +1.0pp $373 |
UW: 25.0% down · 7.5% · 30yr · 1.5% tax · 5.0% vac · 8.0% maint · 8.0% mgmt
Financing live
Cash to close
- Down payment
- $12,000
- Closing costs
- $1,440
- Reserves months
- —
- Total cash needed
- —
Loan-product check · same deal, 3 products live
Conventional
25% down · 7.5% · 30yr
- Down + closing
- —
- Monthly P&I
- —
- Monthly cashflow
- —
- DSCR
- —
- Eligible?
- —
Personal DTI + credit; lowest rate.
DSCR
20% down · 8.5% · 30yr
- Down + closing
- —
- Monthly P&I
- —
- Monthly cashflow
- —
- DSCR
- —
- Eligible?
- —
No personal income docs; deal must DSCR.
Hard money
10% down · 12.0% · 12mo
- Down + closing
- —
- Monthly P&I
- —
- Monthly cashflow
- —
- DSCR
- —
- Eligible?
- —
Short-term bridge; refi at stabilization.
Rent comps 3 comps
| Address | Beds | Baths | Sqft | Rent | $/sqft | DOM | Units | Dist |
|---|---|---|---|---|---|---|---|---|
| 200 Arrowhead Dr Rogersville, TN | 1.0–2.0 | 1.0 | 816 | $886 | $1.09 | 22d | 1 | 0.50mi |
| 211 Dodge Dr Apt C2 Rogersville, TN | 2.0 | 1.0 | 780 | $910 | $1.17 | 44d | 1 | 0.99mi |
| 303 Farside Dr Unit 5 Rogersville, TN | 2.0 | 1.0 | 790 | $950 | $1.20 | 44d | 1 | 1.03mi |
Listing history 2 events
-
2026-05-14$48,000 Active 334-char remark
-
2018-12-28soldstatus $55,000
ⓘ Source: listings_history table (triggers on properties + properties_extension) + one-shot
backfill from property_details.listing_events for pre-trigger history.
Tax reassessment forecast TN · Resets to sale price
- Current annual tax
- $559 · $47/mo
- Projected year-2 tax
- $559 · $47/mo
- Expected delta
- $0/yr ($0/mo · 0.0%)
ⓘ Screening estimate from a state-policy table — verify with the county assessor before closing.
Climate risk First Street
- Flood 1/10 Low FEMA zone X (unshaded) · 0% chance over 30 yrs
- Wildfire 5/10 Major
- Heat 5/10 Major 7 d/yr ≥102°F today · 21 d/yr by 30 yrs out
- Wind 2/10 Low
- Air quality 3/10 Moderate 2 unhealthy d/yr today · 3 by 30 yrs out
Nearby sold comps map
Loading sold comps map…
Walkable amenities ~0.75 mi
Loading nearby amenities…
Taxation est. · year 1
- Rental income
- $10,887
- − Mortgage interest
- −$2,689
- − Property taxes
- −$559
- − Insurance
- −$240
- − Repairs & maintenance
- −$871
- − Management
- −$871
- − Depreciation
- −$1,396
- Taxable income
- $4,261
- Est. tax owed @ 24.0%
- −$1,023
- After-tax cash flow
- $3,758/yr
For passive investors: Depreciation is non-cash, so a rental often shows a tax loss while cash-flowing — sheltering income. Rental losses are passive: they offset passive income freely, and up to $25,000/yr can offset ordinary (W-2) income if you actively participate and your MAGI is under $100k (phasing out to $0 by $150k); unused losses carry forward. On sale, claimed depreciation is recaptured at up to 25%, and gains may owe capital-gains tax (a 1031 exchange can defer both). Figures are a year-1 estimate at your 24.0% rate — not tax advice; consult a CPA.
Schools (NCES district)
- District
- Hawkins County
- NCES district ID
- 4701740
- Math proficiency
- 23% ▼ -9.00%
- Reading proficiency
- 26% ▼ -6.00%
- Median HH income
- $37,555
- Composite
- 20.45/100
- National rank
- #8581
- State rank
- #93 of 139 in TN
Livability — Rogersville
- Score
- 64/100
- State rank
- #168
- US rank
- #14424
Category grades
Schools grade is shown separately in the Schools card above.
Census & demographics
- Population (ZIP)
- 20,425
Population outlook (Hawkins County) Hauer SSP2
- Today (2025)
- 55,226 people
- By 2030
- 53,784 · -2.6%
- By 2040
- 50,015 · -9.4%
- By 2050
- 45,682 · -17.3%
- By 2075
- 36,211 · -34.4%
- By 2100
- 26,536 · -52.0%
Race, ethnicity, and origin ACS 2023
- Neighborhood character
- Predominantly White (94%)
- Race & ethnicity
- White 94% Two or more races 4% Black 2% Hispanic / Latino 2%
- Common ancestry
- Serbian 2% Italian 1% Slovak 1%
- Foreign-born
- 2% · Canada
- Languages at home
- 98% English-only · Spanish 2%
Political lean MEDSL · Hawkins
- 2024 margin
- Solid R (+68.8) · D 15.2% · R 84.0%
- 2008→2024 swing
- -26.9pp toward R · 2008: -42.0pp · 2024: -68.8pp
- All cycles
- 2024: R+68.8 2020: R+65.8 2016: R+63.4 2012: R+47.0 2008: R+42.0
Not yet ingested
- Civics
- —
Market trends
- HPI YoY
- ▲ 3.64%
- Current HPI
- 331.2027
- Rent YoY
- —
- Metro
- —
- State GDP YoY
- ▲ 2.78%
- F500 in state
- 22
Industry mix (Fortune 500 HQ in TN)
| Industry | F500 HQs | Revenue |
|---|---|---|
| Healthcare | 3 | $91B |
|
||
| Retail | 3 | $72B |
|
||
| Transportation / Logistics | 1 | $88B |
|
||
| Paper / Packaging | 1 | $19B |
|
||
| Insurance | 1 | $13B |
|
||
| Energy | 1 | $12B |
|
||
Price history
-12.7% since first listed3 events — show timeline
- 2026-05-21 Pending — TVRMLS
- 2026-05-14 Listed $48,000 TVRMLS
- 2018-12-28 Sold (Public Records) $55,000 Public Records
Property tax history
+1.3%/yrLatest (2025): $559 · +0.0% YoY. Source: county tax records.
Cash-flow waterfall
monthlySold comps — $/sqft
last 12 mo · ≤1 miLoading sold comps…