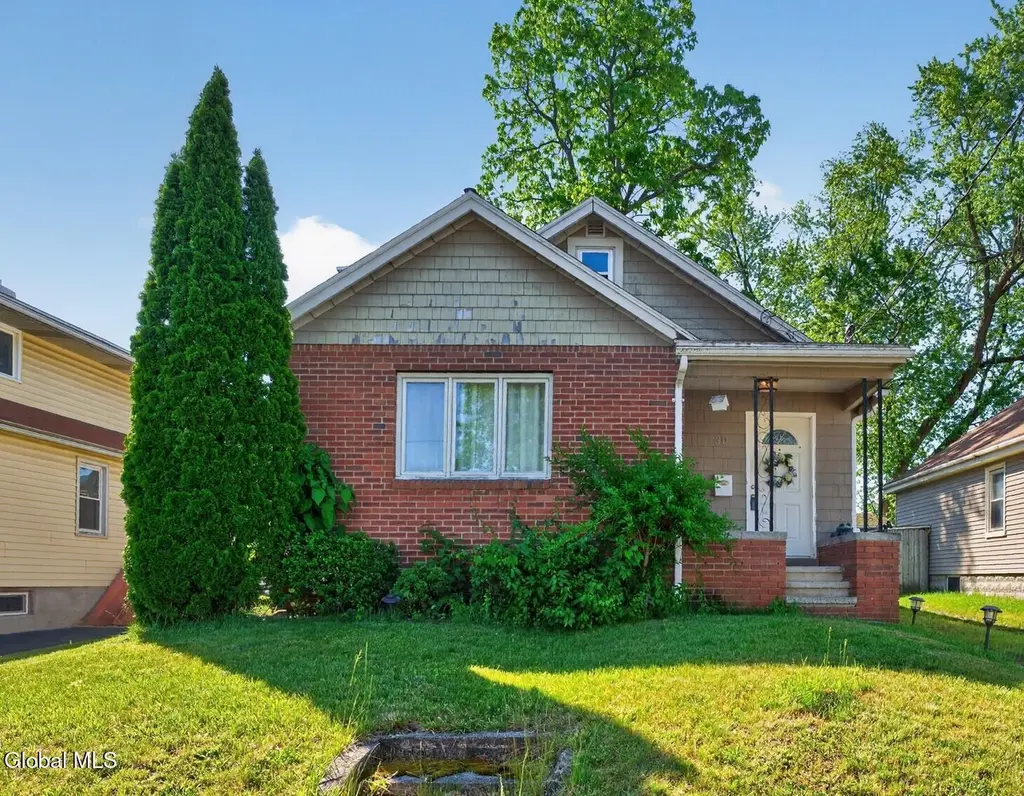
30 Fern Ave · Colonie, NY
Flood risk 1/10 · Minimal
- FEMA flood zone
- X (unshaded)
- Chance of flooding over 30 yrs
- 0.0%
- Est. flood insurance / yr
- $473 – $860
Fire risk 2/10 · Minimal
- Est. fire insurance / yr
- $691 – $1,283
Heat risk 4/10 · Minor
- Hot days now (above 96°F)
- 7 days/yr
- Hot days in 30 yrs
- 17 days/yr
Wind risk 3/10 · Minor
- Chance of severe wind over 30 yrs
- 6.0%
Air-quality risk 1/10 · Minimal
- Unhealthy air days now
- 0 days/yr
- Unhealthy air days in 30 yrs
- 0 days/yr
Risk factors via First Street. Map © Google.
Why this score? — see what drove the B grade
The composite is a weighted blend of 9 inputs, each scored 0–100. Each bar is that input's sub-score; the figure is the points it added to the 100-point composite (weight × sub-score).
- Cash flow +26.2/30.0
- ARV discount +15.0/15.0
- DSCR +8.9/10.0
- 1% rule +7.3/10.0
- Schools +5.3/10.0
- Livability +4.2/5.0
- Rent growth +2.5/5.0
- Condition / age +2.5/5.0
- Appreciation +0.0/10.0
$193,000
🖨 Deal sheet (PDF) 📄 Offer letter ✓ Due diligence
Listing remarks MLS
HUD DEAL -- Fair Condition
Key facts
- 4,356 sq ft lot
- Garage
- Built 1940
Property features AI
Exterior
- Parking: Detached garage; Space for 4 vehicles total (1 garage space)
- Utilities: 150 Amp electric service; Public water; Public sewer
- Home design: Single family residence; Facing direction not specified
- Construction: Brick, shingle siding and wood siding exterior; Asphalt roof
- Exterior features: Porch; Level lot
Interior
- Kitchen: Oven; Range; Refrigerator
- Bedrooms: One bedroom on the first floor; Two bedrooms on the second floor
- Flooring: Hardwood; Laminate
- Bathrooms: One full bathroom on the first floor
- Heating & cooling: Forced air heating; Natural gas heating
- Interior features: 7 total rooms; Full basement
- Laundry & utility: Washer and dryer in basement
Neighborhood map
What this means for you Summary
Snapshot
- This is a 3-bed/1.0-bath single-family listed at $193k.
Deal economics
- At list price, monthly cash flow is $495 ($6k/yr) — positive.
- The deal already cash-flows at list — no discount required.
- Meets the 1% rule at list price ($2k rent vs $193k).
- Cap rate 9.4% vs local median 4.8% in Colonie — top-decile yield for the area; either an underpriced asset or a hidden risk that comps aren't pricing in. Stress-test before assuming the spread holds.
Location & tenants
- Location reads 85/100 on livability (#37 in NY, #572 nationally) — a professional / high-income tenant draw. Strengths: commute A+, employment A+, housing A+; Watch: crime C-, amenities C-, cost of living D.
- South Colonie Central School District (suburban): math 63% / reading 57% proficiency, ranked #215 of 590 in NY (top 36%) — acceptable for families but not a draw, mixed tenant base, ~2y average lease; only 19% free/reduced lunch — higher-income household profile.
- Zoned schools: Veeder Elementary School (math 67% / reading 62%, grade B, #591 of 2,108 statewide, top 31%, 436 students, 32% FRL); Lisha Kill Middle School (math 44% / reading 55%, grade C, #280 of 729 statewide, top 40%, 628 students, 33% FRL); Colonie Central High School (math 96% / reading 72%, grade A, #404 of 1,100 statewide, top 37%, 1,538 students, 39% FRL) — zoned schools average 35% FRL vs 19% district-wide (16 pts higher); higher-poverty schools than district average — tighter screening recommended.
- Market conditions: 105 active listings in the ZIP; solid renter incomes; 675 units permitted in Albany County in 2024 (451 in 5+ unit buildings).
- This rent runs 31% of the median local income ($91k/yr) — at the standard rent-burdened threshold; future hikes will face affordability resistance.
Forward outlook
- Local home prices are declining (-3.0%/yr); year-one equity from $1k of loan paydown is wiped out by about $6k of value loss. Plan a longer hold.
- Albany County population projected at +9% by 2050 — modest demand growth; plan on rents tracking national, not racing it.
- At projected returns (-3.0% appreciation + 3.0% rent growth), your $54k cash investment doubles in ~10 years — after that, you're playing with house money.
Negotiation context
- Only 3 days on market — expect competitive offers; lowballing is unlikely to land.
- 3 sale attempts since 25y ago with the ask held roughly flat each time — persistent listings suggest the price (not the market) is what's stuck; bring a comps-based counter.
- Current owner paid $86k; list at $193k implies a 126% gain — meaningful room to come down on a strong offer.
Risks & watch-outs
- Watch-outs: built in 1940 — expect roof / HVAC / electrical / plumbing capex.
Questions for the listing agent
- Built in 1940 — when were the roof, HVAC, electrical panel, plumbing, and water heater last replaced?
- Is there a deadline driving the sale (1031 exchange, divorce, estate, relocation)? That informs how much negotiation room exists.
- What's the average days-on-market for RENTAL listings here right now (not sales)? A rising rental-DOM trend means longer vacancies and softer asking-rent achievability than the comps imply.
- What's the recent tenant-quality profile in this submarket — average credit score on applications, eviction rate, late-payment / NSF rate, and stable-employment percentage? A property-management company in the area should have these aggregated.
- How much new for-sale + rental construction is in the pipeline within 1–3 miles? Heavy new supply typically softens prices + rents 12–24 months out; constrained supply supports both.
Investment metrics
- 1% rule
- 1.23% ✓
- Cap rate
- 9.37%
- Cash-on-cash
- 10.99%
- DSCR
- 1.49
- GRM
- 6.8
CMA / ARV
- ARV (on-the-fly)
- $333,060
- Comps found
- 12
Show comp detail 12 sales within ~0.75 mi
| Address | Dist | Beds/Ba | Sqft | Sold | Price | $/sf | Match |
|---|---|---|---|---|---|---|---|
| 5 Wilbur St | 0.24mi | 3/1.0 | 1,250 (-2%) | 9mo | $235,500 | $188 | 78 |
| 48 Tennessee Ave | 0.15mi | 2/1.5 (-1) | 1,306 (+2%) | 7mo | $227,000 | $174 | 77 |
| 4146 Albany St | 0.30mi | 3/1.5 | 1,242 (-3%) | 8mo | $280,000 | $225 | 72 |
| 59 Virginia Ave | 0.30mi | 3/1.0 | 1,280 (-0%) | 17mo | $295,000 | $230 | 72 |
| 10 Dunning Ave | 0.12mi | 3/1.5 | 1,155 (-10%) | 8mo | $330,000 | $286 | 69 |
| 59 Reber St | 0.41mi | 3/1.0 | 1,152 (-10%) | 7mo | $316,000 | $274 | 58 |
| 21 Campbell Dr | 0.40mi | 3/1.0 | 1,152 (-10%) | 8mo | $339,000 | $294 | 58 |
| 19 Maryland Ave | 0.20mi | 2/1.0 (-1) | 1,120 (-13%) | 9mo | $300,000 | $268 | 57 |
| 39 Reber St | 0.48mi | 3/2.0 | 1,152 (-10%) | 2mo | $335,000 | $291 | 56 |
| 15 Merrill St | 0.30mi | 3/2.5 | 1,440 (+12%) | 10mo | $315,000 | $219 | 51 |
| 27 Emery Ave | 0.49mi | 4/1.0 (+1) | 1,375 (+7%) | 11mo | $286,000 | $208 | 51 |
| 65 Brent St | 0.57mi | 3/2.0 | 1,344 (+5%) | 12mo | $350,000 | $260 | 51 |
Match score weights: distance 35% · size 25% · config 20% · recency 20%. Top-matched comps best support the ARV.
Projected returns pro-forma
-3.0% appreciation · 3.0% rent growth · sell at horizon
- IRR
- 0.1%
- Equity multiple
- 1.01×
- Total profit
- $303
- Equity at exit
- $28,777
- IRR
- 9.8%
- Equity multiple
- 1.76×
- Total profit
- $41,104
- Equity at exit
- $16,687
Cash invested: $54,040 (down + closing). Projections, not guarantees.
Landlord ↔ Tenant lean methodology
- Overall (STATE)
- 15 Strongly Tenant-Friendly
- State New York
- 15 Strongly Tenant-Friendly · D+10
- County
- — inherits STATE
- City
- — inherits STATE
ZIP-level market 12205
- Active inventory
- 105
- Price-to-rent
- 6.8×
Monthly cashflow live
- Estimated rent
- $2,374 medium interval (Pro) →
- Mortgage (P&I)
- −$1,012
- Tax from tax record
- −$289 /mo · $3,462/yr
- Insurance
- −$80
- HOA
- −$0
- Vacancy / Maint / Mgmt
- −$499
- Net cashflow
- $495
Break-even live
Sensitivity live
| Price | -10% $604 | -5% $549 | +0% $495 | +5% $440 | +10% $386 |
|---|---|---|---|---|---|
| Rent | -10% $307 | -5% $401 | +0% $495 | +5% $589 | +10% $682 |
| Rate | -1.0pp $592 | -0.5pp $544 | base $495 | +0.5pp $445 | +1.0pp $394 |
UW: 25.0% down · 7.5% · 30yr · 1.5% tax · 5.0% vac · 8.0% maint · 8.0% mgmt
Financing live
Cash to close
- Down payment
- $48,250
- Closing costs
- $5,790
- Reserves months
- —
- Total cash needed
- —
Loan-product check · same deal, 3 products live
Conventional
25% down · 7.5% · 30yr
- Down + closing
- —
- Monthly P&I
- —
- Monthly cashflow
- —
- DSCR
- —
- Eligible?
- —
Personal DTI + credit; lowest rate.
DSCR
20% down · 8.5% · 30yr
- Down + closing
- —
- Monthly P&I
- —
- Monthly cashflow
- —
- DSCR
- —
- Eligible?
- —
No personal income docs; deal must DSCR.
Hard money
10% down · 12.0% · 12mo
- Down + closing
- —
- Monthly P&I
- —
- Monthly cashflow
- —
- DSCR
- —
- Eligible?
- —
Short-term bridge; refi at stabilization.
Listing history 4 events
-
2026-06-15statusdays on market $193,000 Pending 3 DOM
-
2026-06-14days on market $193,000 Active 2 DOM
-
2026-06-13remarks 493-char remark
-
2026-06-13$193,000 Active 1 DOM
ⓘ Source: listings_history table (triggers on properties + properties_extension) + one-shot
backfill from property_details.listing_events for pre-trigger history.
Tax reassessment forecast NY · Partial reset (capped growth)
- Current annual tax
- $3,462 · $289/mo
- Projected year-2 tax
- $3,462 · $289/mo
- Expected delta
- $0/yr ($0/mo · 0.0%)
ⓘ Screening estimate from a state-policy table — verify with the county assessor before closing.
Climate risk First Street
- Flood 1/10 Low FEMA zone X (unshaded) · 0% chance over 30 yrs
- Wildfire 2/10 Low
- Heat 4/10 Moderate 7 d/yr ≥96°F today · 17 d/yr by 30 yrs out
- Wind 3/10 Moderate 6% chance of damaging wind over 30 yrs
- Air quality 1/10 Low 0 unhealthy d/yr today · 0 by 30 yrs out
Nearby sold comps map
Loading sold comps map…
Walkable amenities ~0.75 mi
Loading nearby amenities…
Taxation est. · year 1
- Rental income
- $28,494
- − Mortgage interest
- −$10,811
- − Property taxes
- −$3,462
- − Insurance
- −$965
- − Repairs & maintenance
- −$2,279
- − Management
- −$2,279
- − Depreciation
- −$5,615
- Taxable income
- $3,082
- Est. tax owed @ 24.0%
- −$740
- After-tax cash flow
- $5,198/yr
For passive investors: Depreciation is non-cash, so a rental often shows a tax loss while cash-flowing — sheltering income. Rental losses are passive: they offset passive income freely, and up to $25,000/yr can offset ordinary (W-2) income if you actively participate and your MAGI is under $100k (phasing out to $0 by $150k); unused losses carry forward. On sale, claimed depreciation is recaptured at up to 25%, and gains may owe capital-gains tax (a 1031 exchange can defer both). Figures are a year-1 estimate at your 24.0% rate — not tax advice; consult a CPA.
Schools (NCES district)
- District
- South Colonie Central School District
- NCES district ID
- 3627210
- Math proficiency
- 63% ▼ -1.00%
- Reading proficiency
- 57% ▲ 4.00%
- Median HH income
- $69,499
- Composite
- 52.97/100
- National rank
- #1527
- State rank
- #215 of 590 in NY
Livability — Colonie
- Score
- 85/100
- State rank
- #37
- US rank
- #572
Category grades
Schools grade is shown separately in the Schools card above.
Census & demographics
- County
- Albany County · 196,626 people
- City population
- 25,912
- Metro
- Albany-Schenectady-Troy, NY
- Population (ZIP)
- 25,838
- Household income
- $91,020
- Rent vs Own
- Severe rent burden
- 530.0
Population outlook (Albany County) Hauer SSP2
- Today (2025)
- 320,794 people
- By 2030
- 327,401 · +2.1%
- By 2040
- 338,218 · +5.4%
- By 2050
- 348,467 · +8.6%
- By 2075
- 381,693 · +19.0%
- By 2100
- 393,809 · +22.8%
Race, ethnicity, and origin ACS 2023
- Neighborhood character
- Predominantly White (73%)
- Race & ethnicity
- White 73% Asian 8% Black 8% Two or more races 6% Hispanic / Latino 5%
- Hispanic origin (detail)
- Puerto Rican 3%
- Common ancestry
- Romanian 6% Lithuanian 3% Iranian 2%
- Foreign-born
- 13% · Canada, China, Vietnam
- Languages at home
- 84% English-only · Other Indo-European 4% Russian/Polish/Slavic 3% Tagalog/Filipino 2%
Political lean MEDSL · Albany
- 2024 margin
- Strong D (+25.8) · D 62.9% · R 37.1%
- 2008→2024 swing
- -3.6pp toward R · 2008: 29.4pp · 2024: 25.8pp
- All cycles
- 2024: D+25.8 2020: D+31.4 2016: D+24.3 2012: D+31.0 2008: D+29.4
Not yet ingested
- Civics
- —
Market trends
- HPI YoY
- ▼ -182.10%
- Current HPI
- 302.9752
- Rent YoY
- —
- Metro
- Albany-Schenectady-Troy, NY
- State GDP YoY
- ▲ 2.60%
- F500 in state
- 92
Industry mix (Fortune 500 HQ in NY)
| Industry | F500 HQs | Revenue |
|---|---|---|
| Financial Services | 10 | $950B |
|
||
| Consumer Goods | 9 | $162B |
|
||
| Insurance | 4 | $225B |
|
||
| Telecommunications | 2 | $144B |
|
||
| Pharmaceuticals | 2 | $112B |
|
||
| Media / Entertainment | 2 | $69B |
|
||
Price history
+124.7% since first listed10 events — show timeline
- 2026-06-11 Listed $193,000 Global MLS
- 2004-11-26 Sold (Public Records) $85,521 Public Records
- 2004-11-11 Sold (MLS) $85,521 Global MLS
- 2004-09-08 Listing Removed — Global MLS
- 2004-07-15 Listed $65,000 Global MLS
- 2004-06-21 Sold (Public Records) $105,587 Public Records
- 2001-06-28 Sold (Public Records) $88,000 Public Records
- 2001-06-27 Sold (MLS) $88,000 Global MLS
- 2001-05-01 Listing Removed — Global MLS
- 2001-02-17 Listed $85,900 Global MLS
Property tax history
+1.4%/yrLatest (2025): $3,462 · -14.2% YoY. Source: county tax records.
Cash-flow waterfall
monthlySold comps — $/sqft
last 12 mo · ≤1 miLoading sold comps…