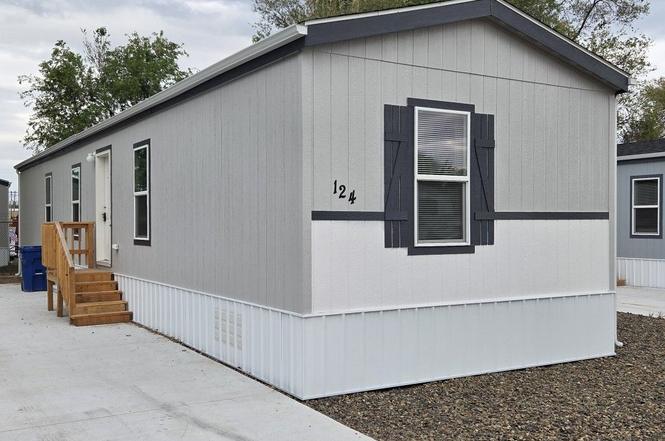
100 NW 16th St #124 · Fruitland, ID
Flood risk 1/10 · Minimal
- FEMA flood zone
- —
- Chance of flooding over 30 yrs
- 0.0%
- Est. flood insurance / yr
- —
Fire risk 1/10 · Minimal
- Est. fire insurance / yr
- $584 – $1,086
Heat risk 5/10 · Moderate
- Hot days now (above 99°F)
- 7 days/yr
- Hot days in 30 yrs
- 19 days/yr
Wind risk 1/10 · Minimal
- Chance of severe wind over 30 yrs
- —
Air-quality risk 7/10 · Major
- Unhealthy air days now
- 10 days/yr
- Unhealthy air days in 30 yrs
- 12 days/yr
Risk factors via First Street. Map © Google.
Why this score? — see what drove the C+ grade
The composite is a weighted blend of 9 inputs, each scored 0–100. Each bar is that input's sub-score; the figure is the points it added to the 100-point composite (weight × sub-score).
- Cash flow +25.7/30.0
- 1% rule +10.0/10.0
- DSCR +8.5/10.0
- ARV discount +7.5/15.0
- Livability +3.6/5.0
- Schools +3.5/10.0
- Rent growth +2.5/5.0
- Condition / age +2.5/5.0
- Appreciation +0.0/10.0
$101,900
🖨 Deal sheet 📄 Offer letter ✓ Due diligence
Key facts
- China toilets
- Built 2025
- Listed 376 days
Tags
Property features AI
Finance
- Other: List price $101,900
- HOA & community: Monthly association fee of $325
Exterior
- Home design: Spec home — Pure Series: The Pursuit
- Exterior features: Living area approximately 900
Interior
- Bedrooms: 3 bedrooms
- Bathrooms: 2 bathrooms
- Interior features: Dishwasher; Disposal; Microwave; Refrigerator
Neighborhood map
What this means for you Summary
Snapshot
- This is a 3-bed/2.0-bath single-family listed at $102k.
Deal economics
- At list price, monthly cash flow is $243 ($3k/yr) — positive.
- The deal already cash-flows at list — no discount required.
- Meets the 1% rule at list price ($2k rent vs $102k).
- Recommended offer: $90k (12.0% below list) — sets the bar for market timing.
- Cap rate 9.2% vs local median 3.0% in Fruitland — top-decile yield for the area; either an underpriced asset or a hidden risk that comps aren't pricing in. Stress-test before assuming the spread holds.
Location & tenants
- Location reads 71/100 on livability (#51 in ID) — a middle-class / working-renter tenant base. Strengths: crime A+, cost of living A+, housing A+; Watch: employment C-, schools D, amenities F.
- Fruitland District (town): math 33% / reading 50% proficiency, ranked #60 of 92 in ID (top 65%) — families likely to look elsewhere, expect single-tenant / working-renter base with shorter leases.
- Market conditions: 110 active listings in the ZIP; 1 comparable units currently listed for rent nearby; 230 units permitted in Payette County in 2024 (0 in 5+ unit buildings).
Forward outlook
- Local home prices are declining (-3.0%/yr); year-one equity from $705 of loan paydown is wiped out by about $3k of value loss. Plan a longer hold.
Negotiation context
- It's been on market 377 days — a 12% lower offer ($90k) is reasonable based on typical stale-listing flexibility.
Risks & watch-outs
- Watch-outs: HOA is 20% of rent.
- Climate carrying-cost: extreme-heat days projected 7→19/yr by 2055 (HVAC capex compounding) — expect insurance premiums to compound above CPI over the hold.
Questions for the listing agent
- It's been on market 377 days. Have you received any prior offers? Is the seller open to a 12% concession, seller financing, or rate buy-down credit?
- What does the HOA fee cover, when was the last increase, and are there any pending special assessments or reserve-fund shortfalls?
- Why hasn't it sold? Are there any deal-killer items the seller is aware of (foundation, flood, title, zoning, code violations)?
- Is there a deadline driving the sale (1031 exchange, divorce, estate, relocation)? That informs how much negotiation room exists.
- Schools are D-rated, which usually means shorter tenancies and higher turnover. Who's the typical renter profile here, and what's been the actual vacancy rate?
- What's the average days-on-market for RENTAL listings here right now (not sales)? A rising rental-DOM trend means longer vacancies and softer asking-rent achievability than the comps imply.
- What's the recent tenant-quality profile in this submarket — average credit score on applications, eviction rate, late-payment / NSF rate, and stable-employment percentage? A property-management company in the area should have these aggregated.
- How much new for-sale + rental construction is in the pipeline within 1–3 miles? Heavy new supply typically softens prices + rents 12–24 months out; constrained supply supports both.
Investment metrics
- 1% rule
- 1.58% ✓
- Cap rate
- 9.16%
- Cash-on-cash
- 10.22%
- DSCR
- 1.45
- GRM
- 5.3
CMA / ARV
- ARV (on-the-fly)
- $261,900
- Comps found
- 3
Show comp detail 3 sales within ~0.75 mi
| Address | Dist | Beds/Ba | Sqft | Sold | Price | $/sf | Match |
|---|---|---|---|---|---|---|---|
| 110 NE 14th Dr | 0.20mi | 3/1.0 | 1,031 (+15%) | 15mo | $300,000 | $291 | 50 |
| 1004 Victoria Ave | 0.66mi | 2/1.0 (-1) | 960 (+7%) | 22mo | $190,000 | $198 | 31 |
| 111 N Pennsylvania Ave | 0.74mi | 2/1.0 (-1) | 784 (-13%) | 12mo | $249,000 | $318 | 25 |
Match score weights: distance 35% · size 25% · config 20% · recency 20%. Top-matched comps best support the ARV.
Projected returns pro-forma
-3.0% appreciation · 3.0% rent growth · sell at horizon
- IRR
- -0.7%
- Equity multiple
- 0.97×
- Total profit
- $-807
- Equity at exit
- $15,194
- IRR
- 9.1%
- Equity multiple
- 1.71×
- Total profit
- $20,141
- Equity at exit
- $8,810
Cash invested: $28,532 (down + closing). Projections, not guarantees.
Landlord ↔ Tenant lean methodology
- Overall (STATE)
- 91 Strongly Landlord-Friendly
- State Idaho
- 91 Strongly Landlord-Friendly · R+18
- County
- — inherits STATE
- City
- — inherits STATE
ZIP-level market 83619
- Home prices YoY
- -30.4%
- Active inventory
- 110
- Price-to-rent
- 5.3×
Monthly cashflow live
- Estimated rent
- $1,610 medium interval (Pro) →
- Mortgage (P&I)
- −$534
- Tax est. 1.5%
- −$127 /mo · $1,528/yr
- Insurance
- −$42
- HOA
- −$325
- Vacancy / Maint / Mgmt
- −$338
- Net cashflow
- $243
Break-even live
UW: 25.0% down · 7.5% · 30yr · 1.5% tax · 5.0% vac · 8.0% maint · 8.0% mgmt
Financing live
Cash to close
- Down payment
- $25,475
- Closing costs
- $3,057
- Reserves months
- —
- Total cash needed
- —
Loan-product check · same deal, 3 products live
Conventional
25% down · 7.5% · 30yr
- Down + closing
- —
- Monthly P&I
- —
- Monthly cashflow
- —
- DSCR
- —
- Eligible?
- —
Personal DTI + credit; lowest rate.
DSCR
20% down · 8.5% · 30yr
- Down + closing
- —
- Monthly P&I
- —
- Monthly cashflow
- —
- DSCR
- —
- Eligible?
- —
No personal income docs; deal must DSCR.
Hard money
10% down · 12.0% · 12mo
- Down + closing
- —
- Monthly P&I
- —
- Monthly cashflow
- —
- DSCR
- —
- Eligible?
- —
Short-term bridge; refi at stabilization.
Rent comps 1 comps
| Address | Beds | Baths | Sqft | Rent | $/sqft | DOM | Units | Dist |
|---|---|---|---|---|---|---|---|---|
| 202 N Park Ave Apt 2 Fruitland, ID | 2.0 | 1.0 | 930 | $1,250 | $1.34 | 3d | 1 | 0.84mi |
HOA detail
- Monthly dues
- $325 · $3,900/yr
Listing history 15 events
-
2026-06-18days on market $101,900 Active 377 DOM
-
2026-06-17days on market $101,900 Active 376 DOM
-
2026-06-16days on market $101,900 Active 375 DOM
-
2026-06-15days on market $101,900 Active 374 DOM
-
2026-06-13days on market $101,900 Active 372 DOM
-
2026-06-13days on market $101,900 Active 371 DOM
-
2026-06-10days on market $101,900 Active 369 DOM
-
2026-06-09days on market $101,900 Active 368 DOM
-
2026-06-08days on market $101,900 Active 367 DOM
-
2026-06-07days on market $101,900 Active 366 DOM
-
2026-06-05days on market $101,900 Active 363 DOM
-
2026-06-03days on market $101,900 Active 362 DOM
-
2026-06-03days on market $101,900 Active 361 DOM
-
2026-06-01days on market $101,900 Active 360 DOM
-
2026-05-31days on market $101,900 Active 359 DOM
ⓘ Source: listings_history table (triggers on properties + properties_extension) + one-shot
backfill from property_details.listing_events for pre-trigger history.
Climate risk First Street
- Flood 1/10 Low 0% chance over 30 yrs
- Wildfire 1/10 Low
- Heat 5/10 Major 7 d/yr ≥99°F today · 19 d/yr by 30 yrs out
- Wind 1/10 Low
- Air quality 7/10 Severe 10 unhealthy d/yr today · 12 by 30 yrs out
Nearby sold comps map
Loading sold comps map…
Walkable amenities ~0.75 mi
Loading nearby amenities…
Taxation est. · year 1
- Rental income
- $19,326
- − Mortgage interest
- −$5,708
- − Property taxes
- −$1,528
- − Insurance
- −$510
- − Repairs & maintenance
- −$1,546
- − Management
- −$1,546
- − HOA
- −$3,900
- − Depreciation
- −$2,964
- Taxable income
- $1,623
- Est. tax owed @ 24.0%
- −$390
- After-tax cash flow
- $2,527/yr
For passive investors: Depreciation is non-cash, so a rental often shows a tax loss while cash-flowing — sheltering income. Rental losses are passive: they offset passive income freely, and up to $25,000/yr can offset ordinary (W-2) income if you actively participate and your MAGI is under $100k (phasing out to $0 by $150k); unused losses carry forward. On sale, claimed depreciation is recaptured at up to 25%, and gains may owe capital-gains tax (a 1031 exchange can defer both). Figures are a year-1 estimate at your 24.0% rate — not tax advice; consult a CPA.
Schools (NCES district)
- District
- Fruitland District
- NCES district ID
- 1601140
- Math proficiency
- 33% ▼ -8.00%
- Reading proficiency
- 50% ▼ -6.00%
- Median HH income
- $47,510
- Composite
- 35.43/100
- National rank
- #4933
- State rank
- #60 of 92 in ID
Livability — Fruitland
- Score
- 71/100
- State rank
- #51
- US rank
- #6760
Category grades
Schools grade is shown separately in the Schools card above.
Census & demographics
- Census place
- Fruitland, ID
- County
- Payette County · 19,928 people
- City population
- 8,823
- Metro
- Ontario, OR-ID
- Population (ZIP)
- 8,823
- Household income
- $66,267
- Rent vs Own
- Severe rent burden
- 211.0
Population outlook (Payette County) Hauer SSP2
- Today (2025)
- 23,392 people
- By 2030
- 23,523 · +0.6%
- By 2040
- 23,792 · +1.7%
- By 2050
- 24,002 · +2.6%
- By 2075
- 25,286 · +8.1%
- By 2100
- 26,673 · +14.0%
Race, ethnicity, and origin ACS 2023
- Neighborhood character
- Predominantly White (77%)
- Race & ethnicity
- White 77% Hispanic / Latino 18% Two or more races 12% Asian 1%
- Hispanic origin (detail)
- Mexican 17%
- Common ancestry
- Slovak 3% Scottish 3% Portuguese 2%
- Foreign-born
- 7% · Canada
- Languages at home
- 86% English-only · Spanish 14%
Political lean MEDSL · Payette
- 2024 margin
- Solid R (+62.9) · D 17.6% · R 80.4% · Other 2.0%
- 2008→2024 swing
- -21.4pp toward R · 2008: -41.5pp · 2024: -62.9pp
- All cycles
- 2024: R+62.9 2020: R+59.3 2016: R+59.9 2012: R+44.0 2008: R+41.5
Not yet ingested
- Civics
- —
Market trends
- HPI YoY
- ▼ -116.19%
- Current HPI
- 266.5112
- Rent YoY
- —
- Metro
- Ontario, OR-ID
- State GDP YoY
- ▲ 4.51%
- F500 in state
- 6
Industry mix (Fortune 500 HQ in ID)
| Industry | F500 HQs | Revenue |
|---|---|---|
| Retail | 1 | $79B |
|
||
| Technology | 1 | $25B |
|
||
| Food / Agriculture | 1 | $6B |
|
||
Cash-flow waterfall
monthlySold comps — $/sqft
last 12 mo · ≤1 miLoading sold comps…