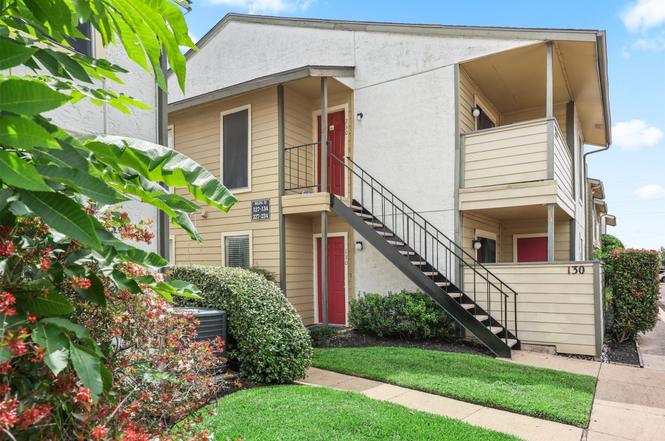
15534 Zabolio Dr #130 · Houston, TX
Flood risk 1/10 · Minimal
- FEMA flood zone
- X (unshaded)
- Chance of flooding over 30 yrs
- 0.0%
- Est. flood insurance / yr
- $507 – $1,088
Fire risk 4/10 · Minor
- Est. fire insurance / yr
- $1,222 – $2,270
Heat risk 10/10 · Severe
- Hot days now (above 107°F)
- 7 days/yr
- Hot days in 30 yrs
- 26 days/yr
Wind risk 9/10 · Severe
- Chance of severe wind over 30 yrs
- 99.0%
Air-quality risk 2/10 · Minimal
- Unhealthy air days now
- 1 days/yr
- Unhealthy air days in 30 yrs
- 1 days/yr
Risk factors via First Street. Map © Google.
Why this score? — see what drove the D grade
The composite is a weighted blend of 9 inputs, each scored 0–100. Each bar is that input's sub-score; the figure is the points it added to the 100-point composite (weight × sub-score).
- ARV discount +7.5/15.0
- 1% rule +7.1/10.0
- Cash flow +6.3/30.0
- Appreciation +5.8/10.0
- Schools +4.6/10.0
- Livability +3.7/5.0
- Rent growth +2.6/5.0
- Condition / age +2.5/5.0
- DSCR +0.6/10.0
$83,500
🖨 Deal sheet 📄 Offer letter ✓ Due diligence
Listing remarks MLS
First floor completely updated condo, in quiet Baybrook community, is ready for move-in. Unit has close parking space, and easy access to visitor parking. Kitchen updated with granite counters, replaced cabinets and replaced appliances. Bathroom has been updated, with replaced fixtures and more! A/C and heating unit have also been recently replaced by owner. Unit features tile and wood flooring and has been freshly painted on the interior. Unit features a huge walk-in closet, that a could easily share! Lovely patio area that is fenced, and features extra storage! This unit is perfect for a . Come take a look, you won't be disappointed.
Key facts
- New a/c unit
- $347 HOA
- Parking
Tags
Property features AI
Finance
- HOA & community: Baybrook Condominium Association; Monthly association fee ($250) covering clubhouse, common areas, and grounds maintenance; Community pool and clubhouse
Exterior
- Parking: Additional parking; Assigned parking
- Utilities: Public water; Public sewer
- Home design: Residential property; Single-story; Entry level: First floor
- Construction: Built in 1980; Stucco and wood siding exterior; Composition roof; Slab foundation
- Exterior features: Deck; Patio
Interior
- Kitchen: Electric cooktop; Electric oven; Electric range; Dishwasher; Garbage disposal; Microwave; Refrigerator
- Bedrooms: Primary bedroom on the first floor (13 x 12)
- Bathrooms: One full bathroom (8 x 5)
- Interior features: Granite counters; Tub with shower; Vanity; Kitchen/dining combo; One fireplace; Five total rooms
- Laundry & utility: Washer and dryer; Laundry in utility room
Neighborhood map
What this means for you Summary
Snapshot
- This is a 1-bed/1.0-bath condo listed at $84k.
Deal economics
- At list price, monthly cash flow is $-150 ($-2k/yr) — negative.
- To cash-flow at today's rent, offer at most $57k (31.7% below list).
- Meets the 1% rule at list price ($1k rent vs $84k).
- Recommended offer: $57k (31.7% below list) — sets the bar for cash-flow.
- Cap rate 4.1% vs local median 3.2% in Houston — top-decile yield for the area; either an underpriced asset or a hidden risk that comps aren't pricing in. Stress-test before assuming the spread holds.
Location & tenants
- Location reads 74/100 on livability (#184 in TX, #4,771 nationally) — a middle-class / working-renter tenant base. Strengths: amenities A+, cost of living A+, housing A+; Watch: crime F.
- Clear Creek ISD (suburban): math 48% / reading 54% proficiency, ranked #114 of 826 in TX (top 14%) — acceptable for families but not a draw, mixed tenant base, ~2y average lease.
- Zoned schools: Clear Brook H S (math 49% / reading 58%, grade C-, #428 of 1,632 statewide, top 27%, 2,347 students, 0% FRL) — zoned schools average 0% FRL vs 25% district-wide (25 pts lower); this property's tenant base skews higher-income than the district average.
- Market conditions: Rents flat; 207 active listings in the ZIP; 40 comparable units currently listed for rent nearby; rentals leasing fast (median 11d on market — plan ~1-2 weeks tenant-placement turnaround); 29,883 units permitted in Harris County in 2024 (8,621 in 5+ unit buildings).
Forward outlook
- In year one you build about $2k of equity ($577 loan paydown + $1k appreciation (1.6% local appreciation)).
- Harris County population projected at +47% by 2050 — long-run rental-demand tailwind backs the buy-and-hold thesis.
Negotiation context
- Only 9 days on market — expect competitive offers; lowballing is unlikely to land.
- 2 sale attempts since 7y ago with the ask held roughly flat each time — persistent listings suggest the price (not the market) is what's stuck; bring a comps-based counter.
Risks & watch-outs
- Watch-outs: HOA is 34% of rent.
- Climate carrying-cost: severe wind risk, 99% chance of damaging wind over 30y; extreme-heat days projected 7→26/yr by 2055 (HVAC capex compounding) — expect insurance premiums to compound above CPI over the hold.
Questions for the listing agent
- What do current leases actually rent for vs. the listed asking? Can we see a recent rent roll and the last 12 months of T-12 income?
- What does the HOA fee cover, when was the last increase, and are there any pending special assessments or reserve-fund shortfalls?
- Any open or pending special assessments — roof, HVAC, plumbing, elevator, façade? What's the per-unit balance and payoff schedule, and is the seller paying it off at close or rolling it to the buyer?
- Is there a deadline driving the sale (1031 exchange, divorce, estate, relocation)? That informs how much negotiation room exists.
- Schools are D-rated, which usually means shorter tenancies and higher turnover. Who's the typical renter profile here, and what's been the actual vacancy rate?
- Crime grade is F in this area — have there been break-ins, vandalism, or insurance claims at this property in the last 3 years? What carrier currently insures it and at what premium?
- The area grade is low — what's the realistic commute time and amenity access for the typical tenant pool here? Any planned neighborhood developments (good or bad) we should know about?
- What's the average days-on-market for RENTAL listings here right now (not sales)? A rising rental-DOM trend means longer vacancies and softer asking-rent achievability than the comps imply.
- What's the recent tenant-quality profile in this submarket — average credit score on applications, eviction rate, late-payment / NSF rate, and stable-employment percentage? A property-management company in the area should have these aggregated.
- How much new apartment / multifamily construction is in the pipeline within 1–3 miles? Heavy new supply (>2% of stock underway) typically softens rents 12–24 months out; light construction supports rent growth.
Investment metrics
- 1% rule
- 1.21% ✓
- Cap rate
- 4.14%
- Cash-on-cash
- -7.70%
- DSCR
- 0.66
- GRM
- 6.9
CMA / ARV
No comps found within radius.
Projected returns pro-forma
1.58% appreciation · 0.56% rent growth · sell at horizon
- IRR
- -6.4%
- Equity multiple
- 0.67×
- Total profit
- $-7,774
- Equity at exit
- $31,055
- IRR
- -3.0%
- Equity multiple
- 0.62×
- Total profit
- $-8,833
- Equity at exit
- $43,318
Cash invested: $23,380 (down + closing). Projections, not guarantees.
Landlord ↔ Tenant lean methodology
- Overall (STATE)
- 87 Strongly Landlord-Friendly
- State Texas
- 87 Strongly Landlord-Friendly · R+5
- County
- — inherits STATE
- City
- — inherits STATE
ZIP-level market 77598
- Home prices YoY
- 0.5%
- Rents YoY
- 0.6%
- Active inventory
- 207
- Price-to-rent
- 6.9×
Monthly cashflow live
- Estimated rent
- $1,009 high interval (Pro) →
- Mortgage (P&I)
- −$438
- Tax from tax record
- −$127 /mo · $1,529/yr
- Insurance
- −$35
- HOA
- −$347
- Vacancy / Maint / Mgmt
- −$212
- Net cashflow
- $-150
Break-even live
UW: 25.0% down · 7.5% · 30yr · 1.5% tax · 5.0% vac · 8.0% maint · 8.0% mgmt
Financing live
Cash to close
- Down payment
- $20,875
- Closing costs
- $2,505
- Reserves months
- —
- Total cash needed
- —
Loan-product check · same deal, 3 products live
Conventional
25% down · 7.5% · 30yr
- Down + closing
- —
- Monthly P&I
- —
- Monthly cashflow
- —
- DSCR
- —
- Eligible?
- —
Personal DTI + credit; lowest rate.
DSCR
20% down · 8.5% · 30yr
- Down + closing
- —
- Monthly P&I
- —
- Monthly cashflow
- —
- DSCR
- —
- Eligible?
- —
No personal income docs; deal must DSCR.
Hard money
10% down · 12.0% · 12mo
- Down + closing
- —
- Monthly P&I
- —
- Monthly cashflow
- —
- DSCR
- —
- Eligible?
- —
Short-term bridge; refi at stabilization.
Rent comps 40 comps
| Address | Beds | Baths | Sqft | Rent | $/sqft | DOM | Units | Dist |
|---|---|---|---|---|---|---|---|---|
| 265 El Dorado Blvd #324 Webster, TX | 1.0 | 1.0 | 536 | $910 | $1.70 | 7d | 1 | 0.11mi |
| 265 El Dorado Blvd Webster, TX | 1.0 | 1.0 | 536 | $899 | $1.68 | 12d | 1 | 0.11mi |
| 265 El Dorado Blvd Unit 286 Webster, TX | 1.0 | 1.0 | 536 | $945 | $1.76 | 12d | 1 | 0.11mi |
| 265 El Dorado Blvd Unit 1047 Webster, TX | 1.0 | 1.0 | 536 | $950 | $1.77 | 11d | 1 | 0.11mi |
| 265 El Dorado Blvd Unit 286 Webster, TX | 1.0 | 1.0 | 536 | $907 | $1.69 | 2d | 1 | 0.11mi |
| 265 El Dorado Blvd Unit 316 Webster, TX | 1.0 | 1.0 | 536 | $940 | $1.75 | 43d | 1 | 0.11mi |
| 428 Tresvant Dr Webster, TX | 1.0 | 1.0 | 536 | $870 | $1.62 | 43d | 1 | 0.13mi |
| 276 El Dorado Blvd Webster, TX | 1.0 | 1.0 | 622 | $1,026 | $1.65 | 43d | 1 | 0.13mi |
| 270 El Dorado Blvd Webster, TX | 1.0–2.0 | 1.0–2.0 | 773 | $895 | $1.16 | 2d | 15 | 0.13mi |
| 270 El Dorado Blvd Webster, TX | 1.0 | 1.0 | 622 | $909 | $1.46 | 17d | 1 | 0.13mi |
| 270 El Dorado Blvd Unit 321 Webster, TX | 1.0 | 1.0 | 622 | $900 | $1.45 | 43d | 1 | 0.14mi |
| 15651 Eastcape Dr Webster, TX | 1.0 | 1.0 | 552 | $995 | $1.80 | 43d | 1 | 0.22mi |
| 450 El Dorado Blvd Webster, TX | 1.0 | 1.0 | 552 | $959 | $1.74 | 12d | 1 | 0.24mi |
| 450 El Dorado Blvd Unit 471 Webster, TX | 1.0 | 1.0 | 552 | $965 | $1.75 | 12d | 1 | 0.25mi |
| 450 El Dorado Blvd Unit 501 Webster, TX | 1.0 | 1.0 | 552 | $940 | $1.70 | 43d | 1 | 0.25mi |
| 450 El Dorado Blvd Unit 1112 Webster, TX | 1.0 | 1.0 | 552 | $967 | $1.75 | 2d | 1 | 0.25mi |
| 450 El Dorado Blvd Unit 1162 Webster, TX | 1.0 | 1.0 | 552 | $970 | $1.76 | 5d | 1 | 0.25mi |
| 450 El Dorado Blvd Unit 471 Webster, TX | 1.0 | 1.0 | 552 | $1,009 | $1.83 | 10d | 1 | 0.25mi |
| 450 El Dorado Blvd Unit 324 Webster, TX | 1.0 | 1.0 | 552 | $970 | $1.76 | 7d | 1 | 0.25mi |
| 600 El Dorado Blvd Webster, TX | 1.0 | 1.0 | 750 | $1,010 | $1.35 | 24d | 1 | 0.43mi |
| 600 El Dorado Blvd Webster, TX | 1.0 | 1.0 | 750 | $1,010 | $1.35 | 7d | 1 | 0.43mi |
| 623 Barringer Ln Webster, TX | 1.0–2.0 | 1.0–2.0 | 850 | $906 | $1.07 | 1d | 24 | 0.53mi |
| 250 N Village Dr Webster, TX | 1.0 | 1.0 | 608 | $1,490 | $2.45 | 43d | 1 | 0.56mi |
| 15902 Highway 3 Webster, TX | 1.0–3.0 | 1.0–2.0 | 921 | $905 | $0.98 | 2d | 66 | 0.57mi |
| 707 El Dorado Blvd Unit 1047 Houston, TX | 1.0 | 1.0 | 650 | $824 | $1.27 | 11d | 1 | 0.58mi |
| 707 El Dorado Blvd Houston, TX | 1.0 | 1.0 | 650 | $773 | $1.19 | 12d | 1 | 0.58mi |
| 713 El Dorado Blvd Houston, TX | 1.0 | 1.0 | 650 | $1,019 | $1.57 | 43d | 1 | 0.63mi |
| 707 El Dorado Blvd Unit 781 Houston, TX | 1.0 | 1.0 | 650 | $781 | $1.20 | 2d | 1 | 0.65mi |
| 707 El Dorado Blvd Unit 1162 Houston, TX | 1.0 | 1.0 | 650 | $784 | $1.21 | 7d | 1 | 0.65mi |
| 707 El Dorado Blvd Unit 728 Houston, TX | 1.0 | 1.0 | 650 | $869 | $1.34 | 12d | 1 | 0.65mi |
| 707 El Dorado Blvd Unit 758 Houston, TX | 1.0 | 1.0 | 700 | $854 | $1.22 | 43d | 1 | 0.65mi |
| 18833 Town Ridge Ln Unit 148 Webster, TX | 1.0 | 1.0 | 560 | $1,341 | $2.39 | 2d | 1 | 0.66mi |
| 18833 Town Ridge Ln Unit 174 Webster, TX | 1.0 | 1.0 | 560 | $1,373 | $2.45 | 10d | 1 | 0.66mi |
| 18833 Town Ridge Ln Unit 321 Webster, TX | 1.0 | 1.0 | 560 | $1,416 | $2.53 | 7d | 1 | 0.66mi |
| 18833 Town Ridge Ln Unit 18848 Webster, TX | 1.0 | 1.0 | 560 | $1,455 | $2.60 | 10d | 1 | 0.66mi |
| 18833 Town Ridge Ln Unit 1162 Webster, TX | 1.0 | 1.0 | 560 | $1,416 | $2.53 | 5d | 1 | 0.66mi |
| 18833 Town Ridge Ln Unit 18875 Webster, TX | 1.0 | 1.0 | 560 | $1,374 | $2.45 | 43d | 1 | 0.66mi |
| 18833 Town Ridge Ln Unit 325 Webster, TX | 1.0 | 1.0 | 560 | $1,413 | $2.52 | 2d | 1 | 0.66mi |
| 18833 Town Ridge Ln Unit 1174 Webster, TX | 1.0 | 1.0 | 560 | $1,405 | $2.51 | 12d | 1 | 0.66mi |
| 695 Pineloch Dr Webster, TX | 1.0–2.0 | 1.0–2.0 | 836 | $882 | $1.05 | 2d | 103 | 0.73mi |
HOA detail condo
- Monthly dues
- $347 · $4,164/yr
- Assessments
- None detected in remarks — confirm with the listing agent.
Listing history 7 events
-
2026-06-18days on market $83,500 Active 9 DOM
-
2026-06-17days on market $83,500 Active 8 DOM
-
2026-06-16days on market $83,500 Active 7 DOM
-
2026-06-15days on market $83,500 Active 6 DOM
-
2026-06-13days on market $83,500 Active 4 DOM
-
2026-06-13remarks 411-char remark
-
2026-06-13$83,500 Active 3 DOM
ⓘ Source: listings_history table (triggers on properties + properties_extension) + one-shot
backfill from property_details.listing_events for pre-trigger history.
Tax reassessment forecast TX · Resets to sale price
- Current annual tax
- $1,529 · $127/mo
- Projected year-2 tax
- $1,529 · $127/mo
- Expected delta
- $0/yr ($0/mo · 0.0%)
ⓘ Screening estimate from a state-policy table — verify with the county assessor before closing.
Climate risk First Street
- Flood 1/10 Low FEMA zone X (unshaded) · 0% chance over 30 yrs
- Wildfire 4/10 Moderate
- Heat 10/10 Extreme 7 d/yr ≥107°F today · 26 d/yr by 30 yrs out
- Wind 9/10 Extreme 99% chance of damaging wind over 30 yrs
- Air quality 2/10 Low 1 unhealthy d/yr today · 1 by 30 yrs out
Nearby sold comps map
Loading sold comps map…
Walkable amenities ~0.75 mi
Loading nearby amenities…
Taxation est. · year 1
- Rental income
- $12,107
- − Mortgage interest
- −$4,677
- − Property taxes
- −$1,529
- − Insurance
- −$418
- − Repairs & maintenance
- −$969
- − Management
- −$969
- − HOA
- −$4,164
- − Depreciation
- −$2,429
- Taxable loss
- −$3,047
- Est. tax savings @ 24.0%
- +$731
- After-tax cash flow
- $-1,069/yr
For passive investors: Depreciation is non-cash, so a rental often shows a tax loss while cash-flowing — sheltering income. Rental losses are passive: they offset passive income freely, and up to $25,000/yr can offset ordinary (W-2) income if you actively participate and your MAGI is under $100k (phasing out to $0 by $150k); unused losses carry forward. On sale, claimed depreciation is recaptured at up to 25%, and gains may owe capital-gains tax (a 1031 exchange can defer both). Figures are a year-1 estimate at your 24.0% rate — not tax advice; consult a CPA.
Schools (NCES district)
- District
- Clear Creek ISD
- NCES district ID
- 4814280
- Math proficiency
- 48% ▼ -10.00%
- Reading proficiency
- 54% ▼ -4.00%
- Median HH income
- $80,240
- Composite
- 46.49/100
- National rank
- #2431
- State rank
- #114 of 826 in TX
Livability — Houston
- Score
- 74/100
- State rank
- #184
- US rank
- #4771
Category grades
Schools grade is shown separately in the Schools card above.
Census & demographics
- Census place
- Houston, TX
- County
- Harris County · 4,702,590 people
- City population
- 3,226,434
- Metro
- Houston-The Woodlands-Sugar Land, TX
- Population (ZIP)
- 26,110
- Household income
- $60,977
- Rent vs Own
- Severe rent burden
- 1983.0
Population outlook (Harris County) Hauer SSP2
- Today (2025)
- 5,571,493 people
- By 2030
- 6,089,821 · +9.3%
- By 2040
- 7,142,806 · +28.2%
- By 2050
- 8,185,864 · +46.9%
- By 2075
- 10,574,329 · +89.8%
- By 2100
- 12,109,958 · +117.4%
Race, ethnicity, and origin ACS 2023
- Neighborhood character
- Highly diverse neighborhood (Simpson 0.70)
- Race & ethnicity
- White 41% Hispanic / Latino 32% Black 14% Two or more races 13% Asian 8%
- Hispanic origin (detail)
- Mexican 18% Puerto Rican 2% Cuban 1%
- Common ancestry
- Italian 3% Lithuanian 3% Serbian 2%
- Foreign-born
- 19% · Canada, Vietnam, China
- Languages at home
- 69% English-only · Spanish 21% Vietnamese 2% Other Indo-European 2%
Political lean MEDSL · Harris
- 2024 margin
- Lean D (+5.5) · D 52.0% · R 46.4% · Other 1.6%
- 2008→2024 swing
- +3.9pp toward D · 2008: 1.6pp · 2024: 5.5pp
- All cycles
- 2024: D+5.5 2020: D+13.3 2016: D+12.4 2012: D+0.1 2008: D+1.6
Not yet ingested
- Civics
- —
Market trends
- HPI YoY
- ▲ 1.58%
- Current HPI
- 292.0815
- Rent YoY
- ▲ 0.56%
- Metro
- Houston-The Woodlands-Sugar Land, TX
- State GDP YoY
- ▲ 3.95%
- F500 in state
- 110
Industry mix (Fortune 500 HQ in TX)
| Industry | F500 HQs | Revenue |
|---|---|---|
| Energy | 16 | $1,198B |
|
||
| Technology | 5 | $198B |
|
||
| Engineering / Construction | 4 | $72B |
|
||
| Energy Services | 3 | $60B |
|
||
| Utilities | 3 | $41B |
|
||
| Healthcare | 2 | $330B |
|
||
Price history
+24.6% since first listed6 events — show timeline
- 2026-06-09 Listed $83,500 HARMLS
- 2019-09-30 Sold (Public Records) — Public Records
- 2019-09-27 Sold (MLS) — HARMLS
- 2019-09-24 Pending — HARMLS
- 2019-09-14 Pending — HARMLS
- 2019-07-13 Listed $67,000 HARMLS
Property tax history
+3.3%/yrLatest (2025): $1,529 · -10.4% YoY. Source: county tax records.
Cash-flow waterfall
monthlySold comps — $/sqft
last 12 mo · ≤1 miLoading sold comps…