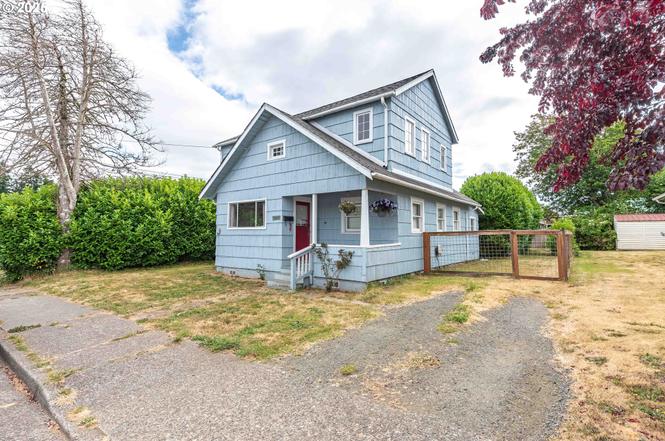
3236 Sheridan Ave · North Bend, OR
Flood risk 1/10 · Minimal
- FEMA flood zone
- X (unshaded)
- Chance of flooding over 30 yrs
- 0.0%
- Est. flood insurance / yr
- $507 – $1,088
Fire risk 1/10 · Minimal
- Est. fire insurance / yr
- $498 – $926
Heat risk 1/10 · Minimal
- Hot days now (above 76°F)
- 8 days/yr
- Hot days in 30 yrs
- 21 days/yr
Wind risk 1/10 · Minimal
- Chance of severe wind over 30 yrs
- —
Air-quality risk 6/10 · Moderate
- Unhealthy air days now
- 9 days/yr
- Unhealthy air days in 30 yrs
- 9 days/yr
Risk factors via First Street. Map © Google.
Why this score? — see what drove the C- grade
The composite is a weighted blend of 9 inputs, each scored 0–100. Each bar is that input's sub-score; the figure is the points it added to the 100-point composite (weight × sub-score).
- Cash flow +12.7/30.0
- ARV discount +11.7/15.0
- Appreciation +10.0/10.0
- DSCR +3.8/10.0
- Livability +3.6/5.0
- Schools +3.3/10.0
- 1% rule +2.5/10.0
- Rent growth +2.5/5.0
- Condition / age +2.5/5.0
$290,000
🖨 Deal sheet (PDF) 📄 Offer letter ✓ Due diligence
Listing remarks MLS
You've been looking...This is the one! Clean and classic charmer convenient to everything! On a quiet street, fresh paint, cute front porch, 3 beds/1 bath. Spacious living area, good natural light, large airy laundry room, updated bath, excellent newer Lopi natural gas stove. Some wood floors. Secure back yard with alley access and shed. Call your realtor for an appointment today!
Key facts
- Open living room
- Spacious backyard
- Close to mill casino
Tags
Neighborhood map
What this means for you Summary
Snapshot
- This is a 4-bed/1.0-bath single-family listed at $290k.
Deal economics
- At list price, monthly cash flow is $-33 ($-394/yr) — negative.
- To cash-flow at today's rent, offer at most $284k (2.0% below list).
- To meet the 1% rule (rent ≥ 1% of price), the offer needs to be $218k (24.8% below list).
- Recommended offer: $218k (24.8% below list) — sets the bar for 1% rule.
- Cap rate 6.2% vs local median 3.6% in North Bend — top-decile yield for the area; either an underpriced asset or a hidden risk that comps aren't pricing in. Stress-test before assuming the spread holds.
Location & tenants
- Location reads 72/100 on livability (#105 in OR) — a middle-class / working-renter tenant base. Strengths: housing A+, health & safety A+, cost of living B+; Watch: employment C-, amenities F, commute F.
- North Bend SD 13 (town): math 30% / reading 47% proficiency, ranked #21 of 58 in OR (top 36%) — families likely to look elsewhere, expect single-tenant / working-renter base with shorter leases.
- Zoned schools: Hillcrest Elementary School (math 47% / reading 57%, grade C-, #93 of 412 statewide, top 23%, 489 students, 68% FRL); North Bend Middle School (math 24% / reading 45%, grade F, #61 of 128 statewide, top 54%, 494 students, 68% FRL); North Bend Senior High School (math 75% / reading 75%, grade A-, #2 of 143 statewide, top 6%, 731 students, 30% FRL) — zoned schools average 55% FRL vs 40% district-wide (15 pts higher); higher-poverty schools than district average — tighter screening recommended.
- Zoned-school proficiency averages 54% at this address vs 38% district-wide (+15 pts) — the actual schools serving this property are materially stronger than the North Bend SD 13 average implies; a family-tenant draw the district grade alone would hide.
- Market conditions: 170 active listings in the ZIP; 2 comparable units currently listed for rent nearby; 122 units permitted in Coos County in 2024 (16 in 5+ unit buildings).
Forward outlook
- In year one you build about $31k of equity ($2k loan paydown + $29k appreciation (10.0% local appreciation)).
- Coos County population projected to shrink 9% by 2050 — rents likely to lag national; underwrite the cash flow, not the appreciation.
- At projected returns (10.0% appreciation + 3.0% rent growth), your $81k cash investment doubles in ~3 years — after that, you're playing with house money.
- By year 2, paydown + projected appreciation supports a ~$50k cash-out refi (75% LTV) — recoverable capital for the next deal without selling this one.
Negotiation context
- It's been on market 179 days — a 12% lower offer ($255k) is reasonable based on typical stale-listing flexibility.
- 2 sale attempts since 4y ago with the ask held roughly flat each time — persistent listings suggest the price (not the market) is what's stuck; bring a comps-based counter.
Risks & watch-outs
- Watch-outs: built in 1923 — expect roof / HVAC / electrical / plumbing capex.
Questions for the listing agent
- What do current leases actually rent for vs. the listed asking? Can we see a recent rent roll and the last 12 months of T-12 income?
- It's been on market 179 days. Have you received any prior offers? Is the seller open to a 25% concession, seller financing, or rate buy-down credit?
- Built in 1923 — when were the roof, HVAC, electrical panel, plumbing, and water heater last replaced?
- Why hasn't it sold? Are there any deal-killer items the seller is aware of (foundation, flood, title, zoning, code violations)?
- Is there a deadline driving the sale (1031 exchange, divorce, estate, relocation)? That informs how much negotiation room exists.
- Schools are B-rated — typically a magnet for longer-tenancy family renters. What's the average tenant stay here, and is there a school-zone premium baked into asking?
- What's the average days-on-market for RENTAL listings here right now (not sales)? A rising rental-DOM trend means longer vacancies and softer asking-rent achievability than the comps imply.
- What's the recent tenant-quality profile in this submarket — average credit score on applications, eviction rate, late-payment / NSF rate, and stable-employment percentage? A property-management company in the area should have these aggregated.
- How much new for-sale + rental construction is in the pipeline within 1–3 miles? Heavy new supply typically softens prices + rents 12–24 months out; constrained supply supports both.
Investment metrics
- 1% rule
- 0.75% ✗
- Cap rate
- 6.16%
- Cash-on-cash
- -0.48%
- DSCR
- 0.98
- GRM
- 11.1
CMA / ARV
- ARV (on-the-fly)
- $320,110
- Comps found
- 12
Show comp detail 12 sales within ~0.75 mi
| Address | Dist | Beds/Ba | Sqft | Sold | Price | $/sf | Match |
|---|---|---|---|---|---|---|---|
| 3236 Sheridan Ave | 0.00mi | 3/1.0 (-1) | 1,190 (0%) | 1mo | $270,000 | $227 | 94 |
| 909 State St | 0.17mi | 3/1.0 (-1) | 1,175 (-1%) | 9mo | $269,000 | $229 | 77 |
| 2650 Sheridan Ave | 0.33mi | 3/2.0 (-1) | 1,246 (+5%) | 5mo | $327,000 | $262 | 64 |
| 3863 Vista Dr | 0.60mi | 3/1.0 (-1) | 1,202 (+1%) | 4mo | $230,000 | $191 | 62 |
| 3461 Scott Ct | 0.39mi | 3/2.0 (-1) | 1,296 (+9%) | 1mo | $358,500 | $277 | 57 |
| 2435 N 10th St | 0.54mi | 3/1.0 (-1) | 1,026 (-14%) | 0mo | $125,000 | $122 | 47 |
| 2614 Union Ave | 0.37mi | 3/1.0 (-1) | 1,036 (-13%) | 12mo | $279,000 | $269 | 46 |
| 3840 Vista Dr | 0.52mi | 3/1.0 (-1) | 1,026 (-14%) | 2mo | $355,000 | $346 | 46 |
| 3797 Edgewood Dr | 0.53mi | 3/2.0 (-1) | 1,296 (+9%) | 7mo | $320,000 | $247 | 45 |
| 3551 Edgewood Dr | 0.36mi | 3/2.0 (-1) | 1,056 (-11%) | 13mo | $303,500 | $287 | 44 |
| 3775 Vista Dr | 0.45mi | 3/2.0 (-1) | 1,056 (-11%) | 12mo | $355,400 | $337 | 42 |
| 3851 Edgewood Dr | 0.56mi | 3/3.0 (-1) | 1,344 (+13%) | 2mo | $405,400 | $302 | 37 |
Match score weights: distance 35% · size 25% · config 20% · recency 20%. Top-matched comps best support the ARV.
Projected returns pro-forma
10.0% appreciation · 3.0% rent growth · sell at horizon
- IRR
- 23.9%
- Equity multiple
- 2.92×
- Total profit
- $155,733
- Equity at exit
- $261,255
- IRR
- 21.2%
- Equity multiple
- 6.67×
- Total profit
- $460,014
- Equity at exit
- $563,406
Cash invested: $81,200 (down + closing). Projections, not guarantees.
Landlord ↔ Tenant lean methodology
- Overall (STATE)
- 28 Tenant-Leaning
- State Oregon
- 28 Tenant-Leaning · D+6
- County
- — inherits STATE
- City
- — inherits STATE
ZIP-level market 97459
- Home prices YoY
- 1.6%
- Active inventory
- 170
- Price-to-rent
- 11.1×
Monthly cashflow live
- Estimated rent
- $2,182 medium interval (Pro) →
- Mortgage (P&I)
- −$1,521
- Tax from tax record
- −$115 /mo · $1,381/yr
- Insurance
- −$121
- HOA
- −$0
- Lot rent
- −$0
- Vacancy / Maint / Mgmt
- −$458
- Net cashflow
- $-33
Break-even live
Sensitivity live
| Price | -10% $131 | -5% $49 | +0% $-33 | +5% $-115 | +10% $-197 |
|---|---|---|---|---|---|
| Rent | -10% $-205 | -5% $-119 | +0% $-33 | +5% $53 | +10% $140 |
| Rate | -1.0pp $113 | -0.5pp $41 | base $-33 | +0.5pp $-108 | +1.0pp $-184 |
UW: 25.0% down · 7.5% · 30yr · 1.5% tax · 5.0% vac · 8.0% maint · 8.0% mgmt
Financing live
Cash to close
- Down payment
- $72,500
- Closing costs
- $8,700
- Reserves months
- —
- Total cash needed
- —
Loan-product check · same deal, 3 products live
Conventional
25% down · 7.5% · 30yr
- Down + closing
- —
- Monthly P&I
- —
- Monthly cashflow
- —
- DSCR
- —
- Eligible?
- —
Personal DTI + credit; lowest rate.
DSCR
20% down · 8.5% · 30yr
- Down + closing
- —
- Monthly P&I
- —
- Monthly cashflow
- —
- DSCR
- —
- Eligible?
- —
No personal income docs; deal must DSCR.
Hard money
10% down · 12.0% · 12mo
- Down + closing
- —
- Monthly P&I
- —
- Monthly cashflow
- —
- DSCR
- —
- Eligible?
- —
Short-term bridge; refi at stabilization.
Rent comps 2 comps
| Address | Beds | Baths | Sqft | Rent | $/sqft | DOM | Units | Dist |
|---|---|---|---|---|---|---|---|---|
| 510 Lombard St North Bend, OR | 3.0 | 2.0 | 1384 | $2,200 | $1.59 | 46d | 1 | 0.19mi |
| 2146 Monroe Ave Unit 2146 North Bend, OR | 3.0 | 1.5 | 1456 | $2,100 | $1.44 | 46d | 1 | 0.84mi |
Listing history 9 events
-
2026-04-28status Pending
-
2025-10-31$290,000 Active
-
2022-08-02soldstatus $260,000 Closed 383-char remark
Show marketing remark (383 chars)
You've been looking...This is the one! Clean and classic charmer convenient to everything! On a quiet street, fresh paint, cute front porch, 3 beds/1 bath. Spacious living area, good natural light, large airy laundry room, updated bath, excellent newer Lopi natural gas stove. Some wood floors. Secure back yard with alley access and shed. Call your realtor for an appointment today!
-
2022-08-02soldstatus $260,000
Show marketing remark (383 chars)
You've been looking...This is the one! Clean and classic charmer convenient to everything! On a quiet street, fresh paint, cute front porch, 3 beds/1 bath. Spacious living area, good natural light, large airy laundry room, updated bath, excellent newer Lopi natural gas stove. Some wood floors. Secure back yard with alley access and shed. Call your realtor for an appointment today!
-
2022-07-30status Pending 383-char remark
Show marketing remark (383 chars)
You've been looking...This is the one! Clean and classic charmer convenient to everything! On a quiet street, fresh paint, cute front porch, 3 beds/1 bath. Spacious living area, good natural light, large airy laundry room, updated bath, excellent newer Lopi natural gas stove. Some wood floors. Secure back yard with alley access and shed. Call your realtor for an appointment today!
-
2022-05-03status Pending 383-char remark
Show marketing remark (383 chars)
You've been looking...This is the one! Clean and classic charmer convenient to everything! On a quiet street, fresh paint, cute front porch, 3 beds/1 bath. Spacious living area, good natural light, large airy laundry room, updated bath, excellent newer Lopi natural gas stove. Some wood floors. Secure back yard with alley access and shed. Call your realtor for an appointment today!
-
2022-04-02$289,000 Active 383-char remark
Show marketing remark (383 chars)
You've been looking...This is the one! Clean and classic charmer convenient to everything! On a quiet street, fresh paint, cute front porch, 3 beds/1 bath. Spacious living area, good natural light, large airy laundry room, updated bath, excellent newer Lopi natural gas stove. Some wood floors. Secure back yard with alley access and shed. Call your realtor for an appointment today!
-
2007-08-21soldstatus $180,000
-
2004-10-27soldstatus $80,000
ⓘ Source: listings_history table (triggers on properties + properties_extension) + one-shot
backfill from property_details.listing_events for pre-trigger history.
Tax reassessment forecast OR · Resets to sale price
- Current annual tax
- $1,381 · $115/mo
- Projected year-2 tax
- $2,813 · $234/mo
- Expected delta
- +$1,432/yr (+$119/mo · 103.7%)
ⓘ Screening estimate from a state-policy table — verify with the county assessor before closing.
Climate risk First Street
- Flood 1/10 Low FEMA zone X (unshaded) · 0% chance over 30 yrs
- Wildfire 1/10 Low
- Heat 1/10 Low 8 d/yr ≥76°F today · 21 d/yr by 30 yrs out
- Wind 1/10 Low
- Air quality 6/10 Major 9 unhealthy d/yr today · 9 by 30 yrs out
Nearby sold comps map
Loading sold comps map…
Walkable amenities ~0.75 mi
Loading nearby amenities…
Taxation est. · year 1
- Rental income
- $26,186
- − Mortgage interest
- −$16,245
- − Property taxes
- −$1,381
- − Insurance
- −$1,450
- − Repairs & maintenance
- −$2,095
- − Management
- −$2,095
- − Depreciation
- −$8,436
- Taxable loss
- −$5,516
- Est. tax savings @ 24.0%
- +$1,324
- After-tax cash flow
- $930/yr
For passive investors: Depreciation is non-cash, so a rental often shows a tax loss while cash-flowing — sheltering income. Rental losses are passive: they offset passive income freely, and up to $25,000/yr can offset ordinary (W-2) income if you actively participate and your MAGI is under $100k (phasing out to $0 by $150k); unused losses carry forward. On sale, claimed depreciation is recaptured at up to 25%, and gains may owe capital-gains tax (a 1031 exchange can defer both). Figures are a year-1 estimate at your 24.0% rate — not tax advice; consult a CPA.
Schools (NCES district)
- District
- North Bend SD 13
- NCES district ID
- 4108820
- Math proficiency
- 30% ▼ -3.00%
- Reading proficiency
- 47% ▼ -6.00%
- Median HH income
- $43,614
- Composite
- 32.57/100
- National rank
- #5681
- State rank
- #21 of 58 in OR
Livability — North Bend
- Score
- 72/100
- State rank
- #105
- US rank
- #5876
Category grades
Schools grade is shown separately in the Schools card above.
Census & demographics
- Census place
- North Bend, OR
- Population (ZIP)
- 15,328
Population outlook (Coos County) Hauer SSP2
- Today (2025)
- 62,222 people
- By 2030
- 61,120 · -1.8%
- By 2040
- 58,478 · -6.0%
- By 2050
- 56,819 · -8.7%
- By 2075
- 54,915 · -11.7%
- By 2100
- 51,403 · -17.4%
Race, ethnicity, and origin ACS 2023
- Neighborhood character
- Predominantly White (82%)
- Race & ethnicity
- White 82% Two or more races 10% Hispanic / Latino 7% Asian 3% Native American 2%
- Hispanic origin (detail)
- Mexican 4%
- Common ancestry
- Italian 7% Portuguese 4% Lithuanian 3%
- Foreign-born
- 5% · Canada, China, Philippines
- Languages at home
- 94% English-only · Spanish 2% Chinese 1% Other Asian/Pacific 1%
Political lean MEDSL · Coos
- 2024 margin
- R (+19.9) · D 38.7% · R 58.5% · Other 2.8%
- 2008→2024 swing
- -16.8pp toward R · 2008: -3.1pp · 2024: -19.9pp
- All cycles
- 2024: R+19.9 2020: R+20.5 2016: R+24.3 2012: R+6.3 2008: R+3.1
Not yet ingested
- Civics
- —
Market trends
- HPI YoY
- ▲ 14.02%
- Current HPI
- 887.7
- Rent YoY
- —
- Metro
- —
- State GDP YoY
- ▲ 2.05%
- F500 in state
- 2
Industry mix (Fortune 500 HQ in OR)
| Industry | F500 HQs | Revenue |
|---|---|---|
| Consumer Goods | 1 | $51B |
|
||
Price history
+262.5% since first listed9 events — show timeline
- 2026-04-28 Pending — RMLS
- 2025-10-31 Listed $290,000 RMLS
- 2022-08-02 Sold (Public Records) $260,000 Public Records
- 2022-08-02 Sold (MLS) $260,000 RMLS
- 2022-07-30 Pending — RMLS
- 2022-05-03 Pending — RMLS
- 2022-04-02 Listed $289,000 RMLS
- 2007-08-21 Sold (Public Records) $180,000 Public Records
- 2004-10-27 Sold (Public Records) $80,000 Public Records
Property tax history
+2.3%/yrLatest (2025): $1,381 · -0.9% YoY. Source: county tax records.
Cash-flow waterfall
monthlySold comps — $/sqft
last 12 mo · ≤1 miLoading sold comps…