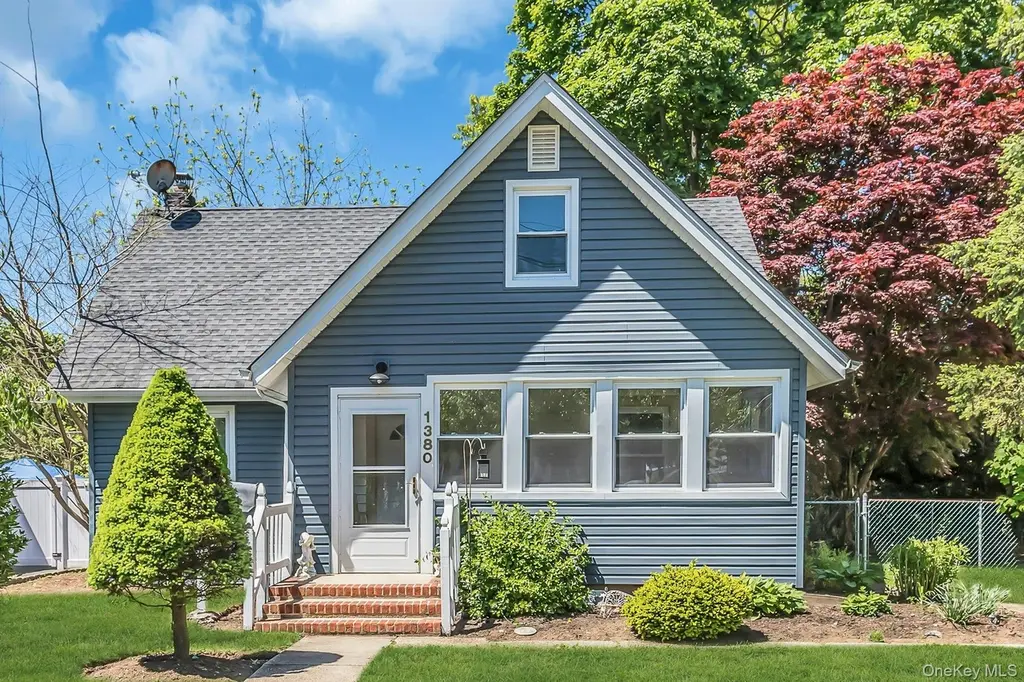
1380 Dartmouth St · Baldwin, NY
Flood risk 1/10 · Minimal
- FEMA flood zone
- X (unshaded)
- Chance of flooding over 30 yrs
- 0.0%
- Est. flood insurance / yr
- $473 – $860
Fire risk 1/10 · Minimal
- Est. fire insurance / yr
- $691 – $1,283
Heat risk 6/10 · Moderate
- Hot days now (above 96°F)
- 7 days/yr
- Hot days in 30 yrs
- 16 days/yr
Wind risk 6/10 · Moderate
- Chance of severe wind over 30 yrs
- 69.0%
Air-quality risk 4/10 · Minor
- Unhealthy air days now
- 5 days/yr
- Unhealthy air days in 30 yrs
- 8 days/yr
Risk factors via First Street. Map © Google.
Why this score? — see what drove the D grade
The composite is a weighted blend of 9 inputs, each scored 0–100. Each bar is that input's sub-score; the figure is the points it added to the 100-point composite (weight × sub-score).
- ARV discount +15.0/15.0
- Cash flow +7.8/30.0
- Schools +7.4/10.0
- Livability +4.2/5.0
- 1% rule +3.2/10.0
- Rent growth +2.5/5.0
- Condition / age +2.5/5.0
- DSCR +1.9/10.0
- Appreciation +0.0/10.0
$579,000
🖨 Deal sheet (PDF) 📄 Offer letter ✓ Due diligence
Listing remarks
Come in and make this your very own home sweet home. This charming cape is located on a quite street far from the hustles and bustles of the shopping plazas on Grand Ave but close enough to Rockville Centre Links Club for a relaxing golf outing. Plenty of opportunity to design this four bedroom, one bath home to your tastes and style. Taxes do not reflect a STAR savings.
Key facts
- 6,675 sq ft lot
- Built 1930
- Listed 37 days
Property features AI
Exterior
- Parking: Driveway
- Utilities: Public sewer; Electricity connected; Natural gas connected; Water connected
- Home design: Single-family residence
- Construction: Aluminum siding construction
- Exterior features: Aluminum siding; Not waterfront
Interior
- Kitchen: Convection oven; Cooktop; Dishwasher
- Bedrooms: 7 total rooms (includes bedrooms and living spaces)
- Bathrooms: 1 full bathroom
- Heating & cooling: Oil heating; No central air
- Interior features: First-floor bedroom; First-floor full bath; Full unfinished basement
Neighborhood map
What this means for you Summary
Snapshot
- This is a 4-bed/1.0-bath single-family listed at $579k.
Deal economics
- At list price, monthly cash flow is $-631 ($-8k/yr) — negative.
- To cash-flow at today's rent, offer at most $468k (19.2% below list).
- To meet the 1% rule (rent ≥ 1% of price), the offer needs to be $478k (17.5% below list).
- Recommended offer: $468k (19.2% below list) — sets the bar for cash-flow.
- Cap rate 5.0% vs local median 2.7% in Baldwin — top-decile yield for the area; either an underpriced asset or a hidden risk that comps aren't pricing in. Stress-test before assuming the spread holds.
Location & tenants
- Location reads 85/100 on livability (#38 in NY, #580 nationally) — a professional / high-income tenant draw. Strengths: amenities A+, commute A+, employment A+; Watch: cost of living F.
- Rockville Centre Union Free School District (suburban): math 82% / reading 82% proficiency, ranked #37 of 590 in NY (top 6%) — strong family-tenant draw, lease renewals of 3-5y typical; only 9% free/reduced lunch — higher-income household profile.
- Zoned schools: South Side Middle School (math 56% / reading 75%, grade A-, #119 of 729 statewide, top 16%, 837 students, 14% FRL); South Side High School (math 98% / reading 75%, grade A, #336 of 1,100 statewide, top 31%, 999 students, 16% FRL).
- Market conditions: 162 active listings in the ZIP; 2 comparable units currently listed for rent nearby; 824 units permitted in Nassau County in 2024 (153 in 5+ unit buildings).
Forward outlook
- Local home prices are declining (-3.0%/yr); year-one equity from $4k of loan paydown is wiped out by about $17k of value loss. Plan a longer hold.
- Nassau County population projected at +7% by 2050 — modest demand growth; plan on rents tracking national, not racing it.
Negotiation context
- It's been on market 37 days — a 3% lower offer ($562k) is reasonable based on typical stale-listing flexibility.
- Current owner paid $28k; list at $579k implies a 1932% gain — meaningful room to come down on a strong offer.
Risks & watch-outs
- Watch-outs: built in 1930 — expect roof / HVAC / electrical / plumbing capex.
- Climate carrying-cost: major wind risk, 69% chance of damaging wind over 30y; extreme-heat days projected 7→16/yr by 2055 (HVAC capex compounding) — expect insurance premiums to compound above CPI over the hold.
Questions for the listing agent
- What do current leases actually rent for vs. the listed asking? Can we see a recent rent roll and the last 12 months of T-12 income?
- It's been on market 37 days. Have you received any prior offers? Is the seller open to a 19% concession, seller financing, or rate buy-down credit?
- Built in 1930 — when were the roof, HVAC, electrical panel, plumbing, and water heater last replaced?
- Is there a deadline driving the sale (1031 exchange, divorce, estate, relocation)? That informs how much negotiation room exists.
- Schools are A-rated — typically a magnet for longer-tenancy family renters. What's the average tenant stay here, and is there a school-zone premium baked into asking?
- The area grade is low — what's the realistic commute time and amenity access for the typical tenant pool here? Any planned neighborhood developments (good or bad) we should know about?
- What's the average days-on-market for RENTAL listings here right now (not sales)? A rising rental-DOM trend means longer vacancies and softer asking-rent achievability than the comps imply.
- What's the recent tenant-quality profile in this submarket — average credit score on applications, eviction rate, late-payment / NSF rate, and stable-employment percentage? A property-management company in the area should have these aggregated.
- How much new for-sale + rental construction is in the pipeline within 1–3 miles? Heavy new supply typically softens prices + rents 12–24 months out; constrained supply supports both.
Investment metrics
- 1% rule
- 0.82% ✗
- Cap rate
- 4.99%
- Cash-on-cash
- -4.67%
- DSCR
- 0.79
- GRM
- 10.1
CMA / ARV
- ARV (median comp)
- $823,163
- List price
- $579,000
- Delta
- -29.66%
- Verdict
- UNDERPRICED
- Comps
- 20 within 1.0 mi
Show comp detail 12 sales within ~0.75 mi
| Address | Dist | Beds/Ba | Sqft | Sold | Price | $/sf | Match |
|---|---|---|---|---|---|---|---|
| 465 York Ct | 0.20mi | 4/2.0 | 1,541 (+12%) | 6mo | $865,000 | $561 | 62 |
| 1624 Berkeley Ave | 0.43mi | 3/1.0 (-1) | 1,251 (-9%) | 0mo | $680,000 | $544 | 59 |
| 728 Grand Terrace Ave | 0.46mi | 4/2.0 | 1,260 (-9%) | 4mo | $663,200 | $526 | 56 |
| 311 Cedar St | 0.60mi | 3/3.0 (-1) | 1,405 (+2%) | 1mo | $700,000 | $498 | 56 |
| 560 Stowe Ave | 0.59mi | 3/2.0 (-1) | 1,436 (+4%) | 2mo | $680,000 | $474 | 55 |
| 1746 Rockville Dr | 0.58mi | 3/1.0 (-1) | 1,254 (-9%) | 1mo | $671,000 | $535 | 52 |
| 610 Emerson Ave | 0.70mi | 3/1.0 (-1) | 1,287 (-7%) | 1mo | $590,000 | $458 | 51 |
| 578 Irene St | 0.70mi | 3/2.0 (-1) | 1,343 (-3%) | 4mo | $660,000 | $491 | 50 |
| 1620 Blenheim Rd | 0.46mi | 3/2.0 (-1) | 1,574 (+14%) | 4mo | $845,000 | $537 | 43 |
| 671 Stanton Ave | 0.58mi | 3/1.5 (-1) | 1,551 (+12%) | 4mo | $710,000 | $458 | 42 |
| 1139 Webber Ave | 0.59mi | 3/2.0 (-1) | 1,224 (-11%) | 4mo | $709,000 | $579 | 41 |
| 121 Knollwood Rd | 0.62mi | 3/1.5 (-1) | 1,574 (+14%) | 0mo | $714,000 | $454 | 41 |
Match score weights: distance 35% · size 25% · config 20% · recency 20%. Top-matched comps best support the ARV.
Projected returns pro-forma
-3.0% appreciation · 3.0% rent growth · sell at horizon
- IRR
- -24.1%
- Equity multiple
- 0.18×
- Total profit
- $-133,680
- Equity at exit
- $86,331
- IRR
- -19.2%
- Equity multiple
- -0.03×
- Total profit
- $-166,844
- Equity at exit
- $50,061
Cash invested: $162,120 (down + closing). Projections, not guarantees.
Landlord ↔ Tenant lean methodology
- Overall (STATE)
- 15 Strongly Tenant-Friendly
- State New York
- 15 Strongly Tenant-Friendly · D+10
- County
- — inherits STATE
- City
- — inherits STATE
ZIP-level market 11510
- Active inventory
- 162
- Price-to-rent
- 10.1×
Monthly cashflow live
- Estimated rent
- $4,775 medium interval (Pro) →
- Mortgage (P&I)
- −$3,036
- Tax from tax record
- −$1,126 /mo · $13,508/yr
- Insurance
- −$241
- HOA
- −$0
- Vacancy / Maint / Mgmt
- −$1,003
- Net cashflow
- $-631
Break-even live
Sensitivity live
| Price | -10% $-303 | -5% $-467 | +0% $-631 | +5% $-795 | +10% $-959 |
|---|---|---|---|---|---|
| Rent | -10% $-1,008 | -5% $-819 | +0% $-631 | +5% $-442 | +10% $-254 |
| Rate | -1.0pp $-339 | -0.5pp $-484 | base $-631 | +0.5pp $-781 | +1.0pp $-933 |
UW: 25.0% down · 7.5% · 30yr · 1.5% tax · 5.0% vac · 8.0% maint · 8.0% mgmt
Financing live
Cash to close
- Down payment
- $144,750
- Closing costs
- $17,370
- Reserves months
- —
- Total cash needed
- —
Loan-product check · same deal, 3 products live
Conventional
25% down · 7.5% · 30yr
- Down + closing
- —
- Monthly P&I
- —
- Monthly cashflow
- —
- DSCR
- —
- Eligible?
- —
Personal DTI + credit; lowest rate.
DSCR
20% down · 8.5% · 30yr
- Down + closing
- —
- Monthly P&I
- —
- Monthly cashflow
- —
- DSCR
- —
- Eligible?
- —
No personal income docs; deal must DSCR.
Hard money
10% down · 12.0% · 12mo
- Down + closing
- —
- Monthly P&I
- —
- Monthly cashflow
- —
- DSCR
- —
- Eligible?
- —
Short-term bridge; refi at stabilization.
Rent comps 2 comps
| Address | Beds | Baths | Sqft | Rent | $/sqft | DOM | Units | Dist |
|---|---|---|---|---|---|---|---|---|
| 20 Mayfair Ct Freeport, NY | 3.0 | 2.5 | 1860 | $4,750 | $2.55 | 9d | 1 | 1.42mi |
| 54 Kane Ave Hempstead, NY | 5.0 | 2.0 | 1750 | $4,800 | $2.74 | 45d | 1 | 1.47mi |
Listing history 17 events
-
2026-06-21statusdays on market $579,000 Pending 37 DOM
-
2026-06-18days on market $579,000 Active 36 DOM
-
2026-06-17days on market $579,000 Active 35 DOM
-
2026-06-16days on market $579,000 Active 34 DOM
-
2026-06-15days on market $579,000 Active 33 DOM
-
2026-06-13days on market $579,000 Active 31 DOM
-
2026-06-13days on market $579,000 Active 30 DOM
-
2026-06-09days on market $579,000 Active 27 DOM
-
2026-06-08days on market $579,000 Active 26 DOM
-
2026-06-07days on market $579,000 Active 25 DOM
-
2026-06-04days on market $579,000 Active 22 DOM
-
2026-06-03days on market $579,000 Active 21 DOM
-
2026-06-02days on market $579,000 Active 20 DOM
-
2026-06-01days on market $579,000 Active 19 DOM
-
2026-05-31days on market $579,000 Active 18 DOM
-
2026-04-30$579,000 Active 374-char remark
-
1979-12-01soldstatus $28,500
ⓘ Source: listings_history table (triggers on properties + properties_extension) + one-shot
backfill from property_details.listing_events for pre-trigger history.
Tax reassessment forecast NY · Partial reset (capped growth)
- Current annual tax
- $13,508 · $1,126/mo
- Projected year-2 tax
- $13,508 · $1,126/mo
- Expected delta
- $0/yr ($0/mo · 0.0%)
ⓘ Screening estimate from a state-policy table — verify with the county assessor before closing.
Climate risk First Street
- Flood 1/10 Low FEMA zone X (unshaded) · 0% chance over 30 yrs
- Wildfire 1/10 Low
- Heat 6/10 Major 7 d/yr ≥96°F today · 16 d/yr by 30 yrs out
- Wind 6/10 Major 69% chance of damaging wind over 30 yrs
- Air quality 4/10 Moderate 5 unhealthy d/yr today · 8 by 30 yrs out
Nearby sold comps map
Loading sold comps map…
Walkable amenities ~0.75 mi
Loading nearby amenities…
Taxation est. · year 1
- Rental income
- $57,303
- − Mortgage interest
- −$32,433
- − Property taxes
- −$13,508
- − Insurance
- −$2,895
- − Repairs & maintenance
- −$4,584
- − Management
- −$4,584
- − Depreciation
- −$16,844
- Taxable loss
- −$17,545
- Est. tax savings @ 24.0%
- +$4,211
- After-tax cash flow
- $-3,359/yr
For passive investors: Depreciation is non-cash, so a rental often shows a tax loss while cash-flowing — sheltering income. Rental losses are passive: they offset passive income freely, and up to $25,000/yr can offset ordinary (W-2) income if you actively participate and your MAGI is under $100k (phasing out to $0 by $150k); unused losses carry forward. On sale, claimed depreciation is recaptured at up to 25%, and gains may owe capital-gains tax (a 1031 exchange can defer both). Figures are a year-1 estimate at your 24.0% rate — not tax advice; consult a CPA.
Schools (NCES district)
- District
- Rockville Centre Union Free School District
- NCES district ID
- 3624780
- Math proficiency
- 82% ▲ 3.00%
- Reading proficiency
- 82% ▲ 2.00%
- Median HH income
- $102,401
- Composite
- 74.33/100
- National rank
- #162
- State rank
- #37 of 590 in NY
Livability — Baldwin
- Score
- 85/100
- State rank
- #38
- US rank
- #580
Category grades
Schools grade is shown separately in the Schools card above.
Census & demographics
- Census place
- Baldwin, NY
- City population
- 34,814
- Population (ZIP)
- 34,814
Population outlook (Nassau County) Hauer SSP2
- Today (2025)
- 1,409,302 people
- By 2030
- 1,431,482 · +1.6%
- By 2040
- 1,471,607 · +4.4%
- By 2050
- 1,502,845 · +6.6%
- By 2075
- 1,575,403 · +11.8%
- By 2100
- 1,554,356 · +10.3%
Race, ethnicity, and origin ACS 2023
- Neighborhood character
- Highly diverse neighborhood (Simpson 0.71)
- Race & ethnicity
- Black 41% White 28% Hispanic / Latino 22% Two or more races 13% Asian 4%
- Hispanic origin (detail)
- Puerto Rican 4% Dominican 4%
- Common ancestry
- Hispanic 8% Romanian 1% Scotch-Irish 1%
- Foreign-born
- 25% · Canada, Dominican Republic, Jamaica
- Languages at home
- 72% English-only · Spanish 15% French/Haitian/Cajun 7% Other Indo-European 1%
Political lean MEDSL · Nassau
- 2024 margin
- Toss-up / Even · D 47.9% · R 52.1%
- 2008→2024 swing
- -12.6pp toward R · 2008: 8.4pp · 2024: -4.2pp
- All cycles
- 2024: R+4.2 2020: D+9.5 2016: D+5.3 2012: D+6.7 2008: D+8.4
Not yet ingested
- Civics
- —
Market trends
- HPI YoY
- ▼ -578.11%
- Current HPI
- 314.4598
- Rent YoY
- —
- Metro
- —
- State GDP YoY
- ▲ 2.60%
- F500 in state
- 92
Industry mix (Fortune 500 HQ in NY)
| Industry | F500 HQs | Revenue |
|---|---|---|
| Financial Services | 10 | $950B |
|
||
| Consumer Goods | 9 | $162B |
|
||
| Insurance | 4 | $225B |
|
||
| Telecommunications | 2 | $144B |
|
||
| Pharmaceuticals | 2 | $112B |
|
||
| Media / Entertainment | 2 | $69B |
|
||
Price history
+1931.6% since first listed2 events — show timeline
- 2026-04-30 Listed $579,000 OneKey® MLS as Distributed by MLS Grid
- 1979-12-01 Sold (Public Records) $28,500 Public Records
Property tax history
+3.1%/yrLatest (2024): $13,508 · +0.6% YoY. Source: county tax records.
Cash-flow waterfall
monthlySold comps — $/sqft
last 12 mo · ≤1 miLoading sold comps…