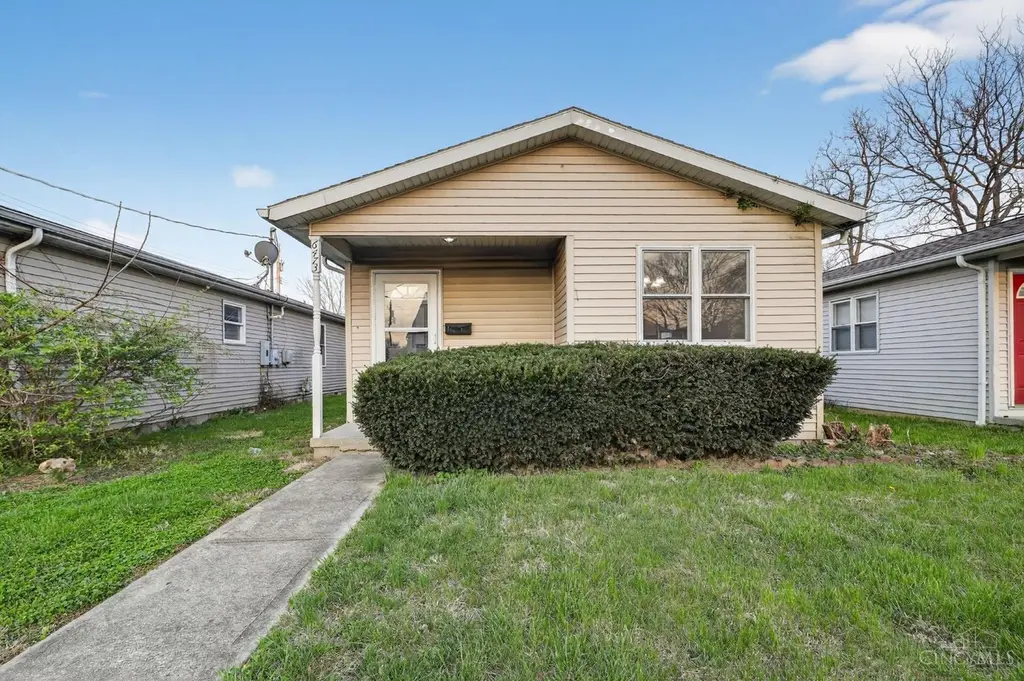
6473 Betts Ave · North College Hill, OH
Flood risk 1/10 · Minimal
- FEMA flood zone
- X (unshaded)
- Chance of flooding over 30 yrs
- 0.0%
- Est. flood insurance / yr
- $507 – $1,088
Fire risk 1/10 · Minimal
- Est. fire insurance / yr
- $713 – $1,323
Heat risk 4/10 · Minor
- Hot days now (above 103°F)
- 7 days/yr
- Hot days in 30 yrs
- 19 days/yr
Wind risk 2/10 · Minimal
- Chance of severe wind over 30 yrs
- 1.0%
Air-quality risk 2/10 · Minimal
- Unhealthy air days now
- 1 days/yr
- Unhealthy air days in 30 yrs
- 1 days/yr
Risk factors via First Street. Map © Google.
Why this score? — see what drove the D grade
The composite is a weighted blend of 9 inputs, each scored 0–100. Each bar is that input's sub-score; the figure is the points it added to the 100-point composite (weight × sub-score).
- Cash flow +13.6/30.0
- ARV discount +11.6/15.0
- DSCR +4.1/10.0
- Rent growth +4.0/5.0
- 1% rule +3.8/10.0
- Livability +3.7/5.0
- Condition / age +2.5/5.0
- Schools +1.5/10.0
- Appreciation +0.0/10.0
$169,900
🖨 Deal sheet (PDF) 📄 Offer letter ✓ Due diligence
Listing remarks
Discover this solid 3-bedroom, 1-bathroom cape cod nestled on a quiet, established street in the heart of the North College Hill school district. This home offers a fantastic opportunity for first-time buyers looking to build sweat equity or investors seeking a high-yield rental in a high-demand area. The main level features a functional layout with original hardwood floors waiting to be polished to their full potential. The spacious second-floor primary suite provides a private retreat, while the full basement offers plenty of room for storage or future finishing. Step outside to a level, private backyard the perfect canvas for outdoor entertaining and gardening. Located just minutes from
Key facts
- Outdoor entertaining
- Full basement
- 4,034 sq ft lot
Tags
Property features AI
Finance
- Other: Residential zoning
- HOA & community: No homeowners association
Exterior
- Utilities: Public water; Public sewer; Natural gas
- Home design: Ranch-style single-family home; One-level; 220 volt service
- Construction: Vinyl siding; Block foundation; Shingle roof
- Exterior features: Wood, insulated windows
Interior
- Kitchen: Kitchen approximately 8 x 9; Dishwasher; Oven/Range; Refrigerator
- Bedrooms: Three bedrooms, all on the main level; Primary bedroom approximately 10 x 12; Bedroom 2 approximately 9 x 12; Bedroom 3 approximately 10 x 12
- Flooring: Carpet in living room
- Bathrooms: One full bathroom on the main level
- Heating & cooling: Forced-air gas heating; Central air conditioning; Gas water heating
- Interior features: Wall-to-wall carpet in the living room; Crawl basement; Total of 6 rooms
- Laundry & utility: Main-level laundry room approximately 5 x 6
Neighborhood map
What this means for you Summary
Snapshot
- This is a 3-bed/1.0-bath single-family listed at $170k.
Deal economics
- At list price, monthly cash flow is $8 ($99/yr) — positive.
- The deal already cash-flows at list — no discount required.
- To meet the 1% rule (rent ≥ 1% of price), the offer needs to be $149k (12.4% below list).
- Recommended offer: $149k (12.4% below list) — sets the bar for 1% rule.
Location & tenants
- Location reads 74/100 on livability (#288 in OH, #4,745 nationally) — a middle-class / working-renter tenant base. Strengths: commute A+, cost of living A+, housing A+; Watch: employment C-, amenities D, crime F.
- North College Hill City (suburban): math 13% / reading 22% proficiency, ranked #637 of 656 in OH (top 97%) — low school quality limits family demand, transient renter base, plan for 1-2y turnover; 75% free/reduced lunch — lower-income household profile, screen leases tightly.
- Zoned schools: North College Hill Elementary School (math 17% / reading 22%, grade F, #1,293 of 1,584 statewide, top 83%, 481 students, 0% FRL); North College Hill Middle School (math 11% / reading 22%, grade F, #622 of 654 statewide, top 95%, 430 students, 0% FRL); North College Hill High School (math 12% / reading 22%, grade F, #701 of 781 statewide, top 90%, 333 students, 0% FRL) — zoned schools average 0% FRL vs 75% district-wide (75 pts lower); this property's tenant base skews higher-income than the district average.
- Market conditions: Rents rising fast (+6.0%/yr); 57 active listings in the ZIP; 25 comparable units currently listed for rent nearby; rentals at typical pace (median 26d on market — plan ~3-4 weeks tenant-placement turnaround); 801 units permitted in Hamilton County in 2024 (190 in 5+ unit buildings).
Forward outlook
- Local home prices are declining (-3.0%/yr); year-one equity from $1k of loan paydown is wiped out by about $5k of value loss. Plan a longer hold.
Negotiation context
- It's been on market 67 days — a 6% lower offer ($160k) is reasonable based on typical stale-listing flexibility.
- 3 sale attempts since 23y ago; this cycle's ask has dropped $20k (11%) from the opening price — seller is motivated, your offer sets the floor, not the list.
- Current owner paid $52k; list at $170k implies a 227% gain — meaningful room to come down on a strong offer.
Questions for the listing agent
- It's been on market 67 days. Have you received any prior offers? Is the seller open to a 12% concession, seller financing, or rate buy-down credit?
- Why hasn't it sold? Are there any deal-killer items the seller is aware of (foundation, flood, title, zoning, code violations)?
- Is there a deadline driving the sale (1031 exchange, divorce, estate, relocation)? That informs how much negotiation room exists.
- Schools are D-rated, which usually means shorter tenancies and higher turnover. Who's the typical renter profile here, and what's been the actual vacancy rate?
- Crime grade is F in this area — have there been break-ins, vandalism, or insurance claims at this property in the last 3 years? What carrier currently insures it and at what premium?
- The area grade is low — what's the realistic commute time and amenity access for the typical tenant pool here? Any planned neighborhood developments (good or bad) we should know about?
- What's the average days-on-market for RENTAL listings here right now (not sales)? A rising rental-DOM trend means longer vacancies and softer asking-rent achievability than the comps imply.
- What's the recent tenant-quality profile in this submarket — average credit score on applications, eviction rate, late-payment / NSF rate, and stable-employment percentage? A property-management company in the area should have these aggregated.
- How much new for-sale + rental construction is in the pipeline within 1–3 miles? Heavy new supply typically softens prices + rents 12–24 months out; constrained supply supports both.
Investment metrics
- 1% rule
- 0.88% ✗
- Cap rate
- 6.35%
- Cash-on-cash
- 0.21%
- DSCR
- 1.01
- GRM
- 9.5
CMA / ARV
- ARV (on-the-fly)
- $186,961
- Comps found
- 12
Show comp detail 12 sales within ~0.75 mi
| Address | Dist | Beds/Ba | Sqft | Sold | Price | $/sf | Match |
|---|---|---|---|---|---|---|---|
| 1830 Cordova Ave | 0.09mi | 3/3.0 | 1,132 (-1%) | 4mo | $218,000 | $193 | 82 |
| 1917 Dallas Ave | 0.31mi | 3/1.0 | 1,147 (0%) | 6mo | $142,500 | $124 | 81 |
| 1913 Sterling Ave | 0.20mi | 2/2.0 (-1) | 1,172 (+2%) | 2mo | $235,000 | $201 | 76 |
| 1919 Sundale Ave | 0.25mi | 4/1.0 (+1) | 1,201 (+5%) | 1mo | $100,000 | $83 | 75 |
| 6623 Betts Ave | 0.25mi | 3/1.0 | 1,242 (+8%) | 0mo | $140,000 | $113 | 74 |
| 1944 Dallas Ave | 0.35mi | 3/1.0 | 1,199 (+4%) | 2mo | $199,500 | $166 | 74 |
| 6822 Betts Ave | 0.46mi | 2/1.0 (-1) | 1,182 (+3%) | 2mo | $128,000 | $108 | 67 |
| 2030 Emerson Ave | 0.33mi | 2/2.0 (-1) | 1,225 (+7%) | 4mo | $199,500 | $163 | 61 |
| 6792 Golfway Dr | 0.47mi | 3/1.5 | 1,024 (-11%) | 5mo | $205,000 | $200 | 54 |
| 1556 Reid Ave | 0.71mi | 2/1.5 (-1) | 1,174 (+2%) | 4mo | $120,000 | $102 | 52 |
| 6381 Golfway Dr | 0.60mi | 4/1.5 (+1) | 1,245 (+8%) | 1mo | $199,500 | $160 | 50 |
| 6078 Oakwood Ave | 0.54mi | 2/1.5 (-1) | 1,266 (+10%) | 3mo | $275,000 | $217 | 48 |
Match score weights: distance 35% · size 25% · config 20% · recency 20%. Top-matched comps best support the ARV.
Projected returns pro-forma
-3.0% appreciation · 6.0% rent growth · sell at horizon
- IRR
- -12.7%
- Equity multiple
- 0.53×
- Total profit
- $-22,357
- Equity at exit
- $25,333
- IRR
- 0.4%
- Equity multiple
- 1.03×
- Total profit
- $1,483
- Equity at exit
- $14,690
Cash invested: $47,572 (down + closing). Projections, not guarantees.
Landlord ↔ Tenant lean methodology
- Overall (STATE)
- 73 Landlord-Friendly
- State Ohio
- 73 Landlord-Friendly · R+6
- County
- — inherits STATE
- City
- — inherits STATE
ZIP-level market 45239
- Home prices YoY
- -32.8%
- Rents YoY
- 6.0%
- Active inventory
- 57
- Price-to-rent
- 9.5×
Monthly cashflow live
- Estimated rent
- $1,489 high interval (Pro) →
- Mortgage (P&I)
- −$891
- Tax from tax record
- −$206 /mo · $2,471/yr
- Insurance
- −$71
- HOA
- −$0
- Vacancy / Maint / Mgmt
- −$313
- Net cashflow
- $8
Break-even live
Sensitivity live
| Price | -10% $104 | -5% $56 | +0% $8 | +5% $-40 | +10% $-88 |
|---|---|---|---|---|---|
| Rent | -10% $-109 | -5% $-51 | +0% $8 | +5% $67 | +10% $126 |
| Rate | -1.0pp $94 | -0.5pp $51 | base $8 | +0.5pp $-36 | +1.0pp $-81 |
UW: 25.0% down · 7.5% · 30yr · 1.5% tax · 5.0% vac · 8.0% maint · 8.0% mgmt
Financing live
Cash to close
- Down payment
- $42,475
- Closing costs
- $5,097
- Reserves months
- —
- Total cash needed
- —
Loan-product check · same deal, 3 products live
Conventional
25% down · 7.5% · 30yr
- Down + closing
- —
- Monthly P&I
- —
- Monthly cashflow
- —
- DSCR
- —
- Eligible?
- —
Personal DTI + credit; lowest rate.
DSCR
20% down · 8.5% · 30yr
- Down + closing
- —
- Monthly P&I
- —
- Monthly cashflow
- —
- DSCR
- —
- Eligible?
- —
No personal income docs; deal must DSCR.
Hard money
10% down · 12.0% · 12mo
- Down + closing
- —
- Monthly P&I
- —
- Monthly cashflow
- —
- DSCR
- —
- Eligible?
- —
Short-term bridge; refi at stabilization.
Rent comps 25 comps
| Address | Beds | Baths | Sqft | Rent | $/sqft | DOM | Units | Dist |
|---|---|---|---|---|---|---|---|---|
| 1908 Emerson Ave Cincinnati, OH | 4.0 | 1.0 | 760 | $1,550 | $2.04 | 25d | 1 | 0.13mi |
| 1834 Emerson Ave Cincinnati, OH | 2.0 | 1.0 | 1187 | $1,500 | $1.26 | 25d | 1 | 0.14mi |
| 1804 Waltham Ave Cincinnati, OH | 2.0 | 1.0 | 1186 | $1,425 | $1.20 | 9d | 1 | 0.25mi |
| 6834 Betts Ave Cincinnati, OH | 4.0 | 1.5 | 1426 | $1,695 | $1.19 | 25d | 1 | 0.52mi |
| 5800 Renee Ct Cincinnati, OH | 2.0 | 1.0 | 775 | $1,099 | $1.42 | 23d | 1 | 0.55mi |
| 1837 W Galbraith Rd Cincinnati, OH | 2.0 | 2.0 | 1087 | $1,500 | $1.38 | 25d | 1 | 0.57mi |
| 1720 W North Bend Rd Cincinnati, OH | 3.0 | 1.0 | 900 | $1,400 | $1.56 | 25d | 1 | 0.58mi |
| 5856 Renee Ct Cincinnati, OH | 2.0 | 1.0 | 775 | $1,099 | $1.42 | 25d | 1 | 0.60mi |
| 1604 W Galbraith Rd Unit F North College Hill, OH | 2.0 | 1.0 | 1250 | $1,150 | $0.92 | 16d | 1 | 0.70mi |
| 6211 Hamilton Ave Cincinnati, OH | 2.0 | 1.0–2.0 | 842 | $1,968 | $2.34 | 3d | 17 | 0.71mi |
| 5928 Belmont Ave Unit Washer Dryer Hookup Cincinnati, OH | 3.0 | 1.0 | 1120 | $1,395 | $1.25 | 18d | 1 | 0.73mi |
| 5910 Belmont Ave Unit 3 Cincinnati, OH | 2.0 | 1.0 | 900 | $995 | $1.11 | 6d | 1 | 0.77mi |
| 1740 Bising Ave North College Hill, OH | 3.0 | 2.0 | 1235 | $1,697 | $1.37 | 3d | 6 | 0.83mi |
| 7032 La Boiteaux Ave Cincinnati, OH | 4.0 | 1.0 | 1200 | $1,800 | $1.50 | 25d | 1 | 0.84mi |
| 2512 Rack Ct Unit 3 Cincinnati, OH | 2.0 | 1.0 | 900 | $1,125 | $1.25 | 25d | 1 | 1.01mi |
| 2536 Rack Ct Cincinnati, OH | 2.0 | 1.0 | 840 | $900 | $1.07 | 25d | 1 | 1.06mi |
| 1628 Linden Dr Unit 937 Cincinnati, OH | 2.0 | 1.0 | 950 | $1,163 | $1.22 | 25d | 1 | 1.13mi |
| 1409 Cedar Ave Cincinnati, OH | 3.0 | 1.0 | 1248 | $1,525 | $1.22 | 6d | 1 | 1.16mi |
| 5824 Shadymist Ln Unit 3 Cincinnati, OH | 2.0 | 1.0 | 875 | $1,100 | $1.26 | 25d | 1 | 1.22mi |
| 5845 Shadymist Ln Apt 1 Cincinnati, OH | 2.0 | 1.0 | 850 | $990 | $1.16 | 22d | 1 | 1.26mi |
| 1667 Lakenoll Dr Mt Healthy, OH | 1.0–2.0 | 1.0–1.5 | 817 | $1,385 | $1.69 | 5d | 7 | 1.26mi |
| 5465 Kirby Ave Unit 5465-8 Cincinnati, OH | 2.0 | 1.0 | 820 | $1,095 | $1.34 | 12d | 1 | 1.35mi |
| 5465 Kirby Ave Unit 5465-21 Cincinnati, OH | 2.0 | 1.0 | 820 | $1,095 | $1.34 | 25d | 1 | 1.35mi |
| 5469 Kirby Ave Cincinnati, OH | 1.0–2.0 | 1.0 | 720 | $1,095 | $1.52 | 5d | 33 | 1.40mi |
| 8879 Zodiac Dr Cincinnati, OH | 3.0 | 2.0 | 1040 | $1,781 | $1.71 | 25d | 1 | 1.50mi |
Listing history 25 events
-
2026-06-21days on market $169,900 Active 67 DOM
-
2026-06-18days on market $169,900 Active 64 DOM
-
2026-06-17days on market $169,900 Active 63 DOM
-
2026-06-16days on market $169,900 Active 62 DOM
-
2026-06-15days on market $169,900 Active 61 DOM
-
2026-06-13days on market $169,900 Active 59 DOM
-
2026-06-09days on market $169,900 Active 55 DOM
-
2026-06-08days on market $169,900 Active 54 DOM
-
2026-06-07pricedays on market $169,900 Active 53 DOM
-
2026-06-03days on market $184,900 Active 49 DOM
-
2026-06-02days on market $184,900 Active 48 DOM
-
2026-06-01days on market $184,900 Active 47 DOM
-
2026-05-31days on market $184,900 Active 46 DOM
-
2026-04-18price $184,900
-
2026-04-15$189,900 Active
-
2017-01-04soldstatus $52,000
-
2015-07-28historical
-
2015-04-02$61,000 Active
-
2013-10-18soldstatus $60,250
-
2012-06-29soldstatus $110,000
-
2004-01-01historical
-
2003-01-07$89,900
-
2001-03-23soldstatus $41,000
-
1995-07-17soldstatus $49,000
-
1991-02-15soldstatus $38,800
ⓘ Source: listings_history table (triggers on properties + properties_extension) + one-shot
backfill from property_details.listing_events for pre-trigger history.
Tax reassessment forecast OH · Partial reset (capped growth)
- Current annual tax
- $2,471 · $206/mo
- Projected year-2 tax
- $2,560 · $213/mo
- Expected delta
- +$90/yr (+$7/mo · 3.6%)
ⓘ Screening estimate from a state-policy table — verify with the county assessor before closing.
Climate risk First Street
- Flood 1/10 Low FEMA zone X (unshaded) · 0% chance over 30 yrs
- Wildfire 1/10 Low
- Heat 4/10 Moderate 7 d/yr ≥103°F today · 19 d/yr by 30 yrs out
- Wind 2/10 Low 100% chance of damaging wind over 30 yrs
- Air quality 2/10 Low 1 unhealthy d/yr today · 1 by 30 yrs out
Nearby sold comps map
Loading sold comps map…
Walkable amenities ~0.75 mi
Loading nearby amenities…
Taxation est. · year 1
- Rental income
- $17,862
- − Mortgage interest
- −$9,517
- − Property taxes
- −$2,471
- − Insurance
- −$850
- − Repairs & maintenance
- −$1,429
- − Management
- −$1,429
- − Depreciation
- −$4,943
- Taxable loss
- −$2,775
- Est. tax savings @ 24.0%
- +$666
- After-tax cash flow
- $765/yr
For passive investors: Depreciation is non-cash, so a rental often shows a tax loss while cash-flowing — sheltering income. Rental losses are passive: they offset passive income freely, and up to $25,000/yr can offset ordinary (W-2) income if you actively participate and your MAGI is under $100k (phasing out to $0 by $150k); unused losses carry forward. On sale, claimed depreciation is recaptured at up to 25%, and gains may owe capital-gains tax (a 1031 exchange can defer both). Figures are a year-1 estimate at your 24.0% rate — not tax advice; consult a CPA.
Schools (NCES district)
- District
- North College Hill City
- NCES district ID
- 3904451
- Math proficiency
- 13% ▼ -14.00%
- Reading proficiency
- 22% ▼ -11.00%
- Median HH income
- $40,355
- Composite
- 14.89/100
- National rank
- #9375
- State rank
- #637 of 656 in OH
Livability — North College Hill
- Score
- 74/100
- State rank
- #288
- US rank
- #4745
Category grades
Schools grade is shown separately in the Schools card above.
Census & demographics
- Census place
- North College Hill, OH
- County
- Hamilton County · 701,295 people
- Metro
- Cincinnati, OH-KY-IN
- Population (ZIP)
- 29,607
- Household income
- $60,324
- Rent vs Own
- Severe rent burden
- 1566.0
Population outlook (Hamilton County) Hauer SSP2
- Today (2025)
- 826,054 people
- By 2030
- 830,947 · +0.6%
- By 2040
- 832,319 · +0.8%
- By 2050
- 822,428 · -0.4%
- By 2075
- 788,688 · -4.5%
- By 2100
- 710,674 · -14.0%
Race, ethnicity, and origin ACS 2023
- Neighborhood character
- Diverse neighborhood (Simpson 0.63)
- Race & ethnicity
- White 50% Black 35% Two or more races 8% Hispanic / Latino 4% Asian 4%
- Common ancestry
- Lithuanian 2% Slovak 1% Italian 1%
- Foreign-born
- 4% · India, Canada
- Languages at home
- 93% English-only · Other Indo-European 3% Spanish 2%
Political lean MEDSL · Hamilton
- 2024 margin
- D (+14.9) · D 57.0% · R 42.1%
- 2008→2024 swing
- +7.9pp toward D · 2008: 7.0pp · 2024: 14.9pp
- All cycles
- 2024: D+14.9 2020: D+15.9 2016: D+9.5 2012: D+4.9 2008: D+7.0
Not yet ingested
- Civics
- —
Market trends
- HPI YoY
- ▼ -114.46%
- Current HPI
- 234.6033
- Rent YoY
- ▲ 6.00%
- Metro
- Cincinnati, OH-KY-IN
- State GDP YoY
- ▲ 1.98%
- F500 in state
- 48
Industry mix (Fortune 500 HQ in OH)
| Industry | F500 HQs | Revenue |
|---|---|---|
| Insurance | 3 | $145B |
|
||
| Industrial Machinery | 3 | $49B |
|
||
| Financial Services | 3 | $24B |
|
||
| Consumer Goods | 2 | $93B |
|
||
| Aerospace / Defense | 2 | $47B |
|
||
| Utilities | 2 | $33B |
|
||
Price history
+376.5% since first listed12 events — show timeline
- 2026-04-18 Price Changed $184,900 Cincy MLS
- 2026-04-15 Listed $189,900 Cincy MLS
- 2017-01-04 Sold (Public Records) $52,000 Public Records
- 2015-07-28 Listing Removed — Cincy MLS
- 2015-04-02 Listed $61,000 Cincy MLS
- 2013-10-18 Sold (Public Records) $60,250 Public Records
- 2012-06-29 Sold (Public Records) $110,000 Public Records
- 2004-01-01 Listing Removed — Cincy MLS
- 2003-01-07 Listed $89,900 Cincy MLS
- 2001-03-23 Sold (Public Records) $41,000 Public Records
- 1995-07-17 Sold (Public Records) $49,000 Public Records
- 1991-02-15 Sold (Public Records) $38,800 Public Records
Property tax history
+5.9%/yrLatest (2025): $2,471 · +0.0% YoY. Source: county tax records.
Cash-flow waterfall
monthlySold comps — $/sqft
last 12 mo · ≤1 miLoading sold comps…