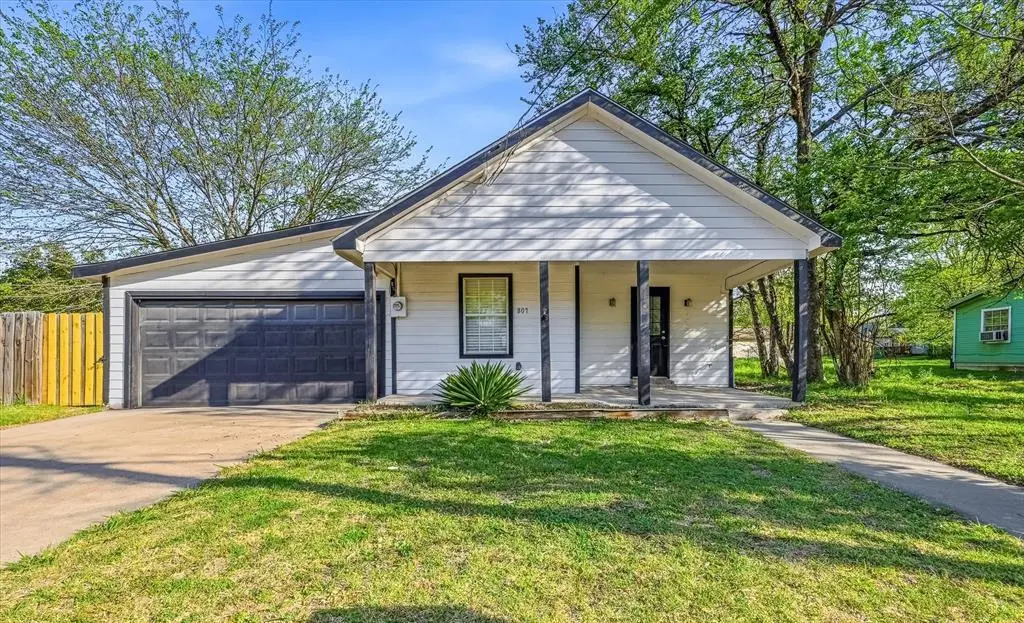
807 Wyatt St · Waxahachie, TX
Flood risk 1/10 · Minimal
- FEMA flood zone
- X (unshaded)
- Chance of flooding over 30 yrs
- 0.0%
- Est. flood insurance / yr
- $507 – $1,088
Fire risk 4/10 · Minor
- Est. fire insurance / yr
- $1,222 – $2,270
Heat risk 7/10 · Major
- Hot days now (above 110°F)
- 7 days/yr
- Hot days in 30 yrs
- 24 days/yr
Wind risk 6/10 · Moderate
- Chance of severe wind over 30 yrs
- 27.0%
Air-quality risk 2/10 · Minimal
- Unhealthy air days now
- 1 days/yr
- Unhealthy air days in 30 yrs
- 1 days/yr
Risk factors via First Street. Map © Google.
Why this score? — see what drove the C- grade
The composite is a weighted blend of 9 inputs, each scored 0–100. Each bar is that input's sub-score; the figure is the points it added to the 100-point composite (weight × sub-score).
- Cash flow +15.7/30.0
- ARV discount +15.0/15.0
- 1% rule +5.4/10.0
- DSCR +4.8/10.0
- Schools +3.9/10.0
- Livability +3.9/5.0
- Rent growth +3.4/5.0
- Condition / age +2.5/5.0
- Appreciation +0.0/10.0
$235,000
🖨 Deal sheet 📄 Offer letter ✓ Due diligence
Listing remarks
INVESTOR SPECIAL! Welcome to 807 Wyatt Street, a charming residence nestled in the heart of Waxahachie. This inviting home offers the perfect blend of comfort, space, and thoughtful upgrades—ideal for creating lasting memories. Step inside to an oversized foyer that sets the tone for the home’s spacious and welcoming design. From there, you’re drawn into the expansive living room and dining area, perfect for entertaining guests or enjoying everyday life with ease. As you move through the home, you’ll find generously sized bedrooms that provide a relaxing retreat for everyone. The primary suite serves as a true escape, featuring a private en-suite bathroom complete wi
Key facts
- Dual vanities
- Oversized foyer
- Ample closet space
Tags
Property features AI
Finance
- Other: Property type: Residential (single family); Lot under 0.5 acre
- Financial info: Accepts Cash, Conventional, FHA, and VA financing
- HOA & community: No association; Community features include pool, park, playground, jogging/bike path, curbs, and sidewalks
Exterior
- Parking: 2 covered parking spaces; 2-car attached garage with inside entrance; Driveway and off-street parking; Garage faces front; Private, lighted parking
- Security: Smoke detector(s)
- Utilities: City water; City sewer; Electricity available; Cable available; Sewer available; Curbs and sidewalk
- Home design: Single family residence; Two levels; Detached property; Deed restrictions
- Construction: Built in 1940; Siding and wood construction; Shingle roof; Slab foundation
- Exterior features: Covered porch(es); Large backyard with grass
Interior
- Kitchen: Dishwasher; Electric range; Microwave; Granite counters
- Bedrooms: Primary bedroom on level 1 with dual sinks, ensuite bath, garden tub, and walk-in closet(s); Total of 4 bedrooms
- Flooring: Carpet; Ceramic tile; Luxury vinyl plank
- Bathrooms: 3 full bathrooms
- Heating & cooling: Central heat; Central air
- Interior features: Open floorplan; Vaulted ceilings; Decorative lighting; Granite counters; Cable TV available; High-speed internet available; Walk-in closet(s)
- Laundry & utility: Washer hookup; Electric dryer hookup
Neighborhood map
What this means for you Summary
Snapshot
- This is a 4-bed/2.0-bath single-family listed at $235k.
Deal economics
- At list price, monthly cash flow is $102 ($1k/yr) — positive.
- The deal already cash-flows at list — no discount required.
- Meets the 1% rule at list price ($2k rent vs $235k).
- Recommended offer: $231k (1.5% below list) — sets the bar for market timing.
- Cap rate 6.8% vs local median 3.3% in Waxahachie — top-decile yield for the area; either an underpriced asset or a hidden risk that comps aren't pricing in. Stress-test before assuming the spread holds.
Location & tenants
- Location reads 78/100 on livability (#71 in TX, #2,592 nationally) — a middle-class / working-renter tenant base. Strengths: cost of living A+, housing A+, employment A-; Watch: commute F.
- Waxahachie ISD (suburban): math 45% / reading 44% proficiency, ranked #253 of 826 in TX (top 31%) — families likely to look elsewhere, expect single-tenant / working-renter base with shorter leases.
- Zoned schools: Marvin Biomedical Academy (math 27% / reading 32%, grade F, #2,525 of 4,322 statewide, top 62%, 456 students, 75% FRL) — zoned schools average 75% FRL vs 48% district-wide (28 pts higher); higher-poverty schools than district average — tighter screening recommended.
- Zoned-school proficiency averages 30% at this address vs 44% district-wide (-15 pts) — the specific schools serving this property underperform the Waxahachie ISD average; the district grade overstates school quality for this exact location.
- Market conditions: Rents rising (+3.4%/yr); 854 active listings in the ZIP; 11 comparable units currently listed for rent nearby; rentals leasing fast (median 8d on market — plan ~1-2 weeks tenant-placement turnaround); solid renter incomes; 3,016 units permitted in Ellis County in 2024 (20 in 5+ unit buildings).
Forward outlook
- Local home prices are declining (-3.0%/yr); year-one equity from $2k of loan paydown is wiped out by about $7k of value loss. Plan a longer hold.
- Ellis County population projected at +36% by 2050 — long-run rental-demand tailwind backs the buy-and-hold thesis.
Negotiation context
- It's been on market 19 days — a 2% lower offer ($231k) is reasonable based on typical stale-listing flexibility.
- 14 sale attempts since 15y ago with the ask held roughly flat each time — persistent listings suggest the price (not the market) is what's stuck; bring a comps-based counter.
- Current owner paid $30k; list at $235k implies a 683% gain — meaningful room to come down on a strong offer.
Risks & watch-outs
- Watch-outs: property tax is 2.6% of price; built in 1940 — expect roof / HVAC / electrical / plumbing capex.
- Climate carrying-cost: major wind risk, 27% chance of damaging wind over 30y; extreme-heat days projected 7→24/yr by 2055 (HVAC capex compounding) — expect insurance premiums to compound above CPI over the hold.
Questions for the listing agent
- Built in 1940 — when were the roof, HVAC, electrical panel, plumbing, and water heater last replaced?
- Property tax is high relative to price — has the assessment been appealed recently, and will the sale trigger a re-assessment?
- Is there a deadline driving the sale (1031 exchange, divorce, estate, relocation)? That informs how much negotiation room exists.
- Schools are B-rated — typically a magnet for longer-tenancy family renters. What's the average tenant stay here, and is there a school-zone premium baked into asking?
- What's the average days-on-market for RENTAL listings here right now (not sales)? A rising rental-DOM trend means longer vacancies and softer asking-rent achievability than the comps imply.
- What's the recent tenant-quality profile in this submarket — average credit score on applications, eviction rate, late-payment / NSF rate, and stable-employment percentage? A property-management company in the area should have these aggregated.
- How much new for-sale + rental construction is in the pipeline within 1–3 miles? Heavy new supply typically softens prices + rents 12–24 months out; constrained supply supports both.
Investment metrics
- 1% rule
- 1.04% ✓
- Cap rate
- 6.82%
- Cash-on-cash
- 1.87%
- DSCR
- 1.08
- GRM
- 8.0
CMA / ARV
- ARV (median comp)
- $331,098
- List price
- $235,000
- Delta
- -29.02%
- Verdict
- UNDERPRICED
- Comps
- 20 within 1.0 mi
Show comp detail 10 sales within ~0.75 mi
| Address | Dist | Beds/Ba | Sqft | Sold | Price | $/sf | Match |
|---|---|---|---|---|---|---|---|
| 807 Wyatt St | 0.00mi | 4/3.0 | 2,522 (0%) | 0mo | $235,000 | $93 | 96 |
| 809 E Marvin Ave | 0.14mi | 3/3.5 (-1) | 2,472 (-2%) | 9mo | $419,000 | $169 | 71 |
| 1002 E Marvin Ave | 0.17mi | 3/2.0 (-1) | 2,488 (-1%) | 20mo | $350,000 | $141 | 68 |
| 709 E Jefferson St | 0.53mi | 3/2.0 (-1) | 2,490 (-1%) | 9mo | $115,000 | $46 | 60 |
| 706 Perry Ave | 0.46mi | 4/3.0 | 2,261 (-10%) | 1mo | $340,000 | $150 | 56 |
| 419 Coleman St | 0.43mi | 4/3.0 | 2,727 (+8%) | 7mo | $429,900 | $158 | 56 |
| 207 Williams St | 0.53mi | 4/4.0 | 2,724 (+8%) | 1mo | $600,000 | $220 | 54 |
| 600 Williams St | 0.57mi | 3/2.5 (-1) | 2,276 (-10%) | 3mo | $289,000 | $127 | 48 |
| 1410 E Marvin Ave | 0.62mi | 4/2.0 | 2,806 (+11%) | 14mo | $405,000 | $144 | 41 |
| 98 Kaufman St | 0.68mi | 3/4.5 (-1) | 2,648 (+5%) | 13mo | $498,000 | $188 | 34 |
Match score weights: distance 35% · size 25% · config 20% · recency 20%. Top-matched comps best support the ARV.
Projected returns pro-forma
-3.0% appreciation · 3.4% rent growth · sell at horizon
- IRR
- -12.7%
- Equity multiple
- 0.54×
- Total profit
- $-30,405
- Equity at exit
- $35,039
- IRR
- -2.9%
- Equity multiple
- 0.80×
- Total profit
- $-13,311
- Equity at exit
- $20,319
Cash invested: $65,800 (down + closing). Projections, not guarantees.
Landlord ↔ Tenant lean methodology
- Overall (STATE)
- 87 Strongly Landlord-Friendly
- State Texas
- 87 Strongly Landlord-Friendly · R+5
- County
- — inherits STATE
- City
- — inherits STATE
ZIP-level market 75165
- Home prices YoY
- -24.5%
- Rents YoY
- 3.4%
- Active inventory
- 854
- Price-to-rent
- 8.0×
Monthly cashflow live
- Estimated rent
- $2,451 high interval (Pro) →
- Mortgage (P&I)
- −$1,232
- Tax from tax record
- −$504 /mo · $6,044/yr
- Insurance
- −$98
- HOA
- −$0
- Vacancy / Maint / Mgmt
- −$515
- Net cashflow
- $102
Break-even live
UW: 25.0% down · 7.5% · 30yr · 1.5% tax · 5.0% vac · 8.0% maint · 8.0% mgmt
Financing live
Cash to close
- Down payment
- $58,750
- Closing costs
- $7,050
- Reserves months
- —
- Total cash needed
- —
Loan-product check · same deal, 3 products live
Conventional
25% down · 7.5% · 30yr
- Down + closing
- —
- Monthly P&I
- —
- Monthly cashflow
- —
- DSCR
- —
- Eligible?
- —
Personal DTI + credit; lowest rate.
DSCR
20% down · 8.5% · 30yr
- Down + closing
- —
- Monthly P&I
- —
- Monthly cashflow
- —
- DSCR
- —
- Eligible?
- —
No personal income docs; deal must DSCR.
Hard money
10% down · 12.0% · 12mo
- Down + closing
- —
- Monthly P&I
- —
- Monthly cashflow
- —
- DSCR
- —
- Eligible?
- —
Short-term bridge; refi at stabilization.
Rent comps 11 comps
| Address | Beds | Baths | Sqft | Rent | $/sqft | DOM | Units | Dist |
|---|---|---|---|---|---|---|---|---|
| 807 Wyatt St Waxahachie, TX | 4.0 | 3.0 | 2592 | $1,900 | $0.73 | 44d | 1 | 0.01mi |
| 710 Perry Ave Unit 1324866P Waxahachie, TX | 3.0 | 2.5 | 1894 | $4,304 | $2.27 | 7d | 1 | 0.47mi |
| 113 Church St Waxahachie, TX | 4.0 | 3.5 | 1892 | $2,800 | $1.48 | 1d | 1 | 0.61mi |
| 115 Church St Waxahachie, TX | 4.0 | 3.5 | 1914 | $2,800 | $1.46 | 7d | 1 | 0.61mi |
| 1539 Owen Way Waxahachie, TX | 4.0 | 2.0 | 2150 | $2,426 | $1.13 | 7d | 1 | 0.80mi |
| 1548 Woodlake Dr Waxahachie, TX | 4.0 | 2.0 | 1765 | $2,250 | $1.27 | 44d | 1 | 0.84mi |
| 542 Clearlake Dr Waxahachie, TX | 4.0 | 2.0 | 2296 | $2,550 | $1.11 | 44d | 1 | 0.97mi |
| 168 Verbena Dr Waxahachie, TX | 3.0–4.0 | 2.5 | 1842 | $2,579 | $1.40 | 1d | 7 | 1.03mi |
| 342 Leisure Ln Waxahachie, TX | 4.0 | 2.0 | 1755 | $2,250 | $1.28 | 12d | 1 | 1.14mi |
| 224 Patrick St Waxahachie, TX | 3.0 | 2.0 | 1766 | $2,250 | $1.27 | 7d | 1 | 1.43mi |
| 204 Overhill Dr Waxahachie, TX | 5.0 | 4.0 | 3155 | $3,300 | $1.05 | 44d | 1 | 1.50mi |
Listing history 47 events
-
2026-05-11price $1,800
-
2026-05-10price $237,000 1937-char remark
-
2026-05-08historical 1937-char remark
-
2026-05-08status Active 1937-char remark
-
2026-05-08$239,000 1937-char remark
-
2026-05-07historical
-
2026-05-03$1,900
-
2026-05-01price $239,000
-
2026-05-01status Active
-
2026-04-27historical $2,090
-
2026-04-24historical Active Option Contract
-
2026-04-23price $2,090
-
2026-04-21price $249,000
-
2026-04-18price $2,190
-
2026-04-11price $2,240
-
2026-04-09price $269,000
-
2026-04-06price $2,340
-
2026-04-02price $279,000
-
2026-03-31$285,000 Active
-
2026-03-25$2,440
-
2023-11-03historical $2,000
-
2023-10-17$2,000
-
2023-10-16historical
-
2023-09-28price $293,500
-
2023-09-11status Active
-
2023-08-23historical Active Option Contract
-
2023-07-31price $296,000
-
2023-05-15price $299,000
-
2023-04-21$299,900 Active
-
2023-03-14soldstatus
-
2022-12-06price $289,000
-
2022-11-17price $299,000
-
2022-11-02$319,900 Active
-
2022-05-13soldstatus Closed
-
2022-05-04historical
-
2022-05-02$299,900
-
2022-04-30historical
-
2022-04-22status Active
-
2022-04-08historical Active Option Contract
-
2022-03-18price $299,900
-
2022-02-19price $348,000
-
2022-01-31$365,000 Active
-
2019-10-07soldstatus $30,000
-
2011-11-18historical
-
2011-10-18price $59,900
-
2011-08-02price $69,900
-
2011-03-24$74,500 Active
ⓘ Source: listings_history table (triggers on properties + properties_extension) + one-shot
backfill from property_details.listing_events for pre-trigger history.
Tax reassessment forecast TX · Resets to sale price
- Current annual tax
- $6,044 · $504/mo
- Projected year-2 tax
- $6,044 · $504/mo
- Expected delta
- $0/yr ($0/mo · 0.0%)
ⓘ Screening estimate from a state-policy table — verify with the county assessor before closing.
Climate risk First Street
- Flood 1/10 Low FEMA zone X (unshaded) · 0% chance over 30 yrs
- Wildfire 4/10 Moderate
- Heat 7/10 Severe 7 d/yr ≥110°F today · 24 d/yr by 30 yrs out
- Wind 6/10 Major 27% chance of damaging wind over 30 yrs
- Air quality 2/10 Low 1 unhealthy d/yr today · 1 by 30 yrs out
Nearby sold comps map
Loading sold comps map…
Walkable amenities ~0.75 mi
Loading nearby amenities…
Taxation est. · year 1
- Rental income
- $29,412
- − Mortgage interest
- −$13,164
- − Property taxes
- −$6,044
- − Insurance
- −$1,175
- − Repairs & maintenance
- −$2,353
- − Management
- −$2,353
- − Depreciation
- −$6,836
- Taxable loss
- −$2,513
- Est. tax savings @ 24.0%
- +$603
- After-tax cash flow
- $1,831/yr
For passive investors: Depreciation is non-cash, so a rental often shows a tax loss while cash-flowing — sheltering income. Rental losses are passive: they offset passive income freely, and up to $25,000/yr can offset ordinary (W-2) income if you actively participate and your MAGI is under $100k (phasing out to $0 by $150k); unused losses carry forward. On sale, claimed depreciation is recaptured at up to 25%, and gains may owe capital-gains tax (a 1031 exchange can defer both). Figures are a year-1 estimate at your 24.0% rate — not tax advice; consult a CPA.
Schools (NCES district)
- District
- Waxahachie ISD
- NCES district ID
- 4844730
- Math proficiency
- 45% ▼ -7.00%
- Reading proficiency
- 44% ▼ -6.00%
- Median HH income
- $59,434
- Composite
- 39.14/100
- National rank
- #4034
- State rank
- #253 of 826 in TX
Livability — Waxahachie
- Score
- 78/100
- State rank
- #71
- US rank
- #2592
Category grades
Schools grade is shown separately in the Schools card above.
Census & demographics
- Census place
- Waxahachie, TX
- County
- Ellis County · 199,237 people
- City population
- 67,417
- Metro
- Dallas-Fort Worth-Arlington, TX
- Population (ZIP)
- 53,513
- Household income
- $86,391
- Rent vs Own
- Severe rent burden
- 1365.0
Population outlook (Ellis County) Hauer SSP2
- Today (2025)
- 194,556 people
- By 2030
- 209,679 · +7.8%
- By 2040
- 238,837 · +22.8%
- By 2050
- 265,451 · +36.4%
- By 2075
- 326,571 · +67.9%
- By 2100
- 362,156 · +86.1%
Race, ethnicity, and origin ACS 2023
- Neighborhood character
- Diverse neighborhood (Simpson 0.60)
- Race & ethnicity
- White 56% Hispanic / Latino 26% Black 14% Two or more races 13%
- Hispanic origin (detail)
- Mexican 22%
- Common ancestry
- Slovak 2% Lithuanian 2% Italian 2%
- Foreign-born
- 7% · Canada
- Languages at home
- 84% English-only · Spanish 15%
Political lean MEDSL · Ellis
- 2024 margin
- Solid R (+31.1) · D 34.0% · R 65.1%
- 2008→2024 swing
- +11.2pp toward D · 2008: -42.2pp · 2024: -31.1pp
- All cycles
- 2024: R+31.1 2020: R+34.1 2016: R+45.4 2012: R+47.5 2008: R+42.2
Not yet ingested
- Civics
- —
Market trends
- HPI YoY
- ▼ -82.58%
- Current HPI
- 255.0247
- Rent YoY
- ▲ 3.40%
- Metro
- Dallas-Fort Worth-Arlington, TX
- State GDP YoY
- ▲ 3.95%
- F500 in state
- 110
Industry mix (Fortune 500 HQ in TX)
| Industry | F500 HQs | Revenue |
|---|---|---|
| Energy | 16 | $1,198B |
|
||
| Technology | 5 | $198B |
|
||
| Engineering / Construction | 4 | $72B |
|
||
| Energy Services | 3 | $60B |
|
||
| Utilities | 3 | $41B |
|
||
| Healthcare | 2 | $330B |
|
||
Price history
-97.7% since first listed54 events — show timeline
- 2026-06-16 Sold (MLS) — NTREIS
- 2026-05-30 Rental Removed $1,700 SHOWMOJO
- 2026-05-28 Pending — NTREIS
- 2026-05-27 Price Changed $1,700 SHOWMOJO
- 2026-05-26 Price Changed $235,000 NTREIS
- 2026-05-22 Price Changed $1,750 SHOWMOJO
- 2026-05-20 Price Changed $236,000 NTREIS
- 2026-05-11 Price Changed $1,800 SHOWMOJO
- 2026-05-10 Price Changed $237,000 NTREIS
- 2026-05-08 Listing Removed — NTREIS
- 2026-05-08 Relisted — NTREIS
- 2026-05-08 Listed $239,000 NTREIS
- 2026-05-07 Listing Removed — NTREIS
- 2026-05-03 Listed for Rent $1,900 SHOWMOJO
- 2026-05-01 Price Changed $239,000 NTREIS
- 2026-05-01 Relisted — NTREIS
- 2026-04-27 Rental Removed $2,090 SHOWMOJO
- 2026-04-24 Contingent — NTREIS
- 2026-04-23 Price Changed $2,090 SHOWMOJO
- 2026-04-21 Price Changed $249,000 NTREIS
- 2026-04-18 Price Changed $2,190 SHOWMOJO
- 2026-04-11 Price Changed $2,240 SHOWMOJO
- 2026-04-09 Price Changed $269,000 NTREIS
- 2026-04-06 Price Changed $2,340 SHOWMOJO
- 2026-04-02 Price Changed $279,000 NTREIS
- 2026-03-31 Listed $285,000 NTREIS
- 2026-03-25 Listed for Rent $2,440 SHOWMOJO
- 2023-11-03 Rental Removed $2,000 NTREIS
- 2023-10-17 Listed for Rent $2,000 NTREIS
- 2023-10-16 Listing Removed — NTREIS
- 2023-09-28 Price Changed $293,500 NTREIS
- 2023-09-11 Relisted — NTREIS
- 2023-08-23 Contingent — NTREIS
- 2023-07-31 Price Changed $296,000 NTREIS
- 2023-05-15 Price Changed $299,000 NTREIS
- 2023-04-21 Listed $299,900 NTREIS
- 2023-03-14 Sold (Public Records) — Public Records
- 2022-12-06 Price Changed $289,000 NTREIS
- 2022-11-17 Price Changed $299,000 NTREIS
- 2022-11-02 Listed $319,900 NTREIS
- 2022-05-13 Sold (MLS) — NTREIS
- 2022-05-04 Listing Removed — NTREIS
- 2022-05-02 Listed $299,900 NTREIS
- 2022-04-30 Listing Removed — NTREIS
- 2022-04-22 Relisted — NTREIS
- 2022-04-08 Contingent — NTREIS
- 2022-03-18 Price Changed $299,900 NTREIS
- 2022-02-19 Price Changed $348,000 NTREIS
- 2022-01-31 Listed $365,000 NTREIS
- 2019-10-07 Sold (Public Records) $30,000 Public Records
- 2011-11-18 Listing Removed — NTREIS
- 2011-10-18 Price Changed $59,900 NTREIS
- 2011-08-02 Price Changed $69,900 NTREIS
- 2011-03-24 Listed $74,500 NTREIS
Property tax history
+14.0%/yrLatest (2025): $6,044 · +5.6% YoY. Source: county tax records.
Cash-flow waterfall
monthlySold comps — $/sqft
last 12 mo · ≤1 miLoading sold comps…