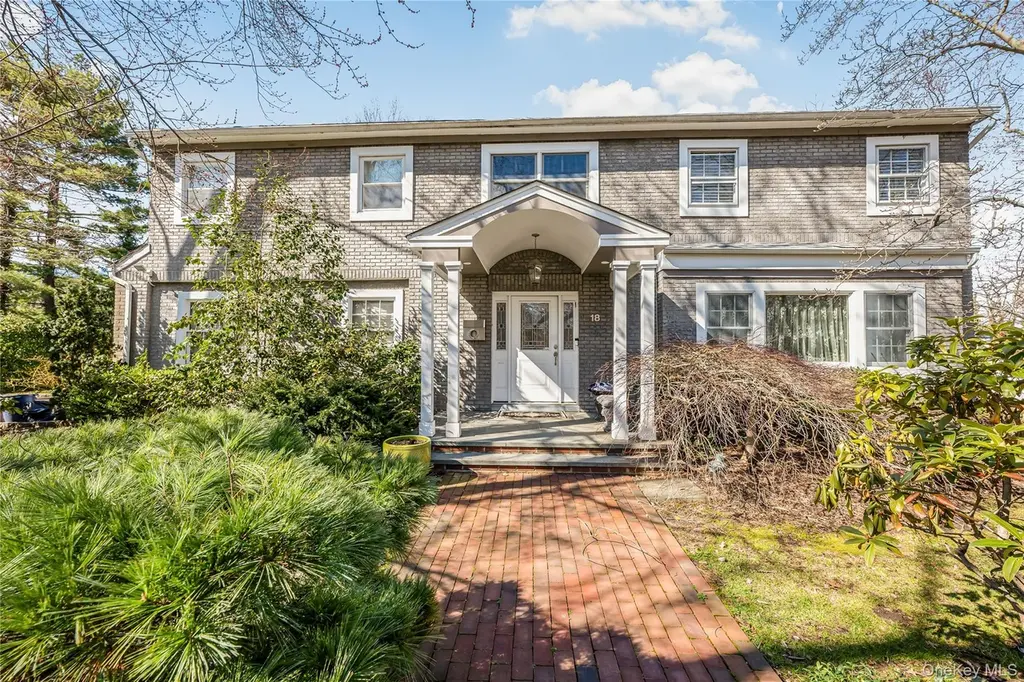
18 Woodland Rd · Flower Hill, NY
Flood risk 1/10 · Minimal
- FEMA flood zone
- X (unshaded)
- Chance of flooding over 30 yrs
- 0.0%
- Est. flood insurance / yr
- $473 – $860
Fire risk 1/10 · Minimal
- Est. fire insurance / yr
- $691 – $1,283
Heat risk 6/10 · Moderate
- Hot days now (above 98°F)
- 7 days/yr
- Hot days in 30 yrs
- 16 days/yr
Wind risk 6/10 · Moderate
- Chance of severe wind over 30 yrs
- 56.0%
Air-quality risk 4/10 · Minor
- Unhealthy air days now
- 6 days/yr
- Unhealthy air days in 30 yrs
- 7 days/yr
Risk factors via First Street. Map © Google.
Why this score? — see what drove the D+ grade
The composite is a weighted blend of 9 inputs, each scored 0–100. Each bar is that input's sub-score; the figure is the points it added to the 100-point composite (weight × sub-score).
- ARV discount +10.3/15.0
- Appreciation +8.7/10.0
- Schools +7.7/10.0
- Cash flow +7.0/30.0
- Livability +3.8/5.0
- Rent growth +2.5/5.0
- Condition / age +2.5/5.0
- 1% rule +1.6/10.0
- DSCR +1.2/10.0
$1,850,000
🖨 Deal sheet (PDF) 📄 Offer letter ✓ Due diligence
Listing remarks
Center hall colonial with 4 bedrooms and 2.5 baths measuring 3000 square feet with finished basement situated on . 34 acres of landscaped property located in Flower Hill Roslyn. Natural hardwood floors throughout with skylights and replacement windows. Kitchen with granite countertops and updated appliances. 2 car garage. Roslyn schools and Port Washington train sticker.
Key facts
- Updated appliances
- Landscaped property
- Finished basement
Tags
Neighborhood map
What this means for you Summary
Snapshot
- This is a 4-bed/2.5-bath single-family listed at $1.85M.
Deal economics
- At list price, monthly cash flow is $-3k ($-33k/yr) — negative.
- To cash-flow at today's rent, offer at most $1.37M (25.9% below list).
- To meet the 1% rule (rent ≥ 1% of price), the offer needs to be $1.22M (34.2% below list).
- Recommended offer: $1.22M (34.2% below list) — sets the bar for 1% rule.
Location & tenants
- Location reads 76/100 on livability (#212 in NY, #3,270 nationally) — a middle-class / working-renter tenant base. Strengths: crime A+, commute A+, employment A+; Watch: amenities D, cost of living F.
- Roslyn Union Free School District (suburban): math 83% / reading 82% proficiency, ranked #28 of 590 in NY (top 5%) — strong family-tenant draw, lease renewals of 3-5y typical; only 8% free/reduced lunch — higher-income household profile.
- Zoned schools: Harbor Hill School (math 83% / reading 82%, grade A+, #133 of 2,108 statewide, top 6%, 584 students, 10% FRL); Roslyn Middle School (math 78% / reading 82%, grade A+, #28 of 729 statewide, top 4%, 766 students, 16% FRL); Roslyn High School (math 97% / reading 87%, grade A+, #171 of 1,100 statewide, top 18%, 1,035 students, 15% FRL).
- Market conditions: 81 active listings in the ZIP; 3 comparable units currently listed for rent nearby; rentals at typical pace (median 24d on market — plan ~3-4 weeks tenant-placement turnaround); 824 units permitted in Nassau County in 2024 (153 in 5+ unit buildings).
Forward outlook
- In year one you build about $151k of equity ($13k loan paydown + $138k appreciation (7.5% local appreciation)).
- Nassau County population projected at +7% by 2050 — modest demand growth; plan on rents tracking national, not racing it.
- By year 2, paydown + projected appreciation supports a ~$242k cash-out refi (75% LTV) — recoverable capital for the next deal without selling this one.
Negotiation context
- Only 14 days on market — expect competitive offers; lowballing is unlikely to land.
- Current owner paid $1.15M; list at $1.85M implies a 61% gain — meaningful room to come down on a strong offer.
Risks & watch-outs
- Climate carrying-cost: major wind risk, 56% chance of damaging wind over 30y; extreme-heat days projected 7→16/yr by 2055 (HVAC capex compounding) — expect insurance premiums to compound above CPI over the hold.
Questions for the listing agent
- What do current leases actually rent for vs. the listed asking? Can we see a recent rent roll and the last 12 months of T-12 income?
- Built in 1968 — when were the roof, HVAC, electrical panel, plumbing, and water heater last replaced?
- Is there a deadline driving the sale (1031 exchange, divorce, estate, relocation)? That informs how much negotiation room exists.
- The area grade is low — what's the realistic commute time and amenity access for the typical tenant pool here? Any planned neighborhood developments (good or bad) we should know about?
- What's the average days-on-market for RENTAL listings here right now (not sales)? A rising rental-DOM trend means longer vacancies and softer asking-rent achievability than the comps imply.
- What's the recent tenant-quality profile in this submarket — average credit score on applications, eviction rate, late-payment / NSF rate, and stable-employment percentage? A property-management company in the area should have these aggregated.
- How much new for-sale + rental construction is in the pipeline within 1–3 miles? Heavy new supply typically softens prices + rents 12–24 months out; constrained supply supports both.
Investment metrics
- 1% rule
- 0.66% ✗
- Cap rate
- 4.54%
- Cash-on-cash
- -6.28%
- DSCR
- 0.72
- GRM
- 12.7
CMA / ARV
- ARV (on-the-fly)
- $1,972,212
- Comps found
- 12
Show comp detail 12 sales within ~0.75 mi
| Address | Dist | Beds/Ba | Sqft | Sold | Price | $/sf | Match |
|---|---|---|---|---|---|---|---|
| 44 Fernwood Ln | 0.28mi | 4/3.0 | 2,800 (-5%) | 11mo | $1,630,000 | $582 | 68 |
| 32 Barnard Pl | 0.67mi | 4/2.5 | 2,986 (+1%) | 3mo | $2,888,000 | $967 | 64 |
| 109 Country Club Dr | 0.40mi | 5/3.5 (+1) | 2,756 (-6%) | 0mo | $2,770,000 | $1,005 | 61 |
| 100 The Intervale | 0.52mi | 4/3.5 | 3,000 (+2%) | 12mo | $1,700,000 | $567 | 59 |
| 18 Bayberry Rdg | 0.26mi | 4/3.5 | 2,660 (-10%) | 12mo | $1,420,000 | $534 | 58 |
| 14 Ridge Dr E | 0.35mi | 5/2.0 (+1) | 2,679 (-9%) | 8mo | $1,450,000 | $541 | 55 |
| 83 Fernwood Ln | 0.38mi | 4/3.0 | 2,631 (-11%) | 9mo | $1,430,000 | $544 | 55 |
| 16 Ridge Dr E | 0.35mi | 5/2.0 (+1) | 2,543 (-14%) | 3mo | $1,245,000 | $490 | 51 |
| 448 Abbey Rd N | 0.75mi | 4/3.5 | 2,763 (-6%) | 2mo | $2,228,000 | $806 | 49 |
| 812 Hunt Ln | 0.68mi | 5/3.5 (+1) | 2,934 (-0%) | 11mo | $2,950,000 | $1,005 | 49 |
| 45 Pool Dr | 0.70mi | 4/2.5 | 2,756 (-6%) | 9mo | $1,845,000 | $669 | 49 |
| 38 Country Club Dr | 0.69mi | 4/4.5 | 3,276 (+11%) | 6mo | $2,950,000 | $900 | 36 |
Match score weights: distance 35% · size 25% · config 20% · recency 20%. Top-matched comps best support the ARV.
Projected returns pro-forma
7.48% appreciation · 3.0% rent growth · sell at horizon
- IRR
- 14.0%
- Equity multiple
- 2.02×
- Total profit
- $528,821
- Equity at exit
- $1,341,047
- IRR
- 14.1%
- Equity multiple
- 4.21×
- Total profit
- $1,662,170
- Equity at exit
- $2,602,744
Cash invested: $518,000 (down + closing). Projections, not guarantees.
Landlord ↔ Tenant lean methodology
- Overall (STATE)
- 15 Strongly Tenant-Friendly
- State New York
- 15 Strongly Tenant-Friendly · D+10
- County
- — inherits STATE
- City
- — inherits STATE
ZIP-level market 11576
- Home prices YoY
- 2.5%
- Active inventory
- 81
- Price-to-rent
- 12.7×
Monthly cashflow live
- Estimated rent
- $12,181 medium interval (Pro) →
- Mortgage (P&I)
- −$9,702
- Tax from tax record
- −$1,861 /mo · $22,327/yr
- Insurance
- −$771
- HOA
- −$0
- Vacancy / Maint / Mgmt
- −$2,558
- Net cashflow
- $-2,710
Break-even live
Sensitivity live
| Price | -10% $-1,663 | -5% $-2,186 | +0% $-2,710 | +5% $-3,234 | +10% $-3,757 |
|---|---|---|---|---|---|
| Rent | -10% $-3,672 | -5% $-3,191 | +0% $-2,710 | +5% $-2,229 | +10% $-1,748 |
| Rate | -1.0pp $-1,778 | -0.5pp $-2,239 | base $-2,710 | +0.5pp $-3,189 | +1.0pp $-3,677 |
UW: 25.0% down · 7.5% · 30yr · 1.5% tax · 5.0% vac · 8.0% maint · 8.0% mgmt
Financing live
Cash to close
- Down payment
- $462,500
- Closing costs
- $55,500
- Reserves months
- —
- Total cash needed
- —
Loan-product check · same deal, 3 products live
Conventional
25% down · 7.5% · 30yr
- Down + closing
- —
- Monthly P&I
- —
- Monthly cashflow
- —
- DSCR
- —
- Eligible?
- —
Personal DTI + credit; lowest rate.
DSCR
20% down · 8.5% · 30yr
- Down + closing
- —
- Monthly P&I
- —
- Monthly cashflow
- —
- DSCR
- —
- Eligible?
- —
No personal income docs; deal must DSCR.
Hard money
10% down · 12.0% · 12mo
- Down + closing
- —
- Monthly P&I
- —
- Monthly cashflow
- —
- DSCR
- —
- Eligible?
- —
Short-term bridge; refi at stabilization.
Rent comps 3 comps
| Address | Beds | Baths | Sqft | Rent | $/sqft | DOM | Units | Dist |
|---|---|---|---|---|---|---|---|---|
| 902 Mill Crk S #902 Roslyn, NY | 3.0 | 3.5 | 3172 | $12,000 | $3.78 | 24d | 1 | 0.75mi |
| 67 Short Way Roslyn Heights, NY | 3.0 | 3.5 | 3706 | $12,800 | $3.45 | 24d | 1 | 1.45mi |
| 106 Thayer Rd Manhasset, NY | 5.0 | 3.0 | 2793 | $12,000 | $4.30 | 0d | 1 | 1.46mi |
Listing history 4 events
-
2026-04-10status Pending
-
2026-03-24$1,850,000 Active
-
2004-12-22soldstatus $1,150,000
-
2002-08-30soldstatus $872,500
ⓘ Source: listings_history table (triggers on properties + properties_extension) + one-shot
backfill from property_details.listing_events for pre-trigger history.
Tax reassessment forecast NY · Partial reset (capped growth)
- Current annual tax
- $22,327 · $1,861/mo
- Projected year-2 tax
- $26,796 · $2,233/mo
- Expected delta
- +$4,469/yr (+$372/mo · 20.0%)
ⓘ Screening estimate from a state-policy table — verify with the county assessor before closing.
Climate risk First Street
- Flood 1/10 Low FEMA zone X (unshaded) · 0% chance over 30 yrs
- Wildfire 1/10 Low
- Heat 6/10 Major 7 d/yr ≥98°F today · 16 d/yr by 30 yrs out
- Wind 6/10 Major 56% chance of damaging wind over 30 yrs
- Air quality 4/10 Moderate 6 unhealthy d/yr today · 7 by 30 yrs out
Nearby sold comps map
Loading sold comps map…
Walkable amenities ~0.75 mi
Loading nearby amenities…
Taxation est. · year 1
- Rental income
- $146,173
- − Mortgage interest
- −$103,629
- − Property taxes
- −$22,327
- − Insurance
- −$9,250
- − Repairs & maintenance
- −$11,694
- − Management
- −$11,694
- − Depreciation
- −$53,818
- Taxable loss
- −$66,239
- Est. tax savings @ 24.0%
- +$15,897
- After-tax cash flow
- $-16,622/yr
For passive investors: Depreciation is non-cash, so a rental often shows a tax loss while cash-flowing — sheltering income. Rental losses are passive: they offset passive income freely, and up to $25,000/yr can offset ordinary (W-2) income if you actively participate and your MAGI is under $100k (phasing out to $0 by $150k); unused losses carry forward. On sale, claimed depreciation is recaptured at up to 25%, and gains may owe capital-gains tax (a 1031 exchange can defer both). Figures are a year-1 estimate at your 24.0% rate — not tax advice; consult a CPA.
Schools (NCES district)
- District
- Roslyn Union Free School District
- NCES district ID
- 3625050
- Math proficiency
- 83% ▼ -2.00%
- Reading proficiency
- 82% ▲ 3.00%
- Median HH income
- $128,640
- Composite
- 77.26/100
- National rank
- #101
- State rank
- #28 of 590 in NY
Livability — Flower Hill
- Score
- 76/100
- State rank
- #212
- US rank
- #3270
Category grades
Schools grade is shown separately in the Schools card above.
Census & demographics
- Census place
- Flower Hill, NY
- Population (ZIP)
- 12,796
Population outlook (Nassau County) Hauer SSP2
- Today (2025)
- 1,409,302 people
- By 2030
- 1,431,482 · +1.6%
- By 2040
- 1,471,607 · +4.4%
- By 2050
- 1,502,845 · +6.6%
- By 2075
- 1,575,403 · +11.8%
- By 2100
- 1,554,356 · +10.3%
Race, ethnicity, and origin ACS 2023
- Neighborhood character
- Predominantly White (69%)
- Race & ethnicity
- White 69% Asian 19% Hispanic / Latino 6% Two or more races 2% Black 1%
- Hispanic origin (detail)
- Puerto Rican 3%
- Common ancestry
- Romanian 11% Scotch-Irish 7% Italian 3%
- Foreign-born
- 24% · Canada, China, South Korea
- Languages at home
- 71% English-only · Other Indo-European 11% Korean 4% Chinese 4%
Political lean MEDSL · Nassau
- 2024 margin
- Toss-up / Even · D 47.9% · R 52.1%
- 2008→2024 swing
- -12.6pp toward R · 2008: 8.4pp · 2024: -4.2pp
- All cycles
- 2024: R+4.2 2020: D+9.5 2016: D+5.3 2012: D+6.7 2008: D+8.4
Not yet ingested
- Civics
- —
Market trends
- HPI YoY
- ▲ 7.48%
- Current HPI
- 305.952
- Rent YoY
- —
- Metro
- —
- State GDP YoY
- ▲ 2.60%
- F500 in state
- 92
Industry mix (Fortune 500 HQ in NY)
| Industry | F500 HQs | Revenue |
|---|---|---|
| Financial Services | 10 | $950B |
|
||
| Consumer Goods | 9 | $162B |
|
||
| Insurance | 4 | $225B |
|
||
| Telecommunications | 2 | $144B |
|
||
| Pharmaceuticals | 2 | $112B |
|
||
| Media / Entertainment | 2 | $69B |
|
||
Price history
+112.0% since first listed4 events — show timeline
- 2026-04-10 Pending — OneKey® MLS as Distributed by MLS Grid
- 2026-03-24 Listed $1,850,000 OneKey® MLS as Distributed by MLS Grid
- 2004-12-22 Sold (Public Records) $1,150,000 Public Records
- 2002-08-30 Sold (Public Records) $872,500 Public Records
Property tax history
+0.9%/yrLatest (2024): $22,327 · +6.9% YoY. Source: county tax records.
Cash-flow waterfall
monthlySold comps — $/sqft
last 12 mo · ≤1 miLoading sold comps…