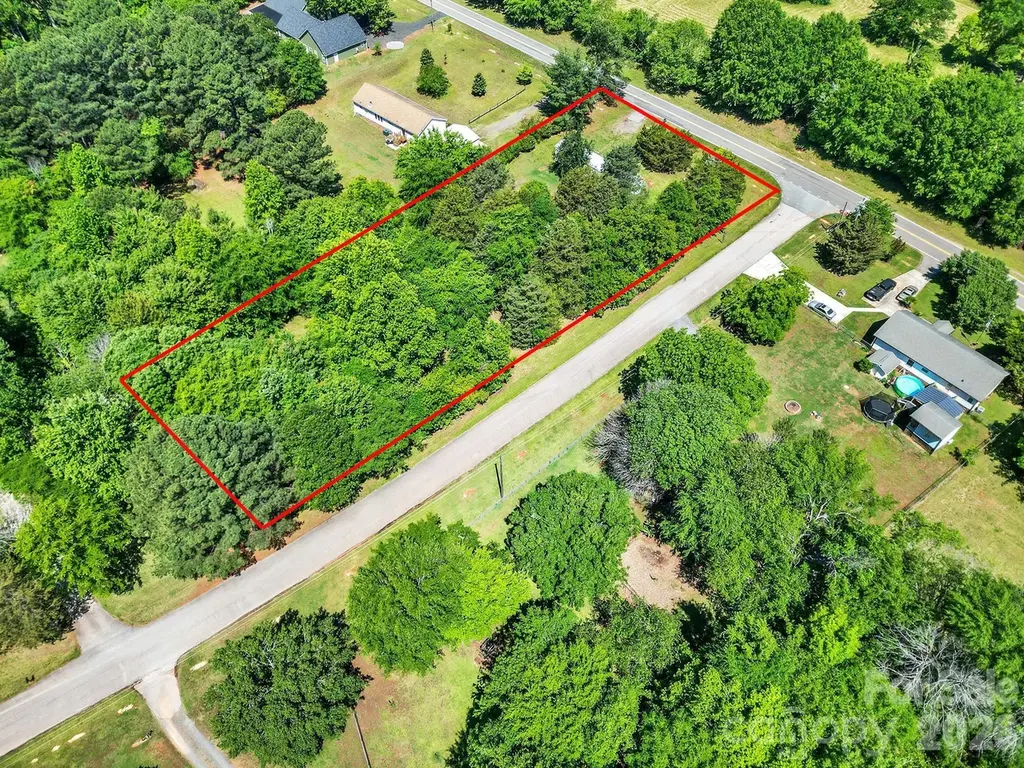
6067 Lake Wylie Rd · Lake Wylie, SC
Flood risk 1/10 · Minimal
- FEMA flood zone
- X (unshaded)
- Chance of flooding over 30 yrs
- 0.0%
- Est. flood insurance / yr
- $507 – $1,088
Fire risk 3/10 · Minor
- Est. fire insurance / yr
- $783 – $1,453
Heat risk 6/10 · Moderate
- Hot days now (above 105°F)
- 7 days/yr
- Hot days in 30 yrs
- 16 days/yr
Wind risk 6/10 · Moderate
- Chance of severe wind over 30 yrs
- 27.0%
Air-quality risk 3/10 · Minor
- Unhealthy air days now
- 3 days/yr
- Unhealthy air days in 30 yrs
- 3 days/yr
Risk factors via First Street. Map © Google.
Why this score? — see what drove the D grade
The composite is a weighted blend of 9 inputs, each scored 0–100. Each bar is that input's sub-score; the figure is the points it added to the 100-point composite (weight × sub-score).
- Cash flow +13.1/30.0
- ARV discount +7.5/15.0
- Schools +5.4/10.0
- DSCR +3.9/10.0
- Livability +3.4/5.0
- 1% rule +2.8/10.0
- Rent growth +2.7/5.0
- Condition / age +2.5/5.0
- Appreciation +0.0/10.0
$280,000
🖨 Deal sheet (PDF) 📄 Offer letter ✓ Due diligence
Key facts
- 1.7 acre lot
- Built 1995
- Listed 53 days
Property features AI
Finance
- Other: Property located on 1.7 acres
- HOA & community: No HOA
Exterior
- Parking: Driveway
- Utilities: Well water; Septic system
- Home design: Manufactured singlewide residential home; One story; Crawl space foundation
- Construction: Manufactured construction; Aluminum exterior
- Exterior features: Gravel and paved road access; Publicly maintained road
Interior
- Kitchen: Electric cooktop
- Bedrooms: 3 bedrooms (all on the main level)
- Bathrooms: 2 full bathrooms (both on the main level)
- Heating & cooling: Electric heating; Central air conditioning
- Interior features: Electric cooktop; 1 total room
- Laundry & utility: Electric dryer hookup
Neighborhood map
What this means for you Summary
Snapshot
- This is a 3-bed/2.0-bath single-family listed at $280k.
Deal economics
- At list price, monthly cash flow is $-12 ($-147/yr) — negative.
- To cash-flow at today's rent, offer at most $278k (0.8% below list).
- To meet the 1% rule (rent ≥ 1% of price), the offer needs to be $218k (22.2% below list).
- Recommended offer: $218k (22.2% below list) — sets the bar for 1% rule.
- Cap rate 6.2% vs local median 2.5% in Lake Wylie — top-decile yield for the area; either an underpriced asset or a hidden risk that comps aren't pricing in. Stress-test before assuming the spread holds.
Location & tenants
- Location reads 68/100 on livability (#85 in SC) — a middle-class / working-renter tenant base. Strengths: employment A+, housing A+, crime A; Watch: cost of living D, amenities F, commute F.
- York 02 (rural): math 61% / reading 63% proficiency, ranked #2 of 80 in SC (top 2%) — acceptable for families but not a draw, mixed tenant base, ~2y average lease.
- Zoned schools: Bethel Elementary (math 57% / reading 67%, grade B, #73 of 597 statewide, top 12%, 340 students, 27% FRL); Oakridge Middle (math 60% / reading 62%, grade B+, #12 of 229 statewide, top 5%, 1,154 students, 26% FRL); Clover High (math 86% / reading 94%, grade A+, #4 of 196 statewide, top 2%, 2,685 students, 35% FRL) — zoned schools at 29% FRL track the district average.
- Market conditions: Rents flat; 359 active listings in the ZIP; 1 comparable units currently listed for rent nearby; solid renter incomes; 2,550 units permitted in York County in 2024 (350 in 5+ unit buildings).
Forward outlook
- Local home prices are declining (-3.0%/yr); year-one equity from $2k of loan paydown is wiped out by about $8k of value loss. Plan a longer hold.
- York County population projected at +44% by 2050 — long-run rental-demand tailwind backs the buy-and-hold thesis.
Negotiation context
- It's been on market 54 days — a 3% lower offer ($272k) is reasonable based on typical stale-listing flexibility.
- Current owner paid $45k; list at $280k implies a 522% gain — meaningful room to come down on a strong offer.
Risks & watch-outs
- Climate carrying-cost: major wind risk, 27% chance of damaging wind over 30y; extreme-heat days projected 7→16/yr by 2055 (HVAC capex compounding) — expect insurance premiums to compound above CPI over the hold.
Questions for the listing agent
- What do current leases actually rent for vs. the listed asking? Can we see a recent rent roll and the last 12 months of T-12 income?
- It's been on market 54 days. Have you received any prior offers? Is the seller open to a 22% concession, seller financing, or rate buy-down credit?
- Is there a deadline driving the sale (1031 exchange, divorce, estate, relocation)? That informs how much negotiation room exists.
- The area grade is low — what's the realistic commute time and amenity access for the typical tenant pool here? Any planned neighborhood developments (good or bad) we should know about?
- What's the average days-on-market for RENTAL listings here right now (not sales)? A rising rental-DOM trend means longer vacancies and softer asking-rent achievability than the comps imply.
- What's the recent tenant-quality profile in this submarket — average credit score on applications, eviction rate, late-payment / NSF rate, and stable-employment percentage? A property-management company in the area should have these aggregated.
- How much new for-sale + rental construction is in the pipeline within 1–3 miles? Heavy new supply typically softens prices + rents 12–24 months out; constrained supply supports both.
Investment metrics
- 1% rule
- 0.78% ✗
- Cap rate
- 6.24%
- Cash-on-cash
- -0.19%
- DSCR
- 0.99
- GRM
- 10.7
CMA / ARV
No comps found within radius.
Projected returns pro-forma
-3.0% appreciation · 0.88% rent growth · sell at horizon
- IRR
- -18.8%
- Equity multiple
- 0.35×
- Total profit
- $-50,797
- Equity at exit
- $41,749
- IRR
- -15.8%
- Equity multiple
- 0.19×
- Total profit
- $-63,510
- Equity at exit
- $24,209
Cash invested: $78,400 (down + closing). Projections, not guarantees.
Landlord ↔ Tenant lean methodology
- Overall (STATE)
- 90 Strongly Landlord-Friendly
- State South Carolina
- 90 Strongly Landlord-Friendly · R+6
- County
- — inherits STATE
- City
- — inherits STATE
ZIP-level market 29710
- Rents YoY
- 0.9%
- Active inventory
- 359
- Price-to-rent
- 10.7×
Monthly cashflow live
- Estimated rent
- $2,179 medium interval (Pro) →
- Mortgage (P&I)
- −$1,468
- Tax from tax record
- −$149 /mo · $1,783/yr
- Insurance
- −$117
- HOA
- −$0
- Vacancy / Maint / Mgmt
- −$458
- Net cashflow
- $-12
Break-even live
Sensitivity live
| Price | -10% $146 | -5% $67 | +0% $-12 | +5% $-92 | +10% $-171 |
|---|---|---|---|---|---|
| Rent | -10% $-184 | -5% $-98 | +0% $-12 | +5% $74 | +10% $160 |
| Rate | -1.0pp $129 | -0.5pp $59 | base $-12 | +0.5pp $-85 | +1.0pp $-159 |
UW: 25.0% down · 7.5% · 30yr · 1.5% tax · 5.0% vac · 8.0% maint · 8.0% mgmt
Financing live
Cash to close
- Down payment
- $70,000
- Closing costs
- $8,400
- Reserves months
- —
- Total cash needed
- —
Loan-product check · same deal, 3 products live
Conventional
25% down · 7.5% · 30yr
- Down + closing
- —
- Monthly P&I
- —
- Monthly cashflow
- —
- DSCR
- —
- Eligible?
- —
Personal DTI + credit; lowest rate.
DSCR
20% down · 8.5% · 30yr
- Down + closing
- —
- Monthly P&I
- —
- Monthly cashflow
- —
- DSCR
- —
- Eligible?
- —
No personal income docs; deal must DSCR.
Hard money
10% down · 12.0% · 12mo
- Down + closing
- —
- Monthly P&I
- —
- Monthly cashflow
- —
- DSCR
- —
- Eligible?
- —
Short-term bridge; refi at stabilization.
Rent comps 1 comps
| Address | Beds | Baths | Sqft | Rent | $/sqft | DOM | Units | Dist |
|---|---|---|---|---|---|---|---|---|
| 368 Sublime Summer LN Clover, SC | 3.0 | 1.0–2.0 | 1056 | $2,851 | $2.70 | 0d | 86 | 0.88mi |
Listing history 18 events
-
2026-06-21days on market $280,000 Active 54 DOM
-
2026-06-18days on market $280,000 Active 51 DOM
-
2026-06-17days on market $280,000 Active 50 DOM
-
2026-06-16days on market $280,000 Active 49 DOM
-
2026-06-15days on market $280,000 Active 48 DOM
-
2026-06-13days on market $280,000 Active 46 DOM
-
2026-06-13days on market $280,000 Active 45 DOM
-
2026-06-09days on market $280,000 Active 42 DOM
-
2026-06-08days on market $280,000 Active 41 DOM
-
2026-06-07days on market $280,000 Active 40 DOM
-
2026-06-04days on market $280,000 Active 37 DOM
-
2026-06-03days on market $280,000 Active 36 DOM
-
2026-06-02days on market $280,000 Active 35 DOM
-
2026-06-01days on market $280,000 Active 34 DOM
-
2026-05-31days on market $280,000 Active 33 DOM
-
2026-04-29$280,000 Active
-
2026-04-25historical $280,000
-
2010-02-19soldstatus $45,000
ⓘ Source: listings_history table (triggers on properties + properties_extension) + one-shot
backfill from property_details.listing_events for pre-trigger history.
Tax reassessment forecast SC · Resets to sale price
- Current annual tax
- $1,783 · $149/mo
- Projected year-2 tax
- $1,783 · $149/mo
- Expected delta
- $0/yr ($0/mo · 0.0%)
ⓘ Screening estimate from a state-policy table — verify with the county assessor before closing.
Climate risk First Street
- Flood 1/10 Low FEMA zone X (unshaded) · 0% chance over 30 yrs
- Wildfire 3/10 Moderate
- Heat 6/10 Major 7 d/yr ≥105°F today · 16 d/yr by 30 yrs out
- Wind 6/10 Major 27% chance of damaging wind over 30 yrs
- Air quality 3/10 Moderate 3 unhealthy d/yr today · 3 by 30 yrs out
Nearby sold comps map
Loading sold comps map…
Walkable amenities ~0.75 mi
Loading nearby amenities…
Taxation est. · year 1
- Rental income
- $26,147
- − Mortgage interest
- −$15,684
- − Property taxes
- −$1,783
- − Insurance
- −$1,400
- − Repairs & maintenance
- −$2,092
- − Management
- −$2,092
- − Depreciation
- −$8,145
- Taxable loss
- −$5,050
- Est. tax savings @ 24.0%
- +$1,212
- After-tax cash flow
- $1,064/yr
For passive investors: Depreciation is non-cash, so a rental often shows a tax loss while cash-flowing — sheltering income. Rental losses are passive: they offset passive income freely, and up to $25,000/yr can offset ordinary (W-2) income if you actively participate and your MAGI is under $100k (phasing out to $0 by $150k); unused losses carry forward. On sale, claimed depreciation is recaptured at up to 25%, and gains may owe capital-gains tax (a 1031 exchange can defer both). Figures are a year-1 estimate at your 24.0% rate — not tax advice; consult a CPA.
Schools (NCES district)
- District
- York 02
- NCES district ID
- 4503840
- Math proficiency
- 61% ▼ -4.00%
- Reading proficiency
- 63% ▲ 3.00%
- Median HH income
- $60,598
- Composite
- 53.74/100
- National rank
- #1421
- State rank
- #2 of 80 in SC
Livability — Lake Wylie
- Score
- 68/100
- State rank
- #85
- US rank
- #9884
Category grades
Schools grade is shown separately in the Schools card above.
Census & demographics
- Census place
- Lake Wylie, SC
- County
- York County · 281,758 people
- Metro
- Charlotte-Concord-Gastonia, NC-SC
- Population (ZIP)
- 40,595
- Household income
- $96,563
- Rent vs Own
- Severe rent burden
- 569.0
Population outlook (York County) Hauer SSP2
- Today (2025)
- 307,757 people
- By 2030
- 335,979 · +9.2%
- By 2040
- 391,378 · +27.2%
- By 2050
- 443,234 · +44.0%
- By 2075
- 557,102 · +81.0%
- By 2100
- 625,837 · +103.4%
Race, ethnicity, and origin ACS 2023
- Neighborhood character
- Predominantly White (77%)
- Race & ethnicity
- White 77% Black 10% Hispanic / Latino 8% Two or more races 7%
- Hispanic origin (detail)
- Mexican 2% Cuban 1%
- Common ancestry
- Serbian 4% Slovak 3% Romanian 2%
- Foreign-born
- 4% · Canada, Jamaica
- Languages at home
- 94% English-only · Spanish 4% Other Indo-European 1%
Political lean MEDSL · York
- 2024 margin
- R (+19.1) · D 39.7% · R 58.8% · Other 1.5%
- 2008→2024 swing
- -1.4pp toward R · 2008: -17.7pp · 2024: -19.1pp
- All cycles
- 2024: R+19.1 2020: R+16.5 2016: R+22.1 2012: R+20.5 2008: R+17.7
Not yet ingested
- Civics
- —
Market trends
- HPI YoY
- ▼ -194.83%
- Current HPI
- 252.3011
- Rent YoY
- ▲ 0.88%
- Metro
- Charlotte-Concord-Gastonia, NC-SC
- State GDP YoY
- ▲ 4.51%
- F500 in state
- 2
Industry mix (Fortune 500 HQ in SC)
| Industry | F500 HQs | Revenue |
|---|---|---|
| Packaging | 1 | $7B |
|
||
Price history
+522.2% since first listed3 events — show timeline
- 2026-04-29 Listed $280,000 CANOPYMLS as Distributed by MLS Grid
- 2026-04-25 Coming Soon $280,000 CANOPYMLS as Distributed by MLS Grid
- 2010-02-19 Sold (Public Records) $45,000 Public Records
Property tax history
+4.5%/yrLatest (2025): $1,783 · +18.3% YoY. Source: county tax records.
Cash-flow waterfall
monthlySold comps — $/sqft
last 12 mo · ≤1 miLoading sold comps…