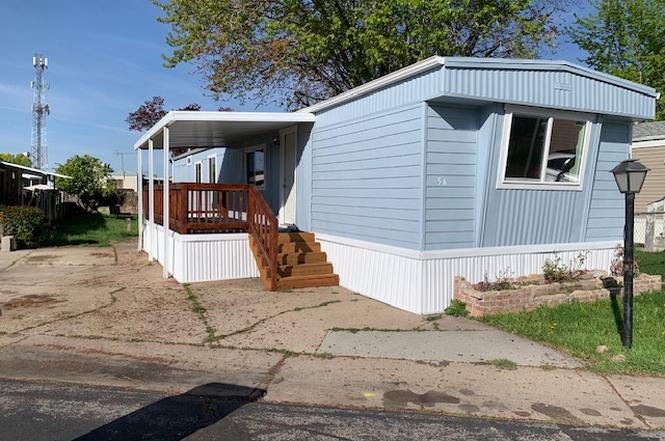
1500 N Angel W #56 · Layton, UT
Flood risk 1/10 · Minimal
- FEMA flood zone
- X (unshaded)
- Chance of flooding over 30 yrs
- 0.0%
- Est. flood insurance / yr
- $507 – $1,088
Fire risk 1/10 · Minimal
- Est. fire insurance / yr
- $453 – $841
Heat risk 4/10 · Minor
- Hot days now (above 94°F)
- 7 days/yr
- Hot days in 30 yrs
- 18 days/yr
Wind risk 1/10 · Minimal
- Chance of severe wind over 30 yrs
- —
Air-quality risk 4/10 · Minor
- Unhealthy air days now
- 5 days/yr
- Unhealthy air days in 30 yrs
- 7 days/yr
Risk factors via First Street. Map © Google.
Why this score? — see what drove the D grade
The composite is a weighted blend of 9 inputs, each scored 0–100. Each bar is that input's sub-score; the figure is the points it added to the 100-point composite (weight × sub-score).
- 1% rule +10.0/10.0
- ARV discount +7.5/15.0
- Cash flow +7.3/30.0
- Livability +4.3/5.0
- Schools +4.1/10.0
- Condition / age +4.0/5.0
- Rent growth +2.8/5.0
- DSCR +1.5/10.0
- Appreciation +0.0/10.0
$57,900
🖨 Deal sheet 📄 Offer letter ✓ Due diligence
Listing remarks
Mountain View Estates features a Beautifully remodeled Mobile Home in an Incredible Location. . nice, Private, and cozy setting but convenient to nearly everything. . Shopping, Eateries, Layton Hills Mall, Wall Mart, Schools, Parks and major roadways. New Roof, New Double Pane Windows, New Switch AC/Heat Unit, Freshly remodeled kitchen with Quartz Counters, Updated Bathrooms with Tiled Shower Stalls and LVP Floors throughout. Park has picnic, kids playground and dog friendly play area. Home is To Be Sold in AS IS Condition with No Warranties. Possible Financing with TruPath, NorthStar Mortgage or 21t Mortgage.
Key facts
- Quartz counters
- Double pane windows
- New roof
Tags
Property features AI
Finance
- Other: Subdivision: MOUNTAIN VIEW ESTATES MOBILE
- HOA & community: Homeowners association (monthly fee); Association name: Linda; Association fee: $1,000 monthly
Exterior
- Parking: Two open, uncovered parking spaces (total 2 spaces)
- Utilities: Natural gas available; Electricity connected; Sewer connected; Culinary (municipal) water
- Home design: Mobile home; Built/standing condition
- Construction: Aluminum exterior; Rubber roof; Above-grade finished living area (938)
- Exterior features: Covered deck; Paved road access; Flat terrain with full landscaping
Interior
- Kitchen: Microwave; Refrigerator; Free-standing range/oven; Garbage disposal
- Bedrooms: Three main-level bedrooms; Primary bedroom on the 1st floor
- Bathrooms: Two three-quarter bathrooms
- Heating & cooling: Gas central heating
- Interior features: Garbage disposal; Free-standing range/oven; Double-pane windows
- Laundry & utility: Washer; Dryer
Neighborhood map
What this means for you Summary
Snapshot
- This is a 3-bed/2.0-bath manufactured listed at $58k. Condition is rated good.
Deal economics
- At list price, monthly cash flow is $-77 ($-923/yr) — negative.
- To cash-flow at today's rent, offer at most $47k (19.2% below list).
- Meets the 1% rule at list price ($2k rent vs $58k).
- Recommended offer: $47k (19.2% below list) — sets the bar for cash-flow.
Location & tenants
- Location reads 86/100 on livability (#11 in UT, #457 nationally) — a professional / high-income tenant draw. Strengths: commute A+, employment A+, housing A+.
- Davis District (suburban): math 43% / reading 47% proficiency, ranked #28 of 80 in UT (top 35%) — families likely to look elsewhere, expect single-tenant / working-renter base with shorter leases; only 19% free/reduced lunch — higher-income household profile.
- Zoned schools: Vae View School (math 17% / reading 17%, grade F, #542 of 585 statewide, top 93%, 340 students, 51% FRL); North Davis Jr High (math 30% / reading 34%, grade F, #101 of 138 statewide, top 73%, 924 students, 46% FRL); Northridge High (math 24% / reading 43%, grade F, #106 of 171 statewide, top 62%, 1,954 students, 23% FRL) — zoned schools average 40% FRL vs 19% district-wide (22 pts higher); higher-poverty schools than district average — tighter screening recommended.
- Zoned-school proficiency averages 28% at this address vs 45% district-wide (-18 pts) — the specific schools serving this property underperform the Davis District average; the district grade overstates school quality for this exact location.
- Market conditions: Rents rising (+1.3%/yr); 342 active listings in the ZIP; 19 comparable units currently listed for rent nearby; rentals at typical pace (median 14d on market — plan ~3-4 weeks tenant-placement turnaround); solid renter incomes; 1,461 units permitted in Davis County in 2024 (508 in 5+ unit buildings).
Forward outlook
- Local home prices are declining (-3.0%/yr); year-one equity from $400 of loan paydown is wiped out by about $2k of value loss. Plan a longer hold.
- Davis County population projected at +39% by 2050 — long-run rental-demand tailwind backs the buy-and-hold thesis.
Negotiation context
- It's been on market 31 days — a 3% lower offer ($56k) is reasonable based on typical stale-listing flexibility.
- 2 sale attempts with the ask held roughly flat each time — persistent listings suggest the price (not the market) is what's stuck; bring a comps-based counter.
Risks & watch-outs
- Watch-outs: HOA is 60% of rent.
Questions for the listing agent
- What do current leases actually rent for vs. the listed asking? Can we see a recent rent roll and the last 12 months of T-12 income?
- It's been on market 31 days. Have you received any prior offers? Is the seller open to a 19% concession, seller financing, or rate buy-down credit?
- Built in 1979 — when were the roof, HVAC, electrical panel, plumbing, and water heater last replaced?
- What does the HOA fee cover, when was the last increase, and are there any pending special assessments or reserve-fund shortfalls?
- Is there a deadline driving the sale (1031 exchange, divorce, estate, relocation)? That informs how much negotiation room exists.
- Schools are B-rated — typically a magnet for longer-tenancy family renters. What's the average tenant stay here, and is there a school-zone premium baked into asking?
- The area grade is low — what's the realistic commute time and amenity access for the typical tenant pool here? Any planned neighborhood developments (good or bad) we should know about?
- What's the average days-on-market for RENTAL listings here right now (not sales)? A rising rental-DOM trend means longer vacancies and softer asking-rent achievability than the comps imply.
- What's the recent tenant-quality profile in this submarket — average credit score on applications, eviction rate, late-payment / NSF rate, and stable-employment percentage? A property-management company in the area should have these aggregated.
- How much new for-sale + rental construction is in the pipeline within 1–3 miles? Heavy new supply typically softens prices + rents 12–24 months out; constrained supply supports both.
Investment metrics
- 1% rule
- 2.89% ✓
- Cap rate
- 4.70%
- Cash-on-cash
- -5.69%
- DSCR
- 0.75
- GRM
- 2.9
CMA / ARV
No comps found within radius.
Projected returns pro-forma
-3.0% appreciation · 1.3% rent growth · sell at horizon
- IRR
- -32.5%
- Equity multiple
- -0.02×
- Total profit
- $-16,460
- Equity at exit
- $8,633
- IRR
- -91.0%
- Equity multiple
- -0.80×
- Total profit
- $-29,215
- Equity at exit
- $5,006
Cash invested: $16,212 (down + closing). Projections, not guarantees.
Landlord ↔ Tenant lean methodology
- Overall (STATE)
- 86 Strongly Landlord-Friendly
- State Utah
- 86 Strongly Landlord-Friendly · R+15
- County
- — inherits STATE
- City
- — inherits STATE
ZIP-level market 84041
- Rents YoY
- 1.3%
- Active inventory
- 342
- Price-to-rent
- 2.9×
Monthly cashflow live
- Estimated rent
- $1,675 high interval (Pro) →
- Mortgage (P&I)
- −$304
- Tax est. 1.5%
- −$72 /mo · $868/yr
- Insurance
- −$24
- HOA
- −$1,000
- Vacancy / Maint / Mgmt
- −$352
- Net cashflow
- $-77
Break-even live
UW: 25.0% down · 7.5% · 30yr · 1.5% tax · 5.0% vac · 8.0% maint · 8.0% mgmt
Financing live
Cash to close
- Down payment
- $14,475
- Closing costs
- $1,737
- Reserves months
- —
- Total cash needed
- —
Loan-product check · same deal, 3 products live
Conventional
25% down · 7.5% · 30yr
- Down + closing
- —
- Monthly P&I
- —
- Monthly cashflow
- —
- DSCR
- —
- Eligible?
- —
Personal DTI + credit; lowest rate.
DSCR
20% down · 8.5% · 30yr
- Down + closing
- —
- Monthly P&I
- —
- Monthly cashflow
- —
- DSCR
- —
- Eligible?
- —
No personal income docs; deal must DSCR.
Hard money
10% down · 12.0% · 12mo
- Down + closing
- —
- Monthly P&I
- —
- Monthly cashflow
- —
- DSCR
- —
- Eligible?
- —
Short-term bridge; refi at stabilization.
Rent comps 19 comps
| Address | Beds | Baths | Sqft | Rent | $/sqft | DOM | Units | Dist |
|---|---|---|---|---|---|---|---|---|
| 1505 N Angel St Layton, UT | 2.0 | 1.5 | 1100 | $1,417 | $1.29 | 14d | 3 | 0.13mi |
| 1600 N 1575 W Layton, UT | 1.0–2.0 | 1.0–2.0 | 842 | $1,800 | $2.14 | 14d | 8 | 0.24mi |
| 1560 N Main St Layton, UT | 1.0–2.0 | 1.0–2.0 | 1125 | $1,400 | $1.24 | 23d | 8 | 0.27mi |
| 1428 W 1650 N Layton, UT | 2.0 | 1.5 | 1000 | $1,350 | $1.35 | 23d | 1 | 0.28mi |
| 1475 N Main St Layton, UT | 1.0–3.0 | 1.0–2.0 | 960 | $1,906 | $1.99 | 13d | 18 | 0.32mi |
| 1448 W 1650 N Unit 3 Layton, UT | 2.0 | 1.0 | 819 | $1,120 | $1.37 | 14d | 1 | 0.32mi |
| 1125 N Main St Layton, UT | 1.0–3.0 | 1.0–2.0 | 1075 | $1,644 | $1.53 | 14d | 10 | 0.34mi |
| 1737 N 1450 W Layton, UT | 2.0 | 1.0 | 750 | $1,250 | $1.67 | 23d | 1 | 0.38mi |
| 1814 N 700 W Layton, UT | 1.0–2.0 | 1.0–2.0 | 838 | $1,734 | $2.07 | 14d | 10 | 0.48mi |
| 540 W 1425 N Layton, UT | 1.0–2.0 | 1.0–2.0 | 600 | $1,475 | $2.46 | 13d | 8 | 0.51mi |
| 1150 W 825 N Layton, UT | 1.0–3.0 | 1.0–2.0 | 999 | $1,850 | $1.85 | 14d | 7 | 0.66mi |
| 1656 N 400 W Layton, UT | 1.0–2.0 | 1.0–1.5 | 848 | $1,584 | $1.87 | 14d | 10 | 0.69mi |
| 1300 S 1800 E Clearfield, UT | 1.0–3.0 | 1.0–2.0 | 1113 | $2,197 | $1.97 | 14d | 20 | 1.08mi |
| 2075 N Main St Layton, UT | 1.0–3.0 | 1.0–2.0 | 1062 | $1,695 | $1.60 | 13d | 13 | 1.10mi |
| 1200 S 1500 E Clearfield, UT | 1.0–2.0 | 1.0 | 815 | $1,260 | $1.55 | 13d | 18 | 1.13mi |
| 1100 S 2000 E Clearfield, UT | 1.0–3.0 | 1.0–2.0 | 895 | $1,952 | $2.18 | 13d | 32 | 1.21mi |
| 2525 N Hill Field Rd Layton, UT | 2.0 | 1.0 | 775 | $1,659 | $2.14 | 23d | 1 | 1.29mi |
| 900 S 1500 E Clearfield, UT | 1.0–3.0 | 1.0–2.5 | 1175 | $1,855 | $1.58 | 13d | 7 | 1.42mi |
| 1902 E 700 S Clearfield, UT | 1.0–3.0 | 1.0–2.0 | 1085 | $2,415 | $2.23 | 13d | 21 | 1.43mi |
HOA detail
- Monthly dues
- $1,000 · $12,000/yr
Listing history 7 events
-
2026-06-18days on market $57,900 Active 31 DOM
-
2026-06-17days on market $57,900 Active 30 DOM
-
2026-06-16days on market $57,900 Active 29 DOM
-
2026-06-15days on market $57,900 Active 28 DOM
-
2026-06-14days on market $57,900 Active 26 DOM
-
2026-06-13remarks 618-char remark
-
2026-06-13$57,900 Active 25 DOM
ⓘ Source: listings_history table (triggers on properties + properties_extension) + one-shot
backfill from property_details.listing_events for pre-trigger history.
Climate risk First Street
- Flood 1/10 Low FEMA zone X (unshaded) · 0% chance over 30 yrs
- Wildfire 1/10 Low
- Heat 4/10 Moderate 7 d/yr ≥94°F today · 18 d/yr by 30 yrs out
- Wind 1/10 Low
- Air quality 4/10 Moderate 5 unhealthy d/yr today · 7 by 30 yrs out
Nearby sold comps map
Loading sold comps map…
Walkable amenities ~0.75 mi
Loading nearby amenities…
Taxation est. · year 1
- Rental income
- $20,099
- − Mortgage interest
- −$3,243
- − Property taxes
- −$868
- − Insurance
- −$290
- − Repairs & maintenance
- −$1,608
- − Management
- −$1,608
- − HOA
- −$12,000
- − Depreciation
- −$1,684
- Taxable loss
- −$1,202
- Est. tax savings @ 24.0%
- +$289
- After-tax cash flow
- $-635/yr
For passive investors: Depreciation is non-cash, so a rental often shows a tax loss while cash-flowing — sheltering income. Rental losses are passive: they offset passive income freely, and up to $25,000/yr can offset ordinary (W-2) income if you actively participate and your MAGI is under $100k (phasing out to $0 by $150k); unused losses carry forward. On sale, claimed depreciation is recaptured at up to 25%, and gains may owe capital-gains tax (a 1031 exchange can defer both). Figures are a year-1 estimate at your 24.0% rate — not tax advice; consult a CPA.
Condition & rehab AI · 13 photos
This remodeled mobile home in Mountain View Estates is in good condition with recent updates, including a new roof, windows, and HVAC unit. It's move-in ready with a good curb appeal and potential for further value through landscaping and exterior maintenance.
Value-add opportunities
- Both Landscaping — Enhances curb appeal and adds value
- Both Painting exterior — Fresh paint improves curb appeal and value
- Both Landscaping and exterior maintenance — Maintains and enhances curb appeal and value
Renovation cost estimate screening
Value-add ROI direction
- Both Landscaping — Enhances curb appeal and adds value ↑
- Both Painting exterior — Fresh paint improves curb appeal and value ↑
- Both Landscaping and exterior maintenance — Maintains and enhances curb appeal and value ↑
ⓘ Cost ranges are severity-bucket heuristics (US national rule-of-thumb). Get contractor quotes + a written scope before underwriting a rehab budget.
Schools (NCES district)
- District
- Davis District
- NCES district ID
- 4900210
- Math proficiency
- 43% ▼ -9.00%
- Reading proficiency
- 47% ▼ -5.00%
- Median HH income
- $70,511
- Composite
- 40.59/100
- National rank
- #3698
- State rank
- #28 of 80 in UT
Livability — Layton
- Score
- 86/100
- State rank
- #11
- US rank
- #457
Category grades
Schools grade is shown separately in the Schools card above.
Census & demographics
- Census place
- Layton, UT
- County
- Davis County · 341,755 people
- City population
- 83,689
- Metro
- Ogden-Clearfield, UT
- Population (ZIP)
- 55,180
- Household income
- $89,604
- Rent vs Own
- Severe rent burden
- 1058.0
Population outlook (Davis County) Hauer SSP2
- Today (2025)
- 399,271 people
- By 2030
- 430,528 · +7.8%
- By 2040
- 493,485 · +23.6%
- By 2050
- 555,187 · +39.1%
- By 2075
- 688,589 · +72.5%
- By 2100
- 769,646 · +92.8%
Race, ethnicity, and origin ACS 2023
- Neighborhood character
- Predominantly White (75%)
- Race & ethnicity
- White 75% Hispanic / Latino 17% Two or more races 10% Asian 2% Black 1% Pacific Islander 1%
- Hispanic origin (detail)
- Mexican 12%
- Common ancestry
- Slovak 4% Italian 2% Portuguese 2%
- Foreign-born
- 7% · Canada
- Languages at home
- 86% English-only · Spanish 11% Tagalog/Filipino 1% Other Indo-European 1%
Political lean MEDSL · Davis
- 2024 margin
- Strong R (+24.9) · D 36.0% · R 60.8% · Other 3.2%
- 2008→2024 swing
- +17.4pp toward D · 2008: -42.3pp · 2024: -24.9pp
- All cycles
- 2024: R+24.9 2020: R+27.5 2016: R+23.3 2012: R+61.8 2008: R+42.3
Not yet ingested
- Civics
- —
Market trends
- HPI YoY
- ▼ -173.00%
- Current HPI
- 307.2627
- Rent YoY
- ▲ 1.30%
- Metro
- Ogden-Clearfield, UT
- State GDP YoY
- ▲ 3.54%
- F500 in state
- 2
Industry mix (Fortune 500 HQ in UT)
| Industry | F500 HQs | Revenue |
|---|---|---|
| Financial Services | 1 | $3B |
|
||
Price history
3 events — show timeline
- 2026-06-10 Relisted — WFRMLS
- 2026-05-22 Listing Removed — WFRMLS
- 2026-04-30 Listed $57,900 WFRMLS
Cash-flow waterfall
monthlySold comps — $/sqft
last 12 mo · ≤1 miLoading sold comps…