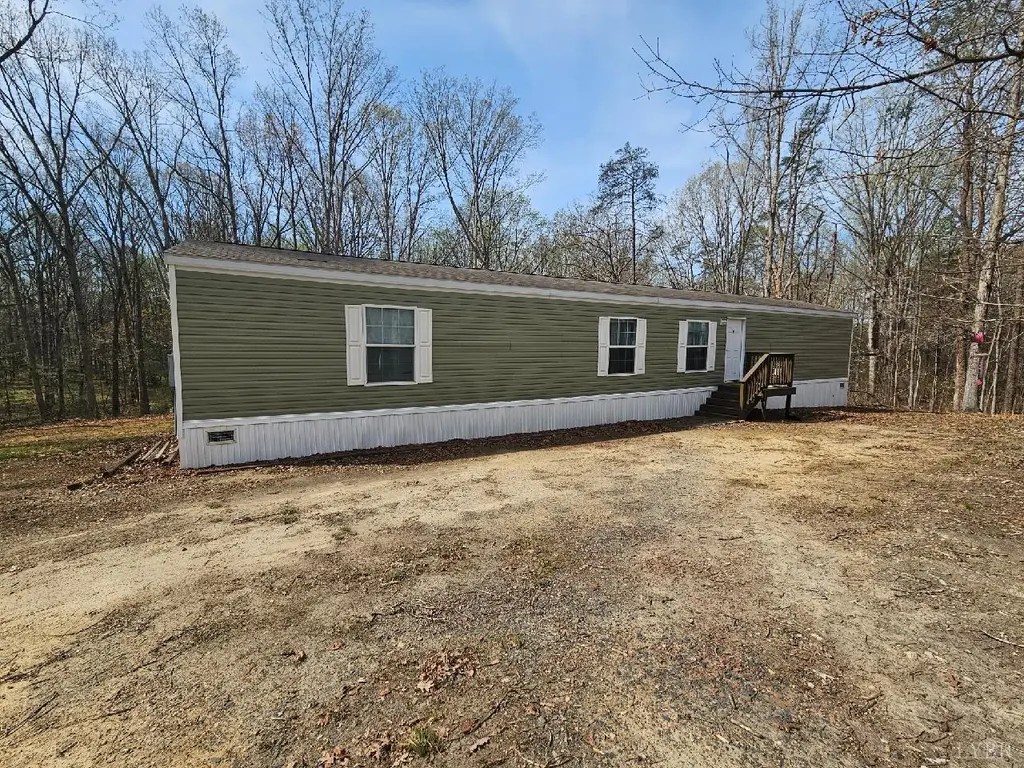
415 Plum Branch Rd · Concord, VA
Flood risk No data
- FEMA flood zone
- —
- Chance of flooding over 30 yrs
- —
- Est. flood insurance / yr
- —
Fire risk No data
- Est. fire insurance / yr
- —
Heat risk No data
- Hot days now (above threshold)
- —
- Hot days in 30 yrs
- —
Wind risk No data
- Chance of severe wind over 30 yrs
- —
Air-quality risk No data
- Unhealthy air days now
- —
- Unhealthy air days in 30 yrs
- —
Risk factors via First Street. Map © Google.
Why this score? — see what drove the B grade
The composite is a weighted blend of 9 inputs, each scored 0–100. Each bar is that input's sub-score; the figure is the points it added to the 100-point composite (weight × sub-score).
- Cash flow +26.6/30.0
- ARV discount +15.0/15.0
- DSCR +9.1/10.0
- 1% rule +7.1/10.0
- Schools +5.2/10.0
- Rent growth +3.6/5.0
- Livability +3.2/5.0
- Condition / age +2.5/5.0
- Appreciation +0.0/10.0
$134,900
🖨 Deal sheet (PDF) 📄 Offer letter ✓ Due diligence
Listing remarks MLS
Wow! Where else are you going to find a 7-year-old home on over 2.5 acres for under $140,000? This second-row home sits well off Plum Branch Road, offering added privacy and minimal road noise- so you can enjoy a quieter, more peaceful setting without the distraction of passing traffic.
Key facts
- 2.58 acre lot
- Built 2019
- Listed 70 days
Neighborhood map
What this means for you Summary
Snapshot
- This is a 3-bed/2.0-bath single-family listed at $135k.
Deal economics
- At list price, monthly cash flow is $359 ($4k/yr) — positive.
- The deal already cash-flows at list — no discount required.
- Meets the 1% rule at list price ($2k rent vs $135k).
- Recommended offer: $127k (6.0% below list) — sets the bar for market timing.
- Cap rate 9.5% vs local median 3.0% in Concord — top-decile yield for the area; either an underpriced asset or a hidden risk that comps aren't pricing in. Stress-test before assuming the spread holds.
Location & tenants
- Location reads 65/100 on livability (#335 in VA) — a middle-class / working-renter tenant base. Strengths: crime A+, cost of living A+; Watch: employment C-, health & safety C-, amenities F.
- Campbell County Public School District (rural): math 55% / reading 68% proficiency, ranked #55 of 131 in VA (top 42%) — acceptable for families but not a draw, mixed tenant base, ~2y average lease.
- Zoned schools: Concord Elementary (math 57% / reading 67%, grade B, #480 of 1,108 statewide, top 46%, 432 students, 74% FRL); Rustburg Middle (math 49% / reading 65%, grade B, #178 of 342 statewide, top 53%, 606 students, 74% FRL); Rustburg High (math 77% / reading 67%, grade B+, #134 of 319 statewide, top 45%, 828 students, 67% FRL) — zoned schools average 72% FRL vs 37% district-wide (35 pts higher); higher-poverty schools than district average — tighter screening recommended.
- Market conditions: Rents rising fast (+4.6%/yr); 111 active listings in the ZIP; 1 comparable units currently listed for rent nearby; 315 units permitted in Campbell County in 2024 (51 in 5+ unit buildings).
- This rent runs 37% of the median local income ($53k/yr) — at the standard rent-burdened threshold; future hikes will face affordability resistance.
Forward outlook
- Local home prices are declining (-3.0%/yr); year-one equity from $933 of loan paydown is wiped out by about $4k of value loss. Plan a longer hold.
- Campbell County population projected to shrink 6% by 2050 — rents likely to lag national; underwrite the cash flow, not the appreciation.
- At projected returns (-3.0% appreciation + 4.6% rent growth), your $38k cash investment doubles in ~9 years — after that, you're playing with house money.
Negotiation context
- It's been on market 70 days — a 6% lower offer ($127k) is reasonable based on typical stale-listing flexibility.
- Current owner paid $56k; list at $135k implies a 141% gain — meaningful room to come down on a strong offer.
Questions for the listing agent
- It's been on market 70 days. Have you received any prior offers? Is the seller open to a 6% concession, seller financing, or rate buy-down credit?
- Why hasn't it sold? Are there any deal-killer items the seller is aware of (foundation, flood, title, zoning, code violations)?
- Is there a deadline driving the sale (1031 exchange, divorce, estate, relocation)? That informs how much negotiation room exists.
- Schools are B-rated — typically a magnet for longer-tenancy family renters. What's the average tenant stay here, and is there a school-zone premium baked into asking?
- What's the average days-on-market for RENTAL listings here right now (not sales)? A rising rental-DOM trend means longer vacancies and softer asking-rent achievability than the comps imply.
- What's the recent tenant-quality profile in this submarket — average credit score on applications, eviction rate, late-payment / NSF rate, and stable-employment percentage? A property-management company in the area should have these aggregated.
- How much new for-sale + rental construction is in the pipeline within 1–3 miles? Heavy new supply typically softens prices + rents 12–24 months out; constrained supply supports both.
Investment metrics
- 1% rule
- 1.21% ✓
- Cap rate
- 9.49%
- Cash-on-cash
- 11.40%
- DSCR
- 1.51
- GRM
- 6.9
CMA / ARV
- ARV (median comp)
- $192,457
- List price
- $134,900
- Delta
- -29.91%
- Verdict
- UNDERPRICED
- Comps
- 14 within 1.0 mi
Show comp detail 3 sales within ~0.75 mi
| Address | Dist | Beds/Ba | Sqft | Sold | Price | $/sf | Match |
|---|---|---|---|---|---|---|---|
| 191 Peach Tree Ln | 0.20mi | 3/2.0 | 1,120 (+0%) | 19mo | $140,000 | $125 | 74 |
| 446 Plum Branch Rd | 0.18mi | 3/1.0 | 1,032 (-8%) | 10mo | $230,000 | $223 | 67 |
| 595 Plum Branch Rd | 0.16mi | 3/1.5 | 1,064 (-5%) | 21mo | $99,500 | $94 | 65 |
Match score weights: distance 35% · size 25% · config 20% · recency 20%. Top-matched comps best support the ARV.
Projected returns pro-forma
-3.0% appreciation · 4.56% rent growth · sell at horizon
- IRR
- 2.5%
- Equity multiple
- 1.10×
- Total profit
- $3,630
- Equity at exit
- $20,114
- IRR
- 13.5%
- Equity multiple
- 2.16×
- Total profit
- $43,732
- Equity at exit
- $11,664
Cash invested: $37,772 (down + closing). Projections, not guarantees.
Landlord ↔ Tenant lean methodology
- Overall (STATE)
- 55 Moderately Landlord-Leaning
- State Virginia
- 55 Moderately Landlord-Leaning · D+2
- County
- — inherits STATE
- City
- — inherits STATE
ZIP-level market 24504
- Home prices YoY
- -12.7%
- Rents YoY
- 4.6%
- Active inventory
- 111
- Price-to-rent
- 6.9×
Monthly cashflow live
- Estimated rent
- $1,634 medium interval (Pro) →
- Mortgage (P&I)
- −$707
- Tax est. 1.5%
- −$169 /mo · $2,024/yr
- Insurance
- −$56
- HOA
- −$0
- Vacancy / Maint / Mgmt
- −$343
- Net cashflow
- $359
Break-even live
Sensitivity live
| Price | -10% $452 | -5% $406 | +0% $359 | +5% $312 | +10% $266 |
|---|---|---|---|---|---|
| Rent | -10% $230 | -5% $294 | +0% $359 | +5% $423 | +10% $488 |
| Rate | -1.0pp $427 | -0.5pp $393 | base $359 | +0.5pp $324 | +1.0pp $288 |
UW: 25.0% down · 7.5% · 30yr · 1.5% tax · 5.0% vac · 8.0% maint · 8.0% mgmt
Financing live
Cash to close
- Down payment
- $33,725
- Closing costs
- $4,047
- Reserves months
- —
- Total cash needed
- —
Loan-product check · same deal, 3 products live
Conventional
25% down · 7.5% · 30yr
- Down + closing
- —
- Monthly P&I
- —
- Monthly cashflow
- —
- DSCR
- —
- Eligible?
- —
Personal DTI + credit; lowest rate.
DSCR
20% down · 8.5% · 30yr
- Down + closing
- —
- Monthly P&I
- —
- Monthly cashflow
- —
- DSCR
- —
- Eligible?
- —
No personal income docs; deal must DSCR.
Hard money
10% down · 12.0% · 12mo
- Down + closing
- —
- Monthly P&I
- —
- Monthly cashflow
- —
- DSCR
- —
- Eligible?
- —
Short-term bridge; refi at stabilization.
Rent comps 1 comps
| Address | Beds | Baths | Sqft | Rent | $/sqft | DOM | Units | Dist |
|---|---|---|---|---|---|---|---|---|
| 6138 Village Hwy Lynchburg, VA | 3.0 | 2.0 | 1352 | $2,045 | $1.51 | 15d | 1 | 0.99mi |
Listing history 15 events
-
2026-06-13status $134,900 Pending 70 DOM
-
2026-06-10days on market $134,900 Active 70 DOM
-
2026-06-09days on market $134,900 Active 69 DOM
-
2026-06-08days on market $134,900 Active 68 DOM
-
2026-06-07days on market $134,900 Active 67 DOM
-
2026-06-05days on market $134,900 Active 64 DOM
-
2026-06-02days on market $134,900 Active 62 DOM
-
2026-06-01days on market $134,900 Active 61 DOM
-
2026-05-31days on market $134,900 Active 60 DOM
-
2026-05-30days on market $134,900 Active 59 DOM
-
2026-04-26price $134,900 287-char remark
Show marketing remark (287 chars)
Wow! Where else are you going to find a 7-year-old home on over 2.5 acres for under $140,000? This second-row home sits well off Plum Branch Road, offering added privacy and minimal road noise- so you can enjoy a quieter, more peaceful setting without the distraction of passing traffic.
-
2026-03-30$139,900 Active 287-char remark
Show marketing remark (287 chars)
Wow! Where else are you going to find a 7-year-old home on over 2.5 acres for under $140,000? This second-row home sits well off Plum Branch Road, offering added privacy and minimal road noise- so you can enjoy a quieter, more peaceful setting without the distraction of passing traffic.
-
2005-11-10soldstatus $56,000
-
2004-09-24soldstatus $59,655
-
1994-01-21soldstatus $15,500
ⓘ Source: listings_history table (triggers on properties + properties_extension) + one-shot
backfill from property_details.listing_events for pre-trigger history.
Nearby sold comps map
Loading sold comps map…
Walkable amenities ~0.75 mi
Loading nearby amenities…
Taxation est. · year 1
- Rental income
- $19,613
- − Mortgage interest
- −$7,556
- − Property taxes
- −$2,024
- − Insurance
- −$674
- − Repairs & maintenance
- −$1,569
- − Management
- −$1,569
- − Depreciation
- −$3,924
- Taxable income
- $2,296
- Est. tax owed @ 24.0%
- −$551
- After-tax cash flow
- $3,756/yr
For passive investors: Depreciation is non-cash, so a rental often shows a tax loss while cash-flowing — sheltering income. Rental losses are passive: they offset passive income freely, and up to $25,000/yr can offset ordinary (W-2) income if you actively participate and your MAGI is under $100k (phasing out to $0 by $150k); unused losses carry forward. On sale, claimed depreciation is recaptured at up to 25%, and gains may owe capital-gains tax (a 1031 exchange can defer both). Figures are a year-1 estimate at your 24.0% rate — not tax advice; consult a CPA.
Schools (NCES district)
- District
- Campbell County Public School District
- NCES district ID
- 5100600
- Math proficiency
- 55% ▼ -29.00%
- Reading proficiency
- 68% ▼ -11.00%
- Median HH income
- $45,915
- Composite
- 51.88/100
- National rank
- #1656
- State rank
- #55 of 131 in VA
Livability — Concord
- Score
- 65/100
- State rank
- #335
- US rank
- #12864
Category grades
Schools grade is shown separately in the Schools card above.
Census & demographics
- County
- Lynchburg City · 97,036 people
- Metro
- Lynchburg, VA
- Population (ZIP)
- 9,632
- Household income
- $52,571
- Rent vs Own
- Severe rent burden
- 552.0
Population outlook (Campbell County) Hauer SSP2
- Today (2025)
- 56,306 people
- By 2030
- 56,366 · +0.1%
- By 2040
- 55,406 · -1.6%
- By 2050
- 53,011 · -5.9%
- By 2075
- 45,932 · -18.4%
- By 2100
- 36,029 · -36.0%
Race, ethnicity, and origin ACS 2023
- Neighborhood character
- Diverse neighborhood (Simpson 0.57)
- Race & ethnicity
- White 51% Black 40% Two or more races 6% Hispanic / Latino 4%
- Common ancestry
- Italian 3% Lithuanian 1% Serbian 1%
- Foreign-born
- 4% · Canada, China
- Languages at home
- 95% English-only · Spanish 3% Chinese 1%
Political lean MEDSL · Campbell
- 2024 margin
- Solid R (+48.6) · D 25.3% · R 73.9%
- 2008→2024 swing
- -12.3pp toward R · 2008: -36.2pp · 2024: -48.6pp
- All cycles
- 2024: R+48.6 2020: R+44.1 2016: R+47.2 2012: R+39.4 2008: R+36.2
Not yet ingested
- Civics
- —
Market trends
- HPI YoY
- ▼ -33.39%
- Current HPI
- 229.4423
- Rent YoY
- ▲ 4.56%
- Metro
- Lynchburg, VA
- State GDP YoY
- ▲ 2.40%
- F500 in state
- 50
Industry mix (Fortune 500 HQ in VA)
| Industry | F500 HQs | Revenue |
|---|---|---|
| Aerospace / Defense | 4 | $236B |
|
||
| Technology / Defense | 3 | $32B |
|
||
| Financial Services | 2 | $176B |
|
||
| Utilities | 2 | $27B |
|
||
| Insurance | 2 | $25B |
|
||
| Technology | 2 | $15B |
|
||
Price history
+770.3% since first listed5 events — show timeline
- 2026-04-26 Price Changed $134,900 LMLS
- 2026-03-30 Listed $139,900 LMLS
- 2005-11-10 Sold (Public Records) $56,000 Public Records
- 2004-09-24 Sold (Public Records) $59,655 Public Records
- 1994-01-21 Sold (Public Records) $15,500 Public Records
Property tax history
+1.6%/yrLatest (2025): $159 · +0.0% YoY. Source: county tax records.
Cash-flow waterfall
monthlySold comps — $/sqft
last 12 mo · ≤1 miLoading sold comps…