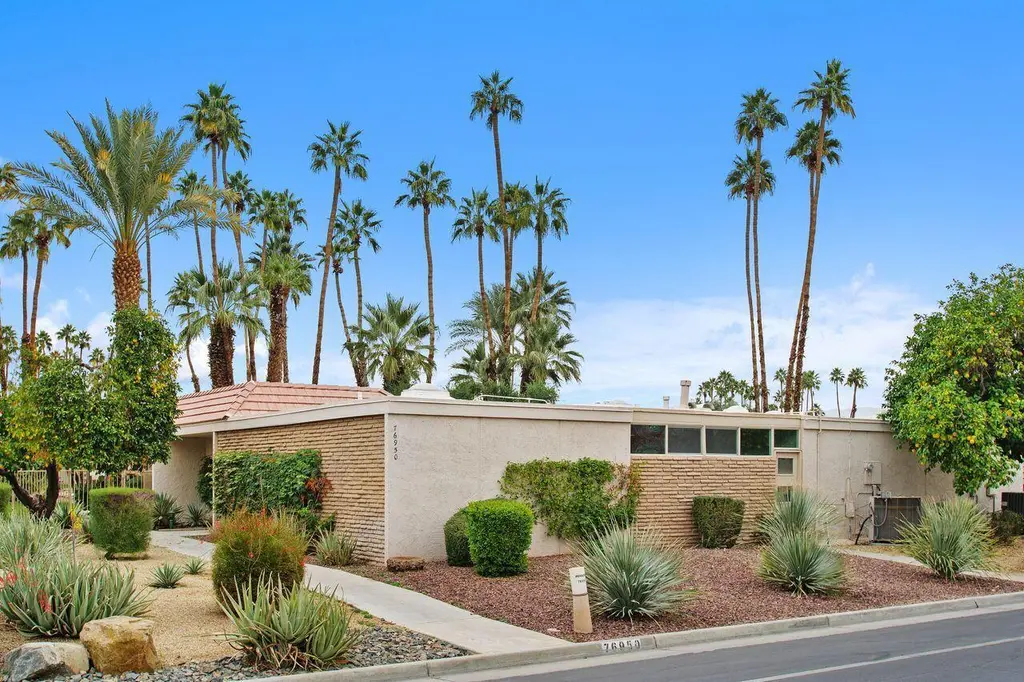
76950 Iroquois Dr · Indian Wells, CA
Flood risk 1/10 · Minimal
- FEMA flood zone
- X
- Chance of flooding over 30 yrs
- 0.0%
- Est. flood insurance / yr
- $507 – $1,088
Fire risk 5/10 · Moderate
- Est. fire insurance / yr
- $659 – $1,223
Heat risk 9/10 · Severe
- Hot days now (above 114°F)
- 7 days/yr
- Hot days in 30 yrs
- 19 days/yr
Wind risk 1/10 · Minimal
- Chance of severe wind over 30 yrs
- —
Air-quality risk 4/10 · Minor
- Unhealthy air days now
- 4 days/yr
- Unhealthy air days in 30 yrs
- 5 days/yr
Risk factors via First Street. Map © Google.
Why this score? — see what drove the D+ grade
The composite is a weighted blend of 9 inputs, each scored 0–100. Each bar is that input's sub-score; the figure is the points it added to the 100-point composite (weight × sub-score).
- Cash flow +12.4/30.0
- ARV discount +7.5/15.0
- Appreciation +6.9/10.0
- 1% rule +4.1/10.0
- Schools +3.8/10.0
- DSCR +3.7/10.0
- Livability +2.7/5.0
- Rent growth +2.5/5.0
- Condition / age +2.5/5.0
$829,900
🖨 Deal sheet (PDF) 📄 Offer letter ✓ Due diligence
Listing remarks MLS
A rare opportunity to own a classic mid-century residence in the highly sought-after Sandpiper at Indian Wells Country Club—a community celebrated for its low density, resort-style ambiance and architectural significance. Designed in 1968 by renowned mid-century modern architect William Krisel, this condominium embodies timeless design paired with thoughtful modern updates. Offering 2,280 square feet of living space on a 3,168 square foot lot, this home features an amazing open floor plan ideal for relaxed desert living and effortless entertaining. The residence includes three king-sized en-suite bedrooms and three baths, providing exceptional comfort and privacy for owners and guests alike. Walls of glass connect the interior to both front and rear outdoor spaces, creating seamless indoor-outdoor flow and capturing serene pool views. A covered atrium brings natural light into the heart of the home, enhancing the airy, architectural feel. The gorgeous kitchen is well-appointed for modern living, complemented by updated baths, a dedicated laundry room, and an attached two-car garage. Ideally located close to the clubhouse, this home also offers access to exceptional lifestyle benefits. Owners qualify for the Indian Wells Resident Benefit Card, providing discounts at the Indian Wells Golf Resort, the BNP Paribas Open, all four Indian Wells luxury resorts, and exclusive resident events. Additionally, optional membership in Indian Wells Country Club unlocks two championship golf courses, fitness and social amenities, a full clubhouse, a steakhouse, and more. This is desert living at its finest—architecturally significant, beautifully updated, and perfectly positioned to enjoy the best of Indian Wells.
Key facts
- Open floor plan
- Updated baths
- Gorgeous kitchen
Tags
Neighborhood map
What this means for you Summary
Snapshot
- This is a 3-bed/3.0-bath condo listed at $830k.
Deal economics
- At list price, monthly cash flow is $-137 ($-2k/yr) — negative.
- To cash-flow at today's rent, offer at most $806k (2.9% below list).
- To meet the 1% rule (rent ≥ 1% of price), the offer needs to be $756k (8.9% below list).
- Recommended offer: $730k (12.0% below list) — sets the bar for market timing.
- Cap rate 6.1% vs local median 1.5% in Indian Wells — top-decile yield for the area; either an underpriced asset or a hidden risk that comps aren't pricing in. Stress-test before assuming the spread holds.
Location & tenants
- Location reads 53/100 on livability (#968 in CA) — a working-class tenant base; expect higher turnover. Strengths: employment A+, crime B+; Watch: amenities F, commute F, cost of living F.
- Desert Sands Unified (suburban): math 31% / reading 56% proficiency, ranked #199 of 517 in CA (top 38%) — families likely to look elsewhere, expect single-tenant / working-renter base with shorter leases.
- Zoned schools: Gerald R. Ford Elementary (math 24% / reading 24%, grade F, #973 of 1,571 statewide, top 73%, 603 students, 59% FRL); La Quinta Middle (math 24% / reading 24%, grade F, #277 of 498 statewide, top 73%, 754 students, 83% FRL); Palm Desert High (math 42% / reading 67%, grade C-, #256 of 1,170 statewide, top 24%, 2,050 students, 57% FRL).
- Market conditions: 150 active listings in the ZIP; 40 comparable units currently listed for rent nearby; rentals lingering (median 46d on market — plan ~5-8 weeks vacancy on turnover, expect pricing pressure); 68% of comp listings sitting > 30 days — soft ceiling on asking rent; high-income renter base; 9,195 units permitted in Riverside County in 2024 (1,512 in 5+ unit buildings).
- At $7,562/mo this rent would consume 56% of the median local household income ($163k/yr) (locally 56% of renters already pay >50% of income on rent) — very limited rent-growth headroom before tenants either downsize or default.
Forward outlook
- In year one you build about $37k of equity ($6k loan paydown + $31k appreciation (3.8% local appreciation)).
- Riverside County population projected at +22% by 2050 — long-run rental-demand tailwind backs the buy-and-hold thesis.
- By year 2, paydown + projected appreciation supports a ~$60k cash-out refi (75% LTV) — recoverable capital for the next deal without selling this one.
Negotiation context
- It's been on market 156 days — a 12% lower offer ($730k) is reasonable based on typical stale-listing flexibility.
- 4 sale attempts since 18y ago with the ask held roughly flat each time — persistent listings suggest the price (not the market) is what's stuck; bring a comps-based counter.
- Current owner paid $475k; list at $830k implies a 75% gain — meaningful room to come down on a strong offer.
Risks & watch-outs
- Climate carrying-cost: moderate wildfire risk; extreme-heat days projected 7→19/yr by 2055 (HVAC capex compounding) — expect insurance premiums to compound above CPI over the hold.
Questions for the listing agent
- What do current leases actually rent for vs. the listed asking? Can we see a recent rent roll and the last 12 months of T-12 income?
- It's been on market 156 days. Have you received any prior offers? Is the seller open to a 12% concession, seller financing, or rate buy-down credit?
- Built in 1968 — when were the roof, HVAC, electrical panel, plumbing, and water heater last replaced?
- What does the HOA fee cover, when was the last increase, and are there any pending special assessments or reserve-fund shortfalls?
- Any open or pending special assessments — roof, HVAC, plumbing, elevator, façade? What's the per-unit balance and payoff schedule, and is the seller paying it off at close or rolling it to the buyer?
- Why hasn't it sold? Are there any deal-killer items the seller is aware of (foundation, flood, title, zoning, code violations)?
- Is there a deadline driving the sale (1031 exchange, divorce, estate, relocation)? That informs how much negotiation room exists.
- Schools are B-rated — typically a magnet for longer-tenancy family renters. What's the average tenant stay here, and is there a school-zone premium baked into asking?
- The area grade is low — what's the realistic commute time and amenity access for the typical tenant pool here? Any planned neighborhood developments (good or bad) we should know about?
- What's the average days-on-market for RENTAL listings here right now (not sales)? A rising rental-DOM trend means longer vacancies and softer asking-rent achievability than the comps imply.
- What's the recent tenant-quality profile in this submarket — average credit score on applications, eviction rate, late-payment / NSF rate, and stable-employment percentage? A property-management company in the area should have these aggregated.
- How much new apartment / multifamily construction is in the pipeline within 1–3 miles? Heavy new supply (>2% of stock underway) typically softens rents 12–24 months out; light construction supports rent growth.
Investment metrics
- 1% rule
- 0.91% ✗
- Cap rate
- 6.09%
- Cash-on-cash
- -0.71%
- DSCR
- 0.97
- GRM
- 9.1
CMA / ARV
No comps found within radius.
Projected returns pro-forma
3.76% appreciation · 3.0% rent growth · sell at horizon
- IRR
- 9.0%
- Equity multiple
- 1.54×
- Total profit
- $125,386
- Equity at exit
- $409,118
- IRR
- 11.1%
- Equity multiple
- 2.80×
- Total profit
- $418,712
- Equity at exit
- $660,014
Cash invested: $232,372 (down + closing). Projections, not guarantees.
Landlord ↔ Tenant lean methodology
- Overall (STATE)
- 18 Strongly Tenant-Friendly
- State California
- 18 Strongly Tenant-Friendly · D+13
- County
- — inherits STATE
- City
- — inherits STATE
ZIP-level market 92210
- Home prices YoY
- 1.3%
- Active inventory
- 150
- Price-to-rent
- 9.1×
Monthly cashflow live
- Estimated rent
- $7,562 high interval (Pro) →
- Mortgage (P&I)
- −$4,352
- Tax from tax record
- −$779 /mo · $9,343/yr
- Insurance
- −$346
- HOA
- −$635
- Vacancy / Maint / Mgmt
- −$1,588
- Net cashflow
- $-137
Break-even live
Sensitivity live
| Price | -10% $333 | -5% $98 | +0% $-137 | +5% $-372 | +10% $-607 |
|---|---|---|---|---|---|
| Rent | -10% $-735 | -5% $-436 | +0% $-137 | +5% $162 | +10% $460 |
| Rate | -1.0pp $281 | -0.5pp $74 | base $-137 | +0.5pp $-352 | +1.0pp $-571 |
UW: 25.0% down · 7.5% · 30yr · 1.5% tax · 5.0% vac · 8.0% maint · 8.0% mgmt
Financing live
Cash to close
- Down payment
- $207,475
- Closing costs
- $24,897
- Reserves months
- —
- Total cash needed
- —
Loan-product check · same deal, 3 products live
Conventional
25% down · 7.5% · 30yr
- Down + closing
- —
- Monthly P&I
- —
- Monthly cashflow
- —
- DSCR
- —
- Eligible?
- —
Personal DTI + credit; lowest rate.
DSCR
20% down · 8.5% · 30yr
- Down + closing
- —
- Monthly P&I
- —
- Monthly cashflow
- —
- DSCR
- —
- Eligible?
- —
No personal income docs; deal must DSCR.
Hard money
10% down · 12.0% · 12mo
- Down + closing
- —
- Monthly P&I
- —
- Monthly cashflow
- —
- DSCR
- —
- Eligible?
- —
Short-term bridge; refi at stabilization.
Rent comps 40 comps
| Address | Beds | Baths | Sqft | Rent | $/sqft | DOM | Units | Dist |
|---|---|---|---|---|---|---|---|---|
| 76895 Lark Dr Indian Wells, CA | 2.0 | 2.0 | 1864 | $4,500 | $2.41 | 22d | 1 | 0.10mi |
| 76895 Lark Dr Indian Wells, CA | 2.0 | 2.0 | 1864 | $4,500 | $2.41 | 45d | 1 | 0.10mi |
| 45760 Pima Rd Indian Wells, CA | 3.0 | 3.0 | 2280 | $3,750 | $1.64 | 26d | 1 | 0.11mi |
| 76975 Robin Dr Indian Wells, CA | 3.0 | 3.0 | 2280 | $6,000 | $2.63 | 45d | 1 | 0.13mi |
| 76829 Iroquois Dr Indian Wells, CA | 3.0 | 3.0 | 2125 | $6,500 | $3.06 | 45d | 1 | 0.14mi |
| 45668 Pueblo Rd Indian Wells, CA | 3.0 | 3.0 | 2750 | $11,000 | $4.00 | 45d | 1 | 0.17mi |
| 77137 Iroquois Dr Indian Wells, CA | 4.0 | 3.0 | 2607 | $6,900 | $2.65 | 45d | 1 | 0.17mi |
| 45765 Hopi Rd Indian Wells, CA | 3.0 | 3.0 | 2129 | $10,000 | $4.70 | 45d | 1 | 0.18mi |
| 76770 Lark Dr Indian Wells, CA | 3.0 | 3.0 | 2129 | $7,000 | $3.29 | 45d | 1 | 0.19mi |
| 45705 Hopi Rd Indian Wells, CA | 2.0 | 2.0 | 1776 | $8,000 | $4.50 | 45d | 1 | 0.19mi |
| 76750 Lark Dr Indian Wells, CA | 3.0 | 2.0 | 2129 | $3,500 | $1.64 | 16d | 1 | 0.20mi |
| 45735 Pawnee Rd Indian Wells, CA | 3.0 | 3.0 | 2900 | $4,500 | $1.55 | 45d | 1 | 0.26mi |
| 77110 Desi Dr Indian Wells, CA | 3.0 | 2.0 | 1801 | $8,500 | $4.72 | 45d | 1 | 0.26mi |
| 45737 Club Dr Indian Wells, CA | 3.0 | 3.0 | 2655 | $10,500 | $3.95 | 45d | 1 | 0.31mi |
| 46115 Sacatan Cir Indian Wells, CA | 3.0 | 3.0 | 3053 | $16,000 | $5.24 | 45d | 1 | 0.31mi |
| 77312 Sioux Dr Indian Wells, CA | 4.0 | 3.0 | 2582 | $22,500 | $8.71 | 45d | 1 | 0.39mi |
| 76956 Comanche Ln Indian Wells, CA | 4.0 | 2.5 | 2837 | $6,500 | $2.29 | 45d | 1 | 0.40mi |
| 77321 Sioux Dr Indian Wells, CA | 3.0 | 5.5 | 3236 | $18,000 | $5.56 | 1d | 1 | 0.42mi |
| 77320 Black Mountain Trl Indian Wells, CA | 3.0 | 4.0 | 3375 | $10,500 | $3.11 | 45d | 1 | 0.46mi |
| 45634 Appian Way Indian Wells, CA | 2.0 | 3.0 | 3176 | $15,000 | $4.72 | 45d | 1 | 0.57mi |
| 45555 Kawea Way Indian Wells, CA | 3.0 | 3.0 | 2509 | $8,500 | $3.39 | 45d | 1 | 0.63mi |
| 76158 Via Montelena Indian Wells, CA | 3.0 | 3.5 | 2991 | $6,500 | $2.17 | 20d | 1 | 0.90mi |
| 77675 Seminole Rd Indian Wells, CA | 2.0 | 2.5 | 1716 | $5,500 | $3.21 | 26d | 1 | 0.92mi |
| 45480 Via Corona Indian Wells, CA | 3.0 | 2.0 | 2203 | $9,000 | $4.09 | 45d | 1 | 0.96mi |
| 44030 Pinto Creek Cir Indian Wells, CA | 3.0 | 2.0 | 1737 | $4,800 | $2.76 | 45d | 1 | 1.05mi |
| 43730 Louisiana St Palm Desert, CA | 3.0 | 2.0 | 1800 | $2,900 | $1.61 | 26d | 1 | 1.07mi |
| 76955 California Dr Palm Desert, CA | 3.0 | 2.0 | 1837 | $2,695 | $1.47 | 26d | 1 | 1.08mi |
| 76797 California Dr Palm Desert, CA | 3.0 | 2.5 | 1925 | $4,000 | $2.08 | 26d | 1 | 1.09mi |
| 77825 Cottonwood Cv Indian Wells, CA | 3.0 | 3.0 | 2740 | $11,000 | $4.01 | 45d | 1 | 1.10mi |
| 45455 Crow Cir Indian Wells, CA | 3.0 | 2.0 | 2082 | $5,000 | $2.40 | 45d | 1 | 1.11mi |
| 45250 Vista Santa Rosa Indian Wells, CA | 3.0 | 3.0 | 2208 | $3,500 | $1.59 | 45d | 1 | 1.13mi |
| 46596 Arapahoe Indian Wells, CA | 3.0 | 3.0 | 1791 | $6,000 | $3.35 | 23d | 1 | 1.15mi |
| 46594 Arapahoe Indian Wells, CA | 3.0 | 3.0 | 1791 | $7,900 | $4.41 | 45d | 1 | 1.16mi |
| 43660 Elkhorn Trl Palm Desert, CA | 3.0 | 2.0 | 1784 | $4,500 | $2.52 | 46d | 1 | 1.16mi |
| 76901 Kentucky Ave Palm Desert, CA | 3.0 | 2.0 | 1729 | $2,975 | $1.72 | 7d | 1 | 1.18mi |
| 45805 Cielito Dr Indian Wells, CA | 3.0 | 4.0 | 2965 | $22,000 | $7.42 | 45d | 1 | 1.21mi |
| 78560 Arapahoe Indian Wells, CA | 3.0 | 3.0 | 2110 | $6,000 | $2.84 | 26d | 1 | 1.24mi |
| 43695 Calle Las Brisas W Palm Desert, CA | 2.0 | 2.5 | 1650 | $4,500 | $2.73 | 45d | 1 | 1.26mi |
| 43485 Texas Ave Palm Desert, CA | 3.0 | 2.0 | 1618 | $2,900 | $1.79 | 18d | 1 | 1.28mi |
| 75593 Desert Horizons Dr Indian Wells, CA | 3.0 | 3.0 | 2745 | $9,500 | $3.46 | 45d | 1 | 1.34mi |
HOA detail condo
- Monthly dues
- $635 · $7,620/yr
- Likely covers
- pool
- Assessments
- None detected in remarks — confirm with the listing agent.
Listing history 21 events
-
2026-06-09days on market $829,900 Active 156 DOM
-
2026-06-08days on market $829,900 Active 155 DOM
-
2026-06-07days on market $829,900 Active 154 DOM
-
2026-06-04days on market $829,900 Active 151 DOM
-
2026-06-03days on market $829,900 Active 150 DOM
-
2026-06-02days on market $829,900 Active 149 DOM
-
2026-06-01days on market $829,900 Active 148 DOM
-
2026-05-31days on market $829,900 Active 147 DOM
-
2026-01-04$829,900 Active 1738-char remark
Show marketing remark (1738 chars)
A rare opportunity to own a classic mid-century residence in the highly sought-after Sandpiper at Indian Wells Country Club—a community celebrated for its low density, resort-style ambiance and architectural significance. Designed in 1968 by renowned mid-century modern architect William Krisel, this condominium embodies timeless design paired with thoughtful modern updates. Offering 2,280 square feet of living space on a 3,168 square foot lot, this home features an amazing open floor plan ideal for relaxed desert living and effortless entertaining. The residence includes three king-sized en-suite bedrooms and three baths, providing exceptional comfort and privacy for owners and guests alike. Walls of glass connect the interior to both front and rear outdoor spaces, creating seamless indoor-outdoor flow and capturing serene pool views. A covered atrium brings natural light into the heart of the home, enhancing the airy, architectural feel. The gorgeous kitchen is well-appointed for modern living, complemented by updated baths, a dedicated laundry room, and an attached two-car garage. Ideally located close to the clubhouse, this home also offers access to exceptional lifestyle benefits. Owners qualify for the Indian Wells Resident Benefit Card, providing discounts at the Indian Wells Golf Resort, the BNP Paribas Open, all four Indian Wells luxury resorts, and exclusive resident events. Additionally, optional membership in Indian Wells Country Club unlocks two championship golf courses, fitness and social amenities, a full clubhouse, a steakhouse, and more. This is desert living at its finest—architecturally significant, beautifully updated, and perfectly positioned to enjoy the best of Indian Wells.
-
2025-03-04historical
-
2025-01-15price $825,000
-
2024-10-11$875,000 Active
-
2015-06-10soldstatus $475,000 Sold
-
2015-06-10soldstatus $463,000
-
2015-05-28status Pending
-
2015-04-12historical Contingent
-
2015-01-19$499,000 Active
-
2009-02-04historical
-
2008-12-23$549,000
-
1996-11-21soldstatus $165,000
-
1990-06-13soldstatus $235,000
ⓘ Source: listings_history table (triggers on properties + properties_extension) + one-shot
backfill from property_details.listing_events for pre-trigger history.
Tax reassessment forecast CA · Resets to sale price
- Current annual tax
- $9,343 · $779/mo
- Projected year-2 tax
- $9,343 · $779/mo
- Expected delta
- $0/yr ($0/mo · 0.0%)
ⓘ Screening estimate from a state-policy table — verify with the county assessor before closing.
Climate risk First Street
- Flood 1/10 Low FEMA zone X · 0% chance over 30 yrs
- Wildfire 5/10 Major
- Heat 9/10 Extreme 7 d/yr ≥114°F today · 19 d/yr by 30 yrs out
- Wind 1/10 Low
- Air quality 4/10 Moderate 4 unhealthy d/yr today · 5 by 30 yrs out
Nearby sold comps map
Loading sold comps map…
Walkable amenities ~0.75 mi
Loading nearby amenities…
Taxation est. · year 1
- Rental income
- $90,750
- − Mortgage interest
- −$46,487
- − Property taxes
- −$9,343
- − Insurance
- −$4,150
- − Repairs & maintenance
- −$7,260
- − Management
- −$7,260
- − HOA
- −$7,620
- − Depreciation
- −$24,143
- Taxable loss
- −$15,513
- Est. tax savings @ 24.0%
- +$3,723
- After-tax cash flow
- $2,077/yr
For passive investors: Depreciation is non-cash, so a rental often shows a tax loss while cash-flowing — sheltering income. Rental losses are passive: they offset passive income freely, and up to $25,000/yr can offset ordinary (W-2) income if you actively participate and your MAGI is under $100k (phasing out to $0 by $150k); unused losses carry forward. On sale, claimed depreciation is recaptured at up to 25%, and gains may owe capital-gains tax (a 1031 exchange can defer both). Figures are a year-1 estimate at your 24.0% rate — not tax advice; consult a CPA.
Schools (NCES district)
- District
- Desert Sands Unified
- NCES district ID
- 0611110
- Math proficiency
- 31% ▼ -4.00%
- Reading proficiency
- 56% ▲ 7.00%
- Median HH income
- $54,957
- Composite
- 37.77/100
- National rank
- #4346
- State rank
- #199 of 517 in CA
Livability — Indian Wells
- Score
- 53/100
- State rank
- #968
- US rank
- #24559
Category grades
Schools grade is shown separately in the Schools card above.
Census & demographics
- Census place
- Indian Wells, CA
- County
- Riverside County · 2,287,001 people
- City population
- 4,871
- Metro
- Riverside-San Bernardino-Ontario, CA
- Population (ZIP)
- 4,871
- Household income
- $162,990
- Rent vs Own
- Severe rent burden
- 56.0
Population outlook (Riverside County) Hauer SSP2
- Today (2025)
- 2,664,475 people
- By 2030
- 2,802,692 · +5.2%
- By 2040
- 3,050,904 · +14.5%
- By 2050
- 3,256,783 · +22.2%
- By 2075
- 3,655,058 · +37.2%
- By 2100
- 3,766,594 · +41.4%
Race, ethnicity, and origin ACS 2023
- Neighborhood character
- Predominantly White (86%)
- Race & ethnicity
- White 86% Hispanic / Latino 5% Two or more races 5% Asian 3% Black 3%
- Common ancestry
- Slovak 5% Lithuanian 4% Romanian 3%
- Foreign-born
- 10% · Canada, China
- Languages at home
- 92% English-only · Spanish 3% Russian/Polish/Slavic 1% Tagalog/Filipino 1%
Political lean MEDSL · Riverside
- 2024 margin
- Toss-up / Even · D 48.0% · R 49.3% · Other 2.6%
- 2008→2024 swing
- -3.6pp toward R · 2008: 2.3pp · 2024: -1.3pp
- All cycles
- 2024: R+1.3 2020: D+8.0 2016: D+4.3 2012: R+0.4 2008: D+2.3
Not yet ingested
- Civics
- —
Market trends
- HPI YoY
- ▲ 3.76%
- Current HPI
- 299.2632
- Rent YoY
- —
- Metro
- Riverside-San Bernardino-Ontario, CA
- State GDP YoY
- ▲ 3.21%
- F500 in state
- 116
Industry mix (Fortune 500 HQ in CA)
| Industry | F500 HQs | Revenue |
|---|---|---|
| Technology | 27 | $1,492B |
|
||
| Financial Services | 3 | $174B |
|
||
| Retail | 3 | $44B |
|
||
| Insurance | 3 | $26B |
|
||
| Media / Entertainment | 2 | $115B |
|
||
| Pharmaceuticals / Biotech | 2 | $62B |
|
||
Price history
+253.1% since first listed13 events — show timeline
- 2026-01-04 Listed $829,900 GPSMLS
- 2025-03-04 Listing Removed — GPSMLS
- 2025-01-15 Price Changed $825,000 GPSMLS
- 2024-10-11 Listed $875,000 GPSMLS
- 2015-06-10 Sold (Public Records) $463,000 Public Records
- 2015-06-10 Sold (MLS) $475,000 GPSMLS
- 2015-05-28 Pending — GPSMLS
- 2015-04-12 Contingent — GPSMLS
- 2015-01-19 Listed $499,000 GPSMLS
- 2009-02-04 Listing Removed — GPSMLS
- 2008-12-23 Listed $549,000 GPSMLS
- 1996-11-21 Sold (Public Records) $165,000 Public Records
- 1990-06-13 Sold (Public Records) $235,000 Public Records
Property tax history
+5.2%/yrLatest (2025): $9,343 · +8.1% YoY. Source: county tax records.
Cash-flow waterfall
monthlySold comps — $/sqft
last 12 mo · ≤1 miLoading sold comps…