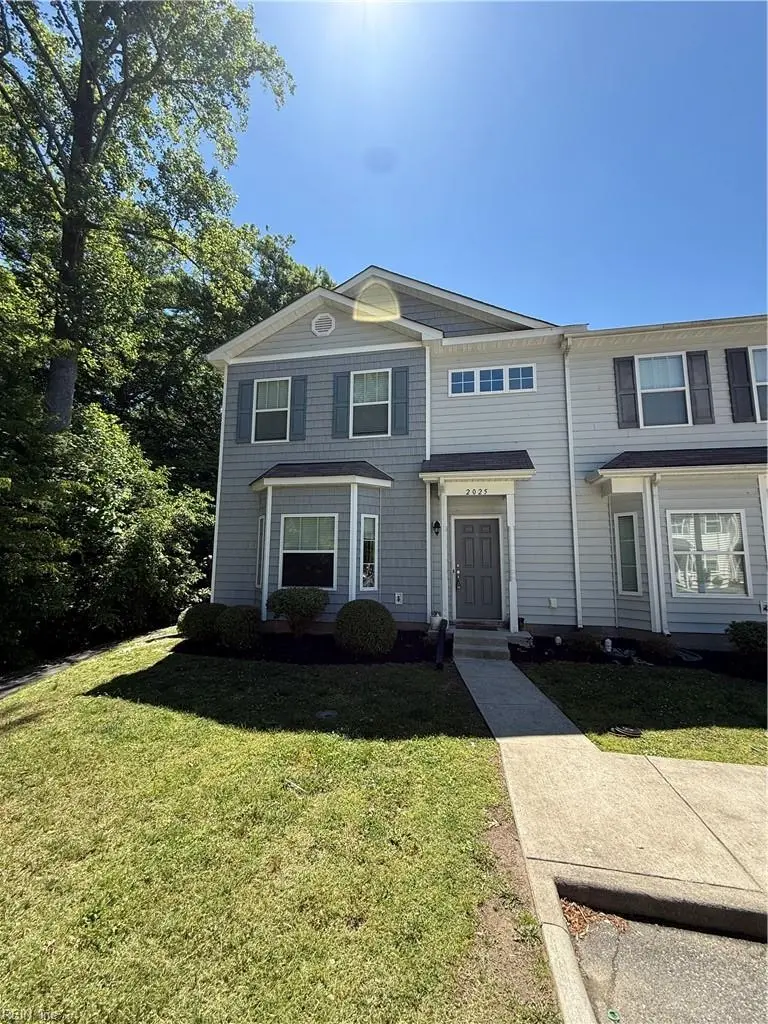
2025 Genevieve Trl · Newport News, VA
Flood risk 1/10 · Minimal
- FEMA flood zone
- X (unshaded)
- Chance of flooding over 30 yrs
- 0.0%
- Est. flood insurance / yr
- $507 – $1,088
Fire risk 2/10 · Minimal
- Est. fire insurance / yr
- $666 – $1,236
Heat risk 8/10 · Major
- Hot days now (above 106°F)
- 7 days/yr
- Hot days in 30 yrs
- 16 days/yr
Wind risk 8/10 · Major
- Chance of severe wind over 30 yrs
- 80.0%
Air-quality risk 2/10 · Minimal
- Unhealthy air days now
- 0 days/yr
- Unhealthy air days in 30 yrs
- 1 days/yr
Risk factors via First Street. Map © Google.
Why this score? — see what drove the D grade
The composite is a weighted blend of 9 inputs, each scored 0–100. Each bar is that input's sub-score; the figure is the points it added to the 100-point composite (weight × sub-score).
- Cash flow +11.6/30.0
- ARV discount +9.6/15.0
- Schools +5.0/10.0
- Rent growth +3.8/5.0
- Livability +3.8/5.0
- DSCR +3.4/10.0
- 1% rule +3.1/10.0
- Condition / age +2.5/5.0
- Appreciation +0.0/10.0
$260,000
🖨 Deal sheet (PDF) 📄 Offer letter ✓ Due diligence
Listing remarks MLS
30 Day Move In! End unit with open floor concept! 3 Bedrooms and 2.5 baths. Large Living Room! HOA dues cover Trash removal, common area, playground area, front yard landscaping and general exterior upkeep of home. Minutes from Interstate 64!
Key facts
- $105 HOA
- Built 2014
- Listed 3 days
Property features AI
Finance
- HOA & community: Chestnut Grove HOA, Inc. with $75 monthly association fee
Exterior
- Utilities: City/County water; City/County sewer; Electric water heater
- Home design: Attached townhouse; 2 stories; Slab foundation; Simple ownership
- Construction: Asphalt shingle roof
- Exterior features: Vinyl siding; Back yard fenced
Interior
- Kitchen: Dishwasher; Electric range; Refrigerator
- Bedrooms: No bedroom and full bathroom on first floor
- Bathrooms: 2 full bathrooms; 1 half bathroom
- Heating & cooling: Electric heating; Central air conditioning
- Interior features: 7 total rooms
- Laundry & utility: Washer hookup
Neighborhood map
What this means for you Summary
Snapshot
- This is a 3-bed/2.5-bath townhouse listed at $260k.
Deal economics
- At list price, monthly cash flow is $-80 ($-963/yr) — negative.
- To cash-flow at today's rent, offer at most $246k (5.5% below list).
- To meet the 1% rule (rent ≥ 1% of price), the offer needs to be $211k (18.9% below list).
- Recommended offer: $211k (18.9% below list) — sets the bar for 1% rule.
- Cap rate 5.9% vs local median 4.2% in Newport News — top-decile yield for the area; either an underpriced asset or a hidden risk that comps aren't pricing in. Stress-test before assuming the spread holds.
Location & tenants
- Location reads 75/100 on livability (#123 in VA, #4,018 nationally) — a middle-class / working-renter tenant base. Strengths: health & safety A+, cost of living A, housing A; Watch: crime F, commute F.
- Market conditions: Rents rising fast (+5.2%/yr); 389 active listings in the ZIP; 5 comparable units currently listed for rent nearby; rentals leasing fast (median 4d on market — plan ~1-2 weeks tenant-placement turnaround); solid renter incomes; 358 units permitted in James City County in 2024 (24 in 5+ unit buildings).
Forward outlook
- Local home prices are declining (-3.0%/yr); year-one equity from $2k of loan paydown is wiped out by about $8k of value loss. Plan a longer hold.
- James City County population projected at +29% by 2050 — long-run rental-demand tailwind backs the buy-and-hold thesis.
Negotiation context
- Only 4 days on market — expect competitive offers; lowballing is unlikely to land.
- 8 sale attempts since 10y ago; this cycle's ask is 13584% above the opening price — seller raised mid-cycle; expect resistance to lowballs.
Risks & watch-outs
- Climate carrying-cost: severe wind risk, 80% chance of damaging wind over 30y; extreme-heat days projected 7→16/yr by 2055 (HVAC capex compounding) — expect insurance premiums to compound above CPI over the hold.
Questions for the listing agent
- What do current leases actually rent for vs. the listed asking? Can we see a recent rent roll and the last 12 months of T-12 income?
- What does the HOA fee cover, when was the last increase, and are there any pending special assessments or reserve-fund shortfalls?
- Is there a deadline driving the sale (1031 exchange, divorce, estate, relocation)? That informs how much negotiation room exists.
- Schools are B-rated — typically a magnet for longer-tenancy family renters. What's the average tenant stay here, and is there a school-zone premium baked into asking?
- Crime grade is F in this area — have there been break-ins, vandalism, or insurance claims at this property in the last 3 years? What carrier currently insures it and at what premium?
- The area grade is low — what's the realistic commute time and amenity access for the typical tenant pool here? Any planned neighborhood developments (good or bad) we should know about?
- What's the average days-on-market for RENTAL listings here right now (not sales)? A rising rental-DOM trend means longer vacancies and softer asking-rent achievability than the comps imply.
- What's the recent tenant-quality profile in this submarket — average credit score on applications, eviction rate, late-payment / NSF rate, and stable-employment percentage? A property-management company in the area should have these aggregated.
- How much new for-sale + rental construction is in the pipeline within 1–3 miles? Heavy new supply typically softens prices + rents 12–24 months out; constrained supply supports both.
Investment metrics
- 1% rule
- 0.81% ✗
- Cap rate
- 5.92%
- Cash-on-cash
- -1.32%
- DSCR
- 0.94
- GRM
- 10.3
CMA / ARV
- ARV (on-the-fly)
- $272,580
- Comps found
- 5
Show comp detail 5 sales within ~0.75 mi
| Address | Dist | Beds/Ba | Sqft | Sold | Price | $/sf | Match |
|---|---|---|---|---|---|---|---|
| 1901 Algonquin Trl | 0.22mi | 3/2.5 | 1,550 (+1%) | 2mo | $275,000 | $177 | 87 |
| 1937 Algonquin Trl | 0.25mi | 3/2.5 | 1,392 (-10%) | 2mo | $255,000 | $183 | 70 |
| 1958 Algonquin Trl | 0.28mi | 3/2.5 | 1,650 (+7%) | 11mo | $267,000 | $162 | 66 |
| 1939 Algonquin Trl | 0.26mi | 3/2.5 | 1,608 (+4%) | 20mo | $226,554 | $141 | 64 |
| 1938 Algonquin Trl | 0.26mi | 3/2.5 | 1,384 (-10%) | 9mo | $250,000 | $181 | 64 |
Match score weights: distance 35% · size 25% · config 20% · recency 20%. Top-matched comps best support the ARV.
Projected returns pro-forma
-3.0% appreciation · 5.21% rent growth · sell at horizon
- IRR
- -16.1%
- Equity multiple
- 0.42×
- Total profit
- $-42,450
- Equity at exit
- $38,767
- IRR
- -4.4%
- Equity multiple
- 0.68×
- Total profit
- $-22,973
- Equity at exit
- $22,480
Cash invested: $72,800 (down + closing). Projections, not guarantees.
Landlord ↔ Tenant lean methodology
- Overall (STATE)
- 55 Moderately Landlord-Leaning
- State Virginia
- 55 Moderately Landlord-Leaning · D+2
- County
- — inherits STATE
- City
- — inherits STATE
ZIP-level market 23185
- Rents YoY
- 5.2%
- Active inventory
- 389
- Price-to-rent
- 10.3×
Monthly cashflow live
- Estimated rent
- $2,108 high interval (Pro) →
- Mortgage (P&I)
- −$1,363
- Tax from tax record
- −$169 /mo · $2,028/yr
- Insurance
- −$108
- HOA
- −$105
- Vacancy / Maint / Mgmt
- −$443
- Net cashflow
- $-80
Break-even live
Sensitivity live
| Price | -10% $67 | -5% $-7 | +0% $-80 | +5% $-154 | +10% $-227 |
|---|---|---|---|---|---|
| Rent | -10% $-247 | -5% $-164 | +0% $-80 | +5% $3 | +10% $86 |
| Rate | -1.0pp $51 | -0.5pp $-14 | base $-80 | +0.5pp $-148 | +1.0pp $-216 |
UW: 25.0% down · 7.5% · 30yr · 1.5% tax · 5.0% vac · 8.0% maint · 8.0% mgmt
Financing live
Cash to close
- Down payment
- $65,000
- Closing costs
- $7,800
- Reserves months
- —
- Total cash needed
- —
Loan-product check · same deal, 3 products live
Conventional
25% down · 7.5% · 30yr
- Down + closing
- —
- Monthly P&I
- —
- Monthly cashflow
- —
- DSCR
- —
- Eligible?
- —
Personal DTI + credit; lowest rate.
DSCR
20% down · 8.5% · 30yr
- Down + closing
- —
- Monthly P&I
- —
- Monthly cashflow
- —
- DSCR
- —
- Eligible?
- —
No personal income docs; deal must DSCR.
Hard money
10% down · 12.0% · 12mo
- Down + closing
- —
- Monthly P&I
- —
- Monthly cashflow
- —
- DSCR
- —
- Eligible?
- —
Short-term bridge; refi at stabilization.
Rent comps 5 comps
| Address | Beds | Baths | Sqft | Rent | $/sqft | DOM | Units | Dist |
|---|---|---|---|---|---|---|---|---|
| 1932 Algonquin Trl Williamsburg, VA | 3.0 | 2.5 | 1384 | $2,195 | $1.59 | 12d | 1 | 0.23mi |
| 1879 Ferrell Dr Williamsburg, VA | 3.0 | 1.5 | 1206 | $1,850 | $1.53 | 3d | 1 | 0.25mi |
| 9 Sidewinder Ct Williamsburg, VA | 3.0 | 2.0 | 1170 | $1,700 | $1.45 | 3d | 1 | 0.28mi |
| 1953 Algonquin Trl Williamsburg, VA | 3.0 | 2.5 | 1384 | $1,900 | $1.37 | 21d | 1 | 0.28mi |
| 8539 Pocahontas Trl Unit 1 Williamsburg, VA | 3.0 | 2.0 | 1350 | $2,025 | $1.50 | 3d | 1 | 1.08mi |
HOA detail
- Monthly dues
- $105 · $1,260/yr
- Likely covers
- trashlandscaping
Listing history 4 events
-
2026-06-21days on market $260,000 Active 4 DOM
-
2026-06-18statusdays on market $260,000 Active 1 DOM
-
2026-06-17days on market $260,000 Coming Soon 2 DOM
-
2026-06-16$260,000 Coming Soon 1 DOM
ⓘ Source: listings_history table (triggers on properties + properties_extension) + one-shot
backfill from property_details.listing_events for pre-trigger history.
Tax reassessment forecast VA · Resets to sale price
- Current annual tax
- $2,028 · $169/mo
- Projected year-2 tax
- $2,132 · $178/mo
- Expected delta
- +$104/yr (+$9/mo · 5.1%)
ⓘ Screening estimate from a state-policy table — verify with the county assessor before closing.
Climate risk First Street
- Flood 1/10 Low FEMA zone X (unshaded) · 0% chance over 30 yrs
- Wildfire 2/10 Low
- Heat 8/10 Severe 7 d/yr ≥106°F today · 16 d/yr by 30 yrs out
- Wind 8/10 Severe 80% chance of damaging wind over 30 yrs
- Air quality 2/10 Low 0 unhealthy d/yr today · 1 by 30 yrs out
Nearby sold comps map
Loading sold comps map…
Walkable amenities ~0.75 mi
Loading nearby amenities…
Taxation est. · year 1
- Rental income
- $25,299
- − Mortgage interest
- −$14,564
- − Property taxes
- −$2,028
- − Insurance
- −$1,300
- − Repairs & maintenance
- −$2,024
- − Management
- −$2,024
- − HOA
- −$1,260
- − Depreciation
- −$7,564
- Taxable loss
- −$5,464
- Est. tax savings @ 24.0%
- +$1,311
- After-tax cash flow
- $348/yr
For passive investors: Depreciation is non-cash, so a rental often shows a tax loss while cash-flowing — sheltering income. Rental losses are passive: they offset passive income freely, and up to $25,000/yr can offset ordinary (W-2) income if you actively participate and your MAGI is under $100k (phasing out to $0 by $150k); unused losses carry forward. On sale, claimed depreciation is recaptured at up to 25%, and gains may owe capital-gains tax (a 1031 exchange can defer both). Figures are a year-1 estimate at your 24.0% rate — not tax advice; consult a CPA.
Schools (NCES district)
No district data.
Livability — Newport News
- Score
- 75/100
- State rank
- #123
- US rank
- #4018
Category grades
Schools grade is shown separately in the Schools card above.
Census & demographics
- County
- Williamsburg City · 55,270 people
- City population
- 178,950
- Metro
- Virginia Beach-Norfolk-Newport News, VA-NC
- Population (ZIP)
- 55,270
- Household income
- $105,431
- Rent vs Own
- Severe rent burden
- 1770.0
Population outlook (James City County) Hauer SSP2
- Today (2025)
- 84,286 people
- By 2030
- 89,687 · +6.4%
- By 2040
- 99,580 · +18.1%
- By 2050
- 108,487 · +28.7%
- By 2075
- 128,950 · +53.0%
- By 2100
- 138,702 · +64.6%
Race, ethnicity, and origin ACS 2023
- Neighborhood character
- Predominantly White (71%)
- Race & ethnicity
- White 71% Black 14% Two or more races 9% Hispanic / Latino 8% Asian 4%
- Hispanic origin (detail)
- Mexican 2% Puerto Rican 3%
- Common ancestry
- Slovak 3% Lithuanian 3% Romanian 3%
- Foreign-born
- 8% · Canada, China, Vietnam
- Languages at home
- 89% English-only · Spanish 5% Other Indo-European 1% Chinese 1%
Political lean MEDSL · James City
- 2024 margin
- Lean D (+6.2) · D 52.5% · R 46.3% · Other 1.1%
- 2008→2024 swing
- +15.5pp toward D · 2008: -9.2pp · 2024: 6.2pp
- All cycles
- 2024: D+6.2 2020: D+4.8 2016: R+5.1 2012: R+12.1 2008: R+9.2
Not yet ingested
- Civics
- —
Market trends
- HPI YoY
- ▼ -345.15%
- Current HPI
- 240.1637
- Rent YoY
- ▲ 5.21%
- Metro
- Virginia Beach-Norfolk-Newport News, VA-NC
- State GDP YoY
- ▲ 2.40%
- F500 in state
- 50
Industry mix (Fortune 500 HQ in VA)
| Industry | F500 HQs | Revenue |
|---|---|---|
| Aerospace / Defense | 4 | $236B |
|
||
| Technology / Defense | 3 | $32B |
|
||
| Financial Services | 2 | $176B |
|
||
| Utilities | 2 | $27B |
|
||
| Insurance | 2 | $25B |
|
||
| Technology | 2 | $15B |
|
||
Price history
+40.5% since first listed17 events — show timeline
- 2026-06-15 Coming Soon $260,000 REINMLS
- 2024-07-11 Rental Removed $1,900 BUILDIUM
- 2024-07-04 Listed for Rent $1,900 BUILDIUM
- 2024-06-28 Rental Removed $1,900 REINMLS
- 2024-06-25 Rental Removed $1,900 BUILDIUM
- 2024-06-19 Listed for Rent $1,900 REINMLS
- 2024-06-14 Rental Removed $1,900 REINMLS
- 2024-06-12 Listed for Rent $1,900 REINMLS
- 2024-06-06 Listed for Rent $1,900 BUILDIUM
- 2024-06-06 Rental Removed $1,900 REINMLS
- 2024-06-04 Listed for Rent $1,900 REINMLS
- 2022-04-19 Sold (MLS) $245,000 WMLS
- 2022-03-25 Pending — REINMLS
- 2022-03-25 Pending — WMLS
- 2022-03-23 Listed $229,900 WMLS
- 2022-03-23 Listed $229,900 REINMLS
- 2016-10-03 Listed $185,000 WMLS
Property tax history
+24.4%/yrLatest (2025): $2,028 · +6.4% YoY. Source: county tax records.
Cash-flow waterfall
monthlySold comps — $/sqft
last 12 mo · ≤1 miLoading sold comps…