10227 Oak Ave · Brandon, FL
Flood risk 1/10 · Minimal
- FEMA flood zone
- AE
- Chance of flooding over 30 yrs
- 0.0%
- Est. flood insurance / yr
- $1,737 – $8,500
Fire risk 1/10 · Minimal
- Est. fire insurance / yr
- $947 – $1,759
Heat risk 9/10 · Severe
- Hot days now (above 110°F)
- 3 days/yr
- Hot days in 30 yrs
- 7 days/yr
Wind risk 9/10 · Severe
- Chance of severe wind over 30 yrs
- 99.0%
Air-quality risk 4/10 · Minor
- Unhealthy air days now
- 4 days/yr
- Unhealthy air days in 30 yrs
- 4 days/yr
Risk factors via First Street. Map © Google.
Why this score? — see what drove the B grade
The composite is a weighted blend of 9 inputs, each scored 0–100. Each bar is that input's sub-score; the figure is the points it added to the 100-point composite (weight × sub-score).
- Cash flow +30.0/30.0
- DSCR +10.0/10.0
- 1% rule +9.9/10.0
- ARV discount +7.5/15.0
- Schools +4.2/10.0
- Livability +4.2/5.0
- Condition / age +2.5/5.0
- Rent growth +2.2/5.0
- Appreciation +0.0/10.0
$130,000
🖨 Deal sheet (PDF) 📄 Offer letter ✓ Due diligence
Listing remarks
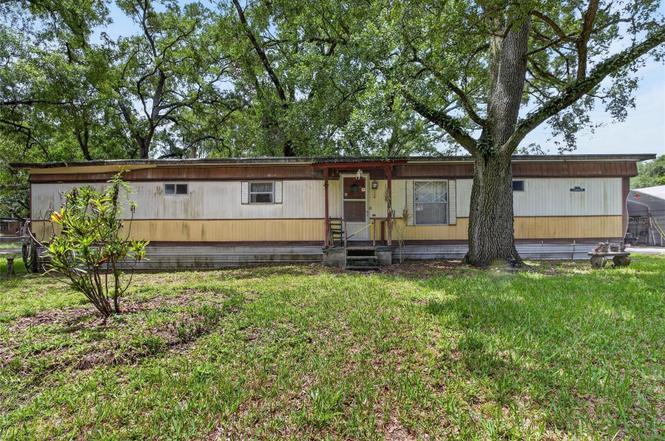
Welcome to 10227 Oak Ave, Tampa, FL! Situated on a spacious . 24-acre lot with no HOA restrictions, this 2-bedroom, 2-bath mobile home offers affordability, flexibility, and plenty of outdoor space. The property features a functional floor plan, ample parking, and room for boats, RVs, trailers, or future improvements. Conveniently located near shopping, dining, schools, and major roadways, this property is ideal for homeowners, investors, or anyone looking to enjoy the freedom of homeownership without HOA fees. Don't miss this opportunity to own a generously sized lot in a growing Tampa location!
Key facts
- Room for trailers
- Ample parking
- Room for boats
Tags
Property features AI
Exterior
- Parking: Carport with 2 spaces
- Utilities: Well water; Septic tank; Cable connected
- Home design: Single wide mobile home; One level; North facing
- Construction: Vinyl siding; Metal roof; Crawlspace foundation; Built area about 700 (public records)
- Exterior features: Outdoor storage
Interior
- Kitchen: Range; Refrigerator
- Bedrooms: 2 bedrooms
- Flooring: Carpet; Laminate
- Bathrooms: 2 full bathrooms
- Heating & cooling: Central heating; Central air conditioning
- Interior features: Ceiling fans
- Laundry & utility: Dedicated laundry room
Neighborhood map
What this means for you Summary
Snapshot
- This is a 2-bed/1.0-bath manufactured listed at $130k.
Deal economics
- At list price, monthly cash flow is $318 ($4k/yr) — positive.
- The deal already cash-flows at list — no discount required.
- Meets the 1% rule at list price ($2k rent vs $130k).
Location & tenants
- Location reads 85/100 on livability (#26 in FL, #507 nationally) — a professional / high-income tenant draw. Strengths: amenities A+, housing A+, health & safety A+.
- Hillsborough (suburban): math 47% / reading 50% proficiency, ranked #41 of 73 in FL (top 56%) — families likely to look elsewhere, expect single-tenant / working-renter base with shorter leases.
- Market conditions: Rents soft (-1.1%/yr); 248 active listings in the ZIP; 3 comparable units currently listed for rent nearby; rentals leasing fast (median 1d on market — plan ~1-2 weeks tenant-placement turnaround); 9,053 units permitted in Hillsborough County in 2024 (4,555 in 5+ unit buildings).
- This rent runs 35% of the median local income ($66k/yr) — at the standard rent-burdened threshold; future hikes will face affordability resistance.
Forward outlook
- Local home prices are declining (-3.0%/yr); year-one equity from $899 of loan paydown is wiped out by about $4k of value loss. Plan a longer hold.
- Hillsborough County population projected at +37% by 2050 — long-run rental-demand tailwind backs the buy-and-hold thesis.
Negotiation context
- Only 6 days on market — expect competitive offers; lowballing is unlikely to land.
- Current owner paid $25k; list at $130k implies a 420% gain — meaningful room to come down on a strong offer.
Risks & watch-outs
- Watch-outs: flood insurance adds $427/mo.
- Climate carrying-cost: in FEMA flood zone AE (mandatory federal flood insurance); severe wind risk, 99% chance of damaging wind over 30y; extreme-heat days projected 3→7/yr by 2055 (HVAC capex compounding) — expect insurance premiums to compound above CPI over the hold.
Questions for the listing agent
- Built in 1973 — when were the roof, HVAC, electrical panel, plumbing, and water heater last replaced?
- What's the actual annual flood-insurance premium (NFIP or private), and is the property in a SFHA with mandatory coverage?
- Is there a deadline driving the sale (1031 exchange, divorce, estate, relocation)? That informs how much negotiation room exists.
- What's the average days-on-market for RENTAL listings here right now (not sales)? A rising rental-DOM trend means longer vacancies and softer asking-rent achievability than the comps imply.
- What's the recent tenant-quality profile in this submarket — average credit score on applications, eviction rate, late-payment / NSF rate, and stable-employment percentage? A property-management company in the area should have these aggregated.
- How much new for-sale + rental construction is in the pipeline within 1–3 miles? Heavy new supply typically softens prices + rents 12–24 months out; constrained supply supports both.
Investment metrics
- 1% rule
- 1.49% ✓
- Cap rate
- 13.17%
- Cash-on-cash
- 24.55%
- DSCR
- 2.09
- GRM
- 5.6
CMA / ARV
No comps found within radius.
Projected returns pro-forma
-3.0% appreciation · 0.0% rent growth · sell at horizon
- IRR
- -4.8%
- Equity multiple
- 0.83×
- Total profit
- $-6,238
- Equity at exit
- $19,383
- IRR
- -0.2%
- Equity multiple
- 0.99×
- Total profit
- $-316
- Equity at exit
- $11,240
Cash invested: $36,400 (down + closing). Projections, not guarantees.
Landlord ↔ Tenant lean methodology
- Overall (STATE)
- 87 Strongly Landlord-Friendly
- State Florida
- 87 Strongly Landlord-Friendly · R+3
- County
- — inherits STATE
- City
- — inherits STATE
ZIP-level market 33619
- Home prices YoY
- -30.2%
- Rents YoY
- -1.1%
- Active inventory
- 248
- Price-to-rent
- 5.6×
Monthly cashflow live
- Estimated rent
- $1,931 medium interval (Pro) →
- Mortgage (P&I)
- −$682
- Tax from tax record
- −$45 /mo · $539/yr
- Insurance
- −$54
- Flood insurance flood zone
- −$427 /mo · $5,118/yr
- HOA
- −$0
- Vacancy / Maint / Mgmt
- −$406
- Net cashflow
- $318
Break-even live
Sensitivity live
| Price | -10% $392 | -5% $355 | +0% $318 | +5% $281 | +10% $245 |
|---|---|---|---|---|---|
| Rent | -10% $166 | -5% $242 | +0% $318 | +5% $395 | +10% $471 |
| Rate | -1.0pp $384 | -0.5pp $351 | base $318 | +0.5pp $285 | +1.0pp $250 |
UW: 25.0% down · 7.5% · 30yr · 1.5% tax · 5.0% vac · 8.0% maint · 8.0% mgmt
Financing live
Cash to close
- Down payment
- $32,500
- Closing costs
- $3,900
- Reserves months
- —
- Total cash needed
- —
Loan-product check · same deal, 3 products live
Conventional
25% down · 7.5% · 30yr
- Down + closing
- —
- Monthly P&I
- —
- Monthly cashflow
- —
- DSCR
- —
- Eligible?
- —
Personal DTI + credit; lowest rate.
DSCR
20% down · 8.5% · 30yr
- Down + closing
- —
- Monthly P&I
- —
- Monthly cashflow
- —
- DSCR
- —
- Eligible?
- —
No personal income docs; deal must DSCR.
Hard money
10% down · 12.0% · 12mo
- Down + closing
- —
- Monthly P&I
- —
- Monthly cashflow
- —
- DSCR
- —
- Eligible?
- —
Short-term bridge; refi at stabilization.
Rent comps 3 comps
| Address | Beds | Baths | Sqft | Rent | $/sqft | DOM | Units | Dist |
|---|---|---|---|---|---|---|---|---|
| 10881 Caladesi Ave Tampa, FL | 1.0–2.0 | 1.0–2.0 | 935 | $2,476 | $2.65 | 0d | 17 | 1.32mi |
| 4006 Sabal Park Dr Tampa, FL | 1.0–2.0 | 1.0–2.0 | 852 | $1,620 | $1.90 | 0d | 23 | 1.33mi |
| 10246 Douglas Oaks Cir Tampa, FL | 1.0–4.0 | 1.0–2.0 | 1070 | $1,543 | $1.44 | 0d | 36 | 1.42mi |
Listing history 5 events
-
2026-06-21days on market $130,000 Active 6 DOM
-
2026-06-18days on market $130,000 Active 3 DOM
-
2026-06-17days on market $130,000 Active 2 DOM
-
2026-06-15remarks 603-char remark
-
2026-06-15$130,000 Active 1 DOM
ⓘ Source: listings_history table (triggers on properties + properties_extension) + one-shot
backfill from property_details.listing_events for pre-trigger history.
Tax reassessment forecast FL · Resets to sale price
- Current annual tax
- $539 · $45/mo
- Projected year-2 tax
- $1,079 · $90/mo
- Expected delta
- +$540/yr (+$45/mo · 100.1%)
ⓘ Screening estimate from a state-policy table — verify with the county assessor before closing.
Climate risk First Street
- Flood 1/10 Low FEMA zone AE · 0% chance over 30 yrs
- Wildfire 1/10 Low
- Heat 9/10 Extreme 3 d/yr ≥110°F today · 7 d/yr by 30 yrs out
- Wind 9/10 Extreme 99% chance of damaging wind over 30 yrs
- Air quality 4/10 Moderate 4 unhealthy d/yr today · 4 by 30 yrs out
Nearby sold comps map
Loading sold comps map…
Walkable amenities ~0.75 mi
Loading nearby amenities…
Taxation est. · year 1
- Rental income
- $23,174
- − Mortgage interest
- −$7,282
- − Property taxes
- −$539
- − Insurance
- −$5,768
- − Repairs & maintenance
- −$1,854
- − Management
- −$1,854
- − Depreciation
- −$3,782
- Taxable income
- $2,094
- Est. tax owed @ 24.0%
- −$503
- After-tax cash flow
- $3,316/yr
For passive investors: Depreciation is non-cash, so a rental often shows a tax loss while cash-flowing — sheltering income. Rental losses are passive: they offset passive income freely, and up to $25,000/yr can offset ordinary (W-2) income if you actively participate and your MAGI is under $100k (phasing out to $0 by $150k); unused losses carry forward. On sale, claimed depreciation is recaptured at up to 25%, and gains may owe capital-gains tax (a 1031 exchange can defer both). Figures are a year-1 estimate at your 24.0% rate — not tax advice; consult a CPA.
Schools (NCES district)
- District
- Hillsborough
- NCES district ID
- 1200870
- Math proficiency
- 47% ▼ -8.00%
- Reading proficiency
- 50% ▼ -4.00%
- Median HH income
- $50,622
- Composite
- 41.6/100
- National rank
- #3435
- State rank
- #41 of 73 in FL
Livability — Brandon
- Score
- 85/100
- State rank
- #26
- US rank
- #507
Category grades
Schools grade is shown separately in the Schools card above.
Census & demographics
- Census place
- Brandon, FL
- County
- Hillsborough County · 1,540,968 people
- City population
- 92,716
- Metro
- Tampa-St. Petersburg-Clearwater, FL
- Population (ZIP)
- 41,396
- Household income
- $66,134
- Rent vs Own
- Severe rent burden
- 2006.0
Population outlook (Hillsborough County) Hauer SSP2
- Today (2025)
- 1,607,022 people
- By 2030
- 1,733,968 · +7.9%
- By 2040
- 1,979,565 · +23.2%
- By 2050
- 2,203,427 · +37.1%
- By 2075
- 2,667,893 · +66.0%
- By 2100
- 2,891,558 · +79.9%
Race, ethnicity, and origin ACS 2023
- Neighborhood character
- Highly diverse neighborhood (Simpson 0.72)
- Race & ethnicity
- Hispanic / Latino 36% Black 28% White 27% Two or more races 21% Asian 3%
- Hispanic origin (detail)
- Mexican 5% Puerto Rican 13% Cuban 11% Dominican 1%
- Common ancestry
- Hispanic 2% Iranian 1% Italian 1%
- Foreign-born
- 22% · Canada, Jamaica, Vietnam
- Languages at home
- 64% English-only · Spanish 28% Other Indo-European 1% French/Haitian/Cajun 1%
Political lean MEDSL · Hillsborough
- 2024 margin
- Toss-up / Even · D 47.8% · R 50.9% · Other 1.3%
- 2008→2024 swing
- -10.2pp toward R · 2008: 7.1pp · 2024: -3.1pp
- All cycles
- 2024: R+3.1 2020: D+6.9 2016: D+6.8 2012: D+6.7 2008: D+7.1
Not yet ingested
- Civics
- —
Market trends
- HPI YoY
- ▼ -162.52%
- Current HPI
- 375.4923
- Rent YoY
- ▼ -1.14%
- Metro
- Tampa-St. Petersburg-Clearwater, FL
- State GDP YoY
- ▲ 3.28%
- F500 in state
- 36
Industry mix (Fortune 500 HQ in FL)
| Industry | F500 HQs | Revenue |
|---|---|---|
| Industrial Technology | 2 | $29B |
|
||
| Insurance | 2 | $17B |
|
||
| Retail | 1 | $60B |
|
||
| Technology Distribution | 1 | $58B |
|
||
| Homebuilding | 1 | $35B |
|
||
| Technology Manufacturing | 1 | $35B |
|
||
Price history
+1707.3% since first listed4 events — show timeline
- 2026-06-15 Listed $130,000 Stellar MLS as Distributed by MLS Grid
- 1986-11-01 Sold (Public Records) $25,000 Public Records
- 1982-12-01 Sold (Public Records) $7,200 Public Records
- 1970-01-01 Sold (Public Records) $7,193 Public Records
Property tax history
+6.5%/yrLatest (2025): $539 · +6.5% YoY. Source: county tax records.
Cash-flow waterfall
monthlySold comps — $/sqft
last 12 mo · ≤1 miLoading sold comps…