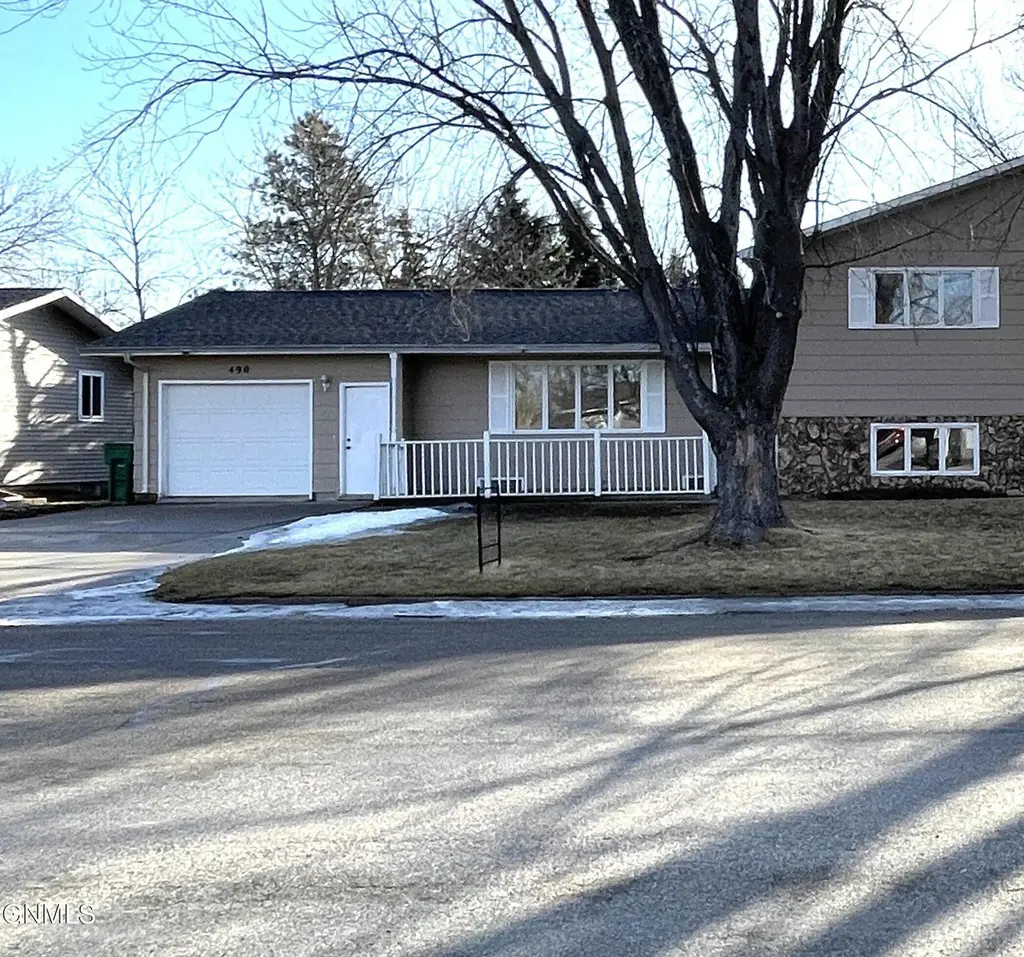
490 Joal Dr · Carrington, ND
Flood risk No data
- FEMA flood zone
- —
- Chance of flooding over 30 yrs
- —
- Est. flood insurance / yr
- —
Fire risk No data
- Est. fire insurance / yr
- —
Heat risk No data
- Hot days now (above threshold)
- —
- Hot days in 30 yrs
- —
Wind risk No data
- Chance of severe wind over 30 yrs
- —
Air-quality risk No data
- Unhealthy air days now
- —
- Unhealthy air days in 30 yrs
- —
Risk factors via First Street. Map © Google.
Why this score? — see what drove the D grade
The composite is a weighted blend of 9 inputs, each scored 0–100. Each bar is that input's sub-score; the figure is the points it added to the 100-point composite (weight × sub-score).
- Appreciation +8.4/10.0
- Cash flow +8.2/30.0
- ARV discount +7.5/15.0
- Schools +5.0/10.0
- Livability +3.6/5.0
- Rent growth +2.5/5.0
- Condition / age +2.5/5.0
- DSCR +2.2/10.0
- 1% rule +2.0/10.0
$175,000
🖨 Deal sheet (PDF) 📄 Offer letter ✓ Due diligence
Key facts
- Newer shingles
- Large backyard
- Welcoming deck
Tags
Property features AI
Exterior
- Parking: Attached garage (1 car)
- Utilities: Public water; Public sewer
- Home design: Residential townhouse; Multi/split levels
- Construction: Masonite exterior; Built with asphalt roofing
- Exterior features: Patio; Porch; Asphalt roof; Public-maintained asphalt road frontage on a city street (61 x 125 lot dimensions)
Interior
- Kitchen: Dishwasher; Electric range; Range hood; Refrigerator
- Flooring: Carpet; Laminate
- Bathrooms: One full bathroom; One three-quarter bathroom
- Heating & cooling: Forced air heating (natural gas); Central air conditioning
- Interior features: High-speed internet; Partially finished basement with exterior entry; Storage shed(s)
- Laundry & utility: Washer; Dryer
Neighborhood map
What this means for you Summary
Snapshot
- This is a 3-bed/2.0-bath other listed at $175k.
Deal economics
- At list price, monthly cash flow is $-163 ($-2k/yr) — negative.
- To cash-flow at today's rent, offer at most $146k (16.5% below list).
- To meet the 1% rule (rent ≥ 1% of price), the offer needs to be $123k (29.6% below list).
- Recommended offer: $123k (29.6% below list) — sets the bar for 1% rule.
Location & tenants
- Location reads 72/100 on livability (#45 in ND) — a middle-class / working-renter tenant base. Strengths: crime A+, cost of living A+, housing A+; Watch: amenities F, commute F, health & safety D-.
- Carrington 49 (rural): math 60% / reading 56% proficiency, ranked #4 of 53 in ND (top 8%) — acceptable for families but not a draw, mixed tenant base, ~2y average lease; only 17% free/reduced lunch — higher-income household profile.
- Zoned schools: Carrington Elementary School (math 57% / reading 47%, grade C-, #54 of 236 statewide, top 26%, 358 students, 18% FRL); Carrington High School (math 62% / reading 62%, grade B-, #6 of 144 statewide, top 4%, 255 students, 16% FRL) — zoned schools at 17% FRL track the district average.
- Market conditions: 9 active listings in the ZIP; 2 units permitted in Foster County in 2024 (0 in 5+ unit buildings).
Forward outlook
- In year one you build about $13k of equity ($1k loan paydown + $12k appreciation (6.9% local appreciation)).
- Foster County population projected at +6% by 2050 — modest demand growth; plan on rents tracking national, not racing it.
- By year 3, paydown + projected appreciation supports a ~$33k cash-out refi (75% LTV) — recoverable capital for the next deal without selling this one.
Negotiation context
- It's been on market 91 days — a 9% lower offer ($159k) is reasonable based on typical stale-listing flexibility.
Questions for the listing agent
- What do current leases actually rent for vs. the listed asking? Can we see a recent rent roll and the last 12 months of T-12 income?
- It's been on market 91 days. Have you received any prior offers? Is the seller open to a 30% concession, seller financing, or rate buy-down credit?
- Built in 1977 — when were the roof, HVAC, electrical panel, plumbing, and water heater last replaced?
- Why hasn't it sold? Are there any deal-killer items the seller is aware of (foundation, flood, title, zoning, code violations)?
- Is there a deadline driving the sale (1031 exchange, divorce, estate, relocation)? That informs how much negotiation room exists.
- Schools are B-rated — typically a magnet for longer-tenancy family renters. What's the average tenant stay here, and is there a school-zone premium baked into asking?
- The area grade is low — what's the realistic commute time and amenity access for the typical tenant pool here? Any planned neighborhood developments (good or bad) we should know about?
- What's the average days-on-market for RENTAL listings here right now (not sales)? A rising rental-DOM trend means longer vacancies and softer asking-rent achievability than the comps imply.
- What's the recent tenant-quality profile in this submarket — average credit score on applications, eviction rate, late-payment / NSF rate, and stable-employment percentage? A property-management company in the area should have these aggregated.
- How much new for-sale + rental construction is in the pipeline within 1–3 miles? Heavy new supply typically softens prices + rents 12–24 months out; constrained supply supports both.
Investment metrics
- 1% rule
- 0.70% ✗
- Cap rate
- 5.17%
- Cash-on-cash
- -4.00%
- DSCR
- 0.82
- GRM
- 11.8
CMA / ARV
No comps found within radius.
Projected returns pro-forma
6.89% appreciation · 3.0% rent growth · sell at horizon
- IRR
- 14.3%
- Equity multiple
- 2.01×
- Total profit
- $49,458
- Equity at exit
- $119,972
- IRR
- 14.4%
- Equity multiple
- 4.09×
- Total profit
- $151,622
- Equity at exit
- $226,727
Cash invested: $49,000 (down + closing). Projections, not guarantees.
Landlord ↔ Tenant lean methodology
- Overall (STATE)
- 82 Strongly Landlord-Friendly
- State North Dakota
- 82 Strongly Landlord-Friendly · R+20
- County
- — inherits STATE
- City
- — inherits STATE
ZIP-level market 58421
- Home prices YoY
- 5.5%
- Active inventory
- 9
- Price-to-rent
- 11.8×
Monthly cashflow live
- Estimated rent
- $1,233 medium interval (Pro) →
- Mortgage (P&I)
- −$918
- Tax from tax record
- −$147 /mo · $1,759/yr
- Insurance
- −$73
- HOA
- −$0
- Vacancy / Maint / Mgmt
- −$259
- Net cashflow
- $-163
Break-even live
Sensitivity live
| Price | -10% $-64 | -5% $-114 | +0% $-163 | +5% $-213 | +10% $-262 |
|---|---|---|---|---|---|
| Rent | -10% $-261 | -5% $-212 | +0% $-163 | +5% $-115 | +10% $-66 |
| Rate | -1.0pp $-75 | -0.5pp $-119 | base $-163 | +0.5pp $-209 | +1.0pp $-255 |
UW: 25.0% down · 7.5% · 30yr · 1.5% tax · 5.0% vac · 8.0% maint · 8.0% mgmt
Financing live
Cash to close
- Down payment
- $43,750
- Closing costs
- $5,250
- Reserves months
- —
- Total cash needed
- —
Loan-product check · same deal, 3 products live
Conventional
25% down · 7.5% · 30yr
- Down + closing
- —
- Monthly P&I
- —
- Monthly cashflow
- —
- DSCR
- —
- Eligible?
- —
Personal DTI + credit; lowest rate.
DSCR
20% down · 8.5% · 30yr
- Down + closing
- —
- Monthly P&I
- —
- Monthly cashflow
- —
- DSCR
- —
- Eligible?
- —
No personal income docs; deal must DSCR.
Hard money
10% down · 12.0% · 12mo
- Down + closing
- —
- Monthly P&I
- —
- Monthly cashflow
- —
- DSCR
- —
- Eligible?
- —
Short-term bridge; refi at stabilization.
Listing history 18 events
-
2026-06-22days on market $175,000 Active 91 DOM
-
2026-06-21days on market $175,000 Active 90 DOM
-
2026-06-21days on market $175,000 Active 89 DOM
-
2026-06-18days on market $175,000 Active 87 DOM
-
2026-06-17days on market $175,000 Active 86 DOM
-
2026-06-16days on market $175,000 Active 85 DOM
-
2026-06-15days on market $175,000 Active 84 DOM
-
2026-06-13days on market $175,000 Active 82 DOM
-
2026-06-12days on market $175,000 Active 81 DOM
-
2026-06-09days on market $175,000 Active 78 DOM
-
2026-06-08days on market $175,000 Active 77 DOM
-
2026-06-07days on market $175,000 Active 76 DOM
-
2026-06-05days on market $175,000 Active 74 DOM
-
2026-06-04days on market $175,000 Active 72 DOM
-
2026-06-02days on market $175,000 Active 71 DOM
-
2026-06-01days on market $175,000 Active 70 DOM
-
2026-05-31days on market $175,000 Active 69 DOM
-
2026-03-23$175,000 Active
ⓘ Source: listings_history table (triggers on properties + properties_extension) + one-shot
backfill from property_details.listing_events for pre-trigger history.
Tax reassessment forecast ND · Resets to sale price
- Current annual tax
- $1,759 · $147/mo
- Projected year-2 tax
- $1,759 · $147/mo
- Expected delta
- $0/yr ($0/mo · 0.0%)
ⓘ Screening estimate from a state-policy table — verify with the county assessor before closing.
Nearby sold comps map
Loading sold comps map…
Walkable amenities ~0.75 mi
Loading nearby amenities…
Taxation est. · year 1
- Rental income
- $14,793
- − Mortgage interest
- −$9,803
- − Property taxes
- −$1,759
- − Insurance
- −$875
- − Repairs & maintenance
- −$1,183
- − Management
- −$1,183
- − Depreciation
- −$5,091
- Taxable loss
- −$5,102
- Est. tax savings @ 24.0%
- +$1,224
- After-tax cash flow
- $-736/yr
For passive investors: Depreciation is non-cash, so a rental often shows a tax loss while cash-flowing — sheltering income. Rental losses are passive: they offset passive income freely, and up to $25,000/yr can offset ordinary (W-2) income if you actively participate and your MAGI is under $100k (phasing out to $0 by $150k); unused losses carry forward. On sale, claimed depreciation is recaptured at up to 25%, and gains may owe capital-gains tax (a 1031 exchange can defer both). Figures are a year-1 estimate at your 24.0% rate — not tax advice; consult a CPA.
Schools (NCES district)
- District
- Carrington 49
- NCES district ID
- 3800053
- Math proficiency
- 60% ▬ 0.00%
- Reading proficiency
- 56% ▼ -4.00%
- Median HH income
- $52,555
- Composite
- 49.68/100
- National rank
- #1970
- State rank
- #4 of 53 in ND
Livability — Carrington
- Score
- 72/100
- State rank
- #45
- US rank
- #5879
Category grades
Schools grade is shown separately in the Schools card above.
Census & demographics
- Census place
- Carrington, ND
- Population (ZIP)
- 3,043
Population outlook (Foster County) Hauer SSP2
- Today (2025)
- 3,329 people
- By 2030
- 3,369 · +1.2%
- By 2040
- 3,467 · +4.1%
- By 2050
- 3,527 · +5.9%
- By 2075
- 4,113 · +23.6%
- By 2100
- 4,472 · +34.3%
Race, ethnicity, and origin ACS 2023
- Neighborhood character
- Predominantly White (94%)
- Race & ethnicity
- White 94% Two or more races 4% Asian 1%
- Common ancestry
- Portuguese 26% Romanian 2% Slovak 1%
- Foreign-born
- 1%
- Languages at home
- 98% English-only · Other Indo-European 2%
Political lean MEDSL · Foster
- 2024 margin
- Solid R (+58.6) · D 19.8% · R 78.4% · Other 1.8%
- 2008→2024 swing
- -44.8pp toward R · 2008: -13.8pp · 2024: -58.6pp
- All cycles
- 2024: R+58.6 2020: R+55.6 2016: R+52.5 2012: R+25.3 2008: R+13.8
Not yet ingested
- Civics
- —
Market trends
- HPI YoY
- ▲ 6.89%
- Current HPI
- 131.1089
- Rent YoY
- —
- Metro
- —
- State GDP YoY
- ▲ 2.09%
- F500 in state
- 2
Industry mix (Fortune 500 HQ in ND)
| Industry | F500 HQs | Revenue |
|---|---|---|
| Utilities / Construction | 1 | $6B |
|
||
Price history
1 event — show timeline
- 2026-03-23 Listed $175,000 GNMLS
Cash-flow waterfall
monthlySold comps — $/sqft
last 12 mo · ≤1 miLoading sold comps…