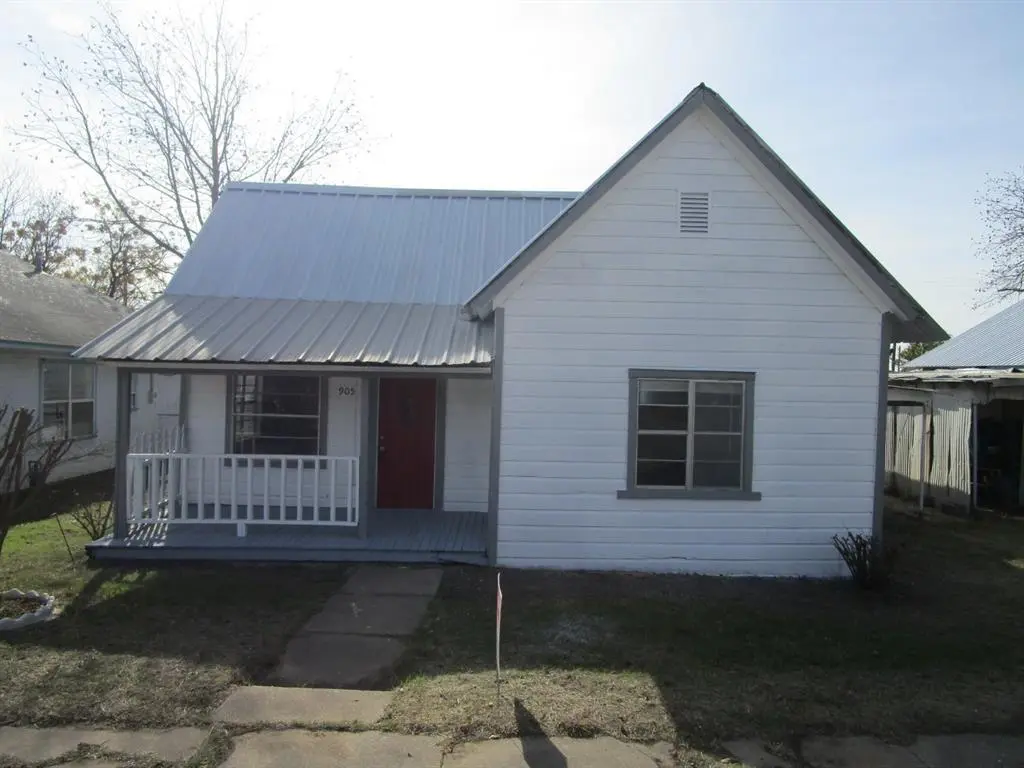
905 Wallis Ave · Santa Anna, TX
Flood risk No data
- FEMA flood zone
- —
- Chance of flooding over 30 yrs
- —
- Est. flood insurance / yr
- —
Fire risk No data
- Est. fire insurance / yr
- —
Heat risk No data
- Hot days now (above threshold)
- —
- Hot days in 30 yrs
- —
Wind risk No data
- Chance of severe wind over 30 yrs
- —
Air-quality risk No data
- Unhealthy air days now
- —
- Unhealthy air days in 30 yrs
- —
Risk factors via First Street. Map © Google.
Why this score? — see what drove the B- grade
The composite is a weighted blend of 9 inputs, each scored 0–100. Each bar is that input's sub-score; the figure is the points it added to the 100-point composite (weight × sub-score).
- Cash flow +30.0/30.0
- 1% rule +10.0/10.0
- DSCR +10.0/10.0
- Appreciation +4.8/10.0
- Schools +4.0/10.0
- Livability +3.5/5.0
- Rent growth +2.5/5.0
- Condition / age +2.5/5.0
- ARV discount +0.0/15.0
$55,000
🖨 Deal sheet 📄 Offer letter ✓ Due diligence
Listing remarks MLS
Seller will finance. Welcome to 905 Wallis Ave. Santa Anna, TX. Located on the main drive in Santa Anna, this home has lots to offer. Outside you will find a covered porch, carport, metal roof, fenced yard and a large shed. New exterior paint enhances the curb appeal as well. The interior features new paint and some new flooring. Schedule your showing today. Seller is a licensed broker in Texas.
Key facts
- Covered porch
- Metal roof
- Fenced yard
Tags
Neighborhood map
What this means for you Summary
Snapshot
- This is a 3-bed/1.0-bath single-family listed at $55k.
Deal economics
- At list price, monthly cash flow is $377 ($5k/yr) — positive.
- The deal already cash-flows at list — no discount required.
- Meets the 1% rule at list price ($988 rent vs $55k).
- Recommended offer: $50k (9.0% below list) — sets the bar for market timing.
Location & tenants
- Location reads 69/100 on livability (#444 in TX) — a middle-class / working-renter tenant base. Strengths: crime A+, cost of living A+, housing A+; Watch: schools D+, health & safety D+, amenities F.
- Santa Anna ISD (rural): math 50% / reading 40% proficiency, ranked #582 of 1,141 in TX (top 51%) — families likely to look elsewhere, expect single-tenant / working-renter base with shorter leases; 61% free/reduced lunch — lower-income household profile, screen leases tightly.
- Market conditions: 22 active listings in the ZIP; 5 units permitted in Coleman County in 2024 (0 in 5+ unit buildings).
Forward outlook
- In year one you build about $142 of equity ($380 loan paydown + $-238 appreciation (-0.4% local appreciation)).
- Coleman County population projected at -28% by 2050 — secular population decline; favor cash flow + early exit over multi-decade hold.
- At projected returns (-0.4% appreciation + 3.0% rent growth), your $15k cash investment doubles in ~4 years — after that, you're playing with house money.
Negotiation context
- It's been on market 95 days — a 9% lower offer ($50k) is reasonable based on typical stale-listing flexibility.
- 7 sale attempts since 14y ago with the ask held roughly flat each time — persistent listings suggest the price (not the market) is what's stuck; bring a comps-based counter.
- Current owner paid $28k; list at $55k implies a 97% gain — meaningful room to come down on a strong offer.
Risks & watch-outs
- Watch-outs: built in 1948 — expect roof / HVAC / electrical / plumbing capex.
Questions for the listing agent
- It's been on market 95 days. Have you received any prior offers? Is the seller open to a 9% concession, seller financing, or rate buy-down credit?
- Built in 1948 — when were the roof, HVAC, electrical panel, plumbing, and water heater last replaced?
- Why hasn't it sold? Are there any deal-killer items the seller is aware of (foundation, flood, title, zoning, code violations)?
- Is there a deadline driving the sale (1031 exchange, divorce, estate, relocation)? That informs how much negotiation room exists.
- Schools are D-rated, which usually means shorter tenancies and higher turnover. Who's the typical renter profile here, and what's been the actual vacancy rate?
- What's the average days-on-market for RENTAL listings here right now (not sales)? A rising rental-DOM trend means longer vacancies and softer asking-rent achievability than the comps imply.
- What's the recent tenant-quality profile in this submarket — average credit score on applications, eviction rate, late-payment / NSF rate, and stable-employment percentage? A property-management company in the area should have these aggregated.
- How much new for-sale + rental construction is in the pipeline within 1–3 miles? Heavy new supply typically softens prices + rents 12–24 months out; constrained supply supports both.
Investment metrics
- 1% rule
- 1.80% ✓
- Cap rate
- 14.51%
- Cash-on-cash
- 29.34%
- DSCR
- 2.31
- GRM
- 4.6
CMA / ARV
- ARV (median comp)
- $46,569
- List price
- $55,000
- Delta
- 18.10%
- Verdict
- OVERPRICED
- Comps
- 5 within 1.0 mi
Show comp detail 1 sale within ~0.75 mi
| Address | Dist | Beds/Ba | Sqft | Sold | Price | $/sf | Match |
|---|---|---|---|---|---|---|---|
| 205 N 5th St | 0.08mi | 2/1.0 (-1) | 1,020 (+11%) | 11mo | $39,900 | $39 | 64 |
Match score weights: distance 35% · size 25% · config 20% · recency 20%. Top-matched comps best support the ARV.
Projected returns pro-forma
-0.43% appreciation · 3.0% rent growth · sell at horizon
- IRR
- 29.0%
- Equity multiple
- 2.38×
- Total profit
- $21,291
- Equity at exit
- $14,788
- IRR
- 33.2%
- Equity multiple
- 4.61×
- Total profit
- $55,525
- Equity at exit
- $16,858
Cash invested: $15,400 (down + closing). Projections, not guarantees.
Landlord ↔ Tenant lean methodology
- Overall (STATE)
- 87 Strongly Landlord-Friendly
- State Texas
- 87 Strongly Landlord-Friendly · R+5
- County
- — inherits STATE
- City
- — inherits STATE
ZIP-level market 76878
- Home prices YoY
- -0.4%
- Active inventory
- 22
- Price-to-rent
- 4.6×
Monthly cashflow live
- Estimated rent
- $988 medium interval (Pro) →
- Mortgage (P&I)
- −$288
- Tax from tax record
- −$92 /mo · $1,108/yr
- Insurance
- −$23
- HOA
- −$0
- Vacancy / Maint / Mgmt
- −$207
- Net cashflow
- $377
Break-even live
UW: 25.0% down · 7.5% · 30yr · 1.5% tax · 5.0% vac · 8.0% maint · 8.0% mgmt
Financing live
Cash to close
- Down payment
- $13,750
- Closing costs
- $1,650
- Reserves months
- —
- Total cash needed
- —
Loan-product check · same deal, 3 products live
Conventional
25% down · 7.5% · 30yr
- Down + closing
- —
- Monthly P&I
- —
- Monthly cashflow
- —
- DSCR
- —
- Eligible?
- —
Personal DTI + credit; lowest rate.
DSCR
20% down · 8.5% · 30yr
- Down + closing
- —
- Monthly P&I
- —
- Monthly cashflow
- —
- DSCR
- —
- Eligible?
- —
No personal income docs; deal must DSCR.
Hard money
10% down · 12.0% · 12mo
- Down + closing
- —
- Monthly P&I
- —
- Monthly cashflow
- —
- DSCR
- —
- Eligible?
- —
Short-term bridge; refi at stabilization.
Listing history 40 events
-
2026-06-18days on market $55,000 Active 95 DOM
-
2026-06-17days on market $55,000 Active 94 DOM
-
2026-06-16days on market $55,000 Active 93 DOM
-
2026-06-15days on market $55,000 Active 92 DOM
-
2026-06-15days on market $55,000 Active 91 DOM
-
2026-06-13days on market $55,000 Active 90 DOM
-
2026-06-12days on market $55,000 Active 89 DOM
-
2026-06-09days on market $55,000 Active 86 DOM
-
2026-06-08days on market $55,000 Active 85 DOM
-
2026-06-08days on market $55,000 Active 84 DOM
-
2026-06-05days on market $55,000 Active 82 DOM
-
2026-06-03days on market $55,000 Active 80 DOM
-
2026-06-02days on market $55,000 Active 79 DOM
-
2026-06-01days on market $55,000 Active 78 DOM
-
2026-05-31days on market $55,000 Active 77 DOM
-
2026-05-14status Active 398-char remark
Show marketing remark (398 chars)
Seller will finance. Welcome to 905 Wallis Ave. Santa Anna, TX. Located on the main drive in Santa Anna, this home has lots to offer. Outside you will find a covered porch, carport, metal roof, fenced yard and a large shed. New exterior paint enhances the curb appeal as well. The interior features new paint and some new flooring. Schedule your showing today. Seller is a licensed broker in Texas.
-
2026-03-23status Pending 398-char remark
Show marketing remark (398 chars)
Seller will finance. Welcome to 905 Wallis Ave. Santa Anna, TX. Located on the main drive in Santa Anna, this home has lots to offer. Outside you will find a covered porch, carport, metal roof, fenced yard and a large shed. New exterior paint enhances the curb appeal as well. The interior features new paint and some new flooring. Schedule your showing today. Seller is a licensed broker in Texas.
-
2026-03-18historical Active Option Contract 398-char remark
Show marketing remark (398 chars)
Seller will finance. Welcome to 905 Wallis Ave. Santa Anna, TX. Located on the main drive in Santa Anna, this home has lots to offer. Outside you will find a covered porch, carport, metal roof, fenced yard and a large shed. New exterior paint enhances the curb appeal as well. The interior features new paint and some new flooring. Schedule your showing today. Seller is a licensed broker in Texas.
-
2026-01-22$55,000 Active 398-char remark
Show marketing remark (398 chars)
Seller will finance. Welcome to 905 Wallis Ave. Santa Anna, TX. Located on the main drive in Santa Anna, this home has lots to offer. Outside you will find a covered porch, carport, metal roof, fenced yard and a large shed. New exterior paint enhances the curb appeal as well. The interior features new paint and some new flooring. Schedule your showing today. Seller is a licensed broker in Texas.
-
2019-03-11soldstatus
-
2019-03-08soldstatus Sold 212-char remark
Show marketing remark (212 chars)
ATTENTION INVESTORS! Cash flowing turnkey rental opportunity, currently bringing in $375 per month. Property is being sold AS-IS. Please do NOT disturb tenants! Showing and offer instructions are in supplements.
-
2019-02-17status Pending 212-char remark
Show marketing remark (212 chars)
ATTENTION INVESTORS! Cash flowing turnkey rental opportunity, currently bringing in $375 per month. Property is being sold AS-IS. Please do NOT disturb tenants! Showing and offer instructions are in supplements.
-
2018-12-13price $19,900 212-char remark
Show marketing remark (212 chars)
ATTENTION INVESTORS! Cash flowing turnkey rental opportunity, currently bringing in $375 per month. Property is being sold AS-IS. Please do NOT disturb tenants! Showing and offer instructions are in supplements.
-
2018-09-25$22,000 Active 212-char remark
Show marketing remark (212 chars)
ATTENTION INVESTORS! Cash flowing turnkey rental opportunity, currently bringing in $375 per month. Property is being sold AS-IS. Please do NOT disturb tenants! Showing and offer instructions are in supplements.
-
2018-05-15historical
-
2017-11-20$22,000 Active
-
2017-11-17historical
-
2017-09-14price $23,000
-
2017-09-05price $24,000
-
2017-08-18price $25,000
-
2017-07-22$26,000 Active
-
2013-09-16soldstatus $27,855
-
2012-10-04soldstatus
-
2012-09-25soldstatus
-
2012-09-20historical
-
2012-08-17historical
-
2012-05-17$19,000
-
2012-05-17$9,700
-
2012-02-07soldstatus
-
2005-01-07soldstatus
ⓘ Source: listings_history table (triggers on properties + properties_extension) + one-shot
backfill from property_details.listing_events for pre-trigger history.
Tax reassessment forecast TX · Resets to sale price
- Current annual tax
- $1,108 · $92/mo
- Projected year-2 tax
- $1,108 · $92/mo
- Expected delta
- $0/yr ($0/mo · 0.0%)
ⓘ Screening estimate from a state-policy table — verify with the county assessor before closing.
Nearby sold comps map
Loading sold comps map…
Walkable amenities ~0.75 mi
Loading nearby amenities…
Taxation est. · year 1
- Rental income
- $11,852
- − Mortgage interest
- −$3,081
- − Property taxes
- −$1,108
- − Insurance
- −$275
- − Repairs & maintenance
- −$948
- − Management
- −$948
- − Depreciation
- −$1,600
- Taxable income
- $3,891
- Est. tax owed @ 24.0%
- −$934
- After-tax cash flow
- $3,585/yr
For passive investors: Depreciation is non-cash, so a rental often shows a tax loss while cash-flowing — sheltering income. Rental losses are passive: they offset passive income freely, and up to $25,000/yr can offset ordinary (W-2) income if you actively participate and your MAGI is under $100k (phasing out to $0 by $150k); unused losses carry forward. On sale, claimed depreciation is recaptured at up to 25%, and gains may owe capital-gains tax (a 1031 exchange can defer both). Figures are a year-1 estimate at your 24.0% rate — not tax advice; consult a CPA.
Schools (NCES district)
- District
- Santa Anna ISD
- NCES district ID
- 4839210
- Math proficiency
- 50% ▲ 15.00%
- Reading proficiency
- 40% ▬ 0.00%
- Median HH income
- $36,211
- Composite
- 39.57/100
- National rank
- #8068
- State rank
- #582 of 1141 in TX
Livability — Santa Anna
- Score
- 69/100
- State rank
- #444
- US rank
- #9065
Category grades
Schools grade is shown separately in the Schools card above.
Census & demographics
- Census place
- Santa Anna, TX
- Population (ZIP)
- 1,797
Population outlook (Coleman County) Hauer SSP2
- Today (2025)
- 7,321 people
- By 2030
- 6,834 · -6.7%
- By 2040
- 5,968 · -18.5%
- By 2050
- 5,283 · -27.8%
- By 2075
- 4,205 · -42.6%
- By 2100
- 3,405 · -53.5%
Race, ethnicity, and origin ACS 2023
- Neighborhood character
- Predominantly White (74%)
- Race & ethnicity
- White 74% Hispanic / Latino 12% Black 10% Two or more races 5% Asian 2% Native American 1%
- Hispanic origin (detail)
- Mexican 11%
- Common ancestry
- Italian 16% Serbian 6% Slovak 4%
- Foreign-born
- 2% · Canada
- Languages at home
- 87% English-only · Spanish 12% Chinese 1%
Political lean MEDSL · Coleman
- 2024 margin
- Solid R (+79.0) · D 10.3% · R 89.3%
- 2008→2024 swing
- -15.1pp toward R · 2008: -64.0pp · 2024: -79.0pp
- All cycles
- 2024: R+79.0 2020: R+77.3 2016: R+76.8 2012: R+73.7 2008: R+64.0
Not yet ingested
- Civics
- —
Market trends
- HPI YoY
- ▼ -0.43%
- Current HPI
- 100.1747
- Rent YoY
- —
- Metro
- —
- State GDP YoY
- ▲ 3.95%
- F500 in state
- 110
Industry mix (Fortune 500 HQ in TX)
| Industry | F500 HQs | Revenue |
|---|---|---|
| Energy | 16 | $1,198B |
|
||
| Technology | 5 | $198B |
|
||
| Engineering / Construction | 4 | $72B |
|
||
| Energy Services | 3 | $60B |
|
||
| Utilities | 3 | $41B |
|
||
| Healthcare | 2 | $330B |
|
||
Price history
+189.5% since first listed25 events — show timeline
- 2026-05-14 Relisted — NTREIS
- 2026-03-23 Pending — NTREIS
- 2026-03-18 Contingent — NTREIS
- 2026-01-22 Listed $55,000 NTREIS
- 2019-03-11 Sold (Public Records) — Public Records
- 2019-03-08 Sold (MLS) — NTREIS
- 2019-02-17 Pending — NTREIS
- 2018-12-13 Price Changed $19,900 NTREIS
- 2018-09-25 Listed $22,000 NTREIS
- 2018-05-15 Listing Removed — NTREIS
- 2017-11-20 Listed $22,000 NTREIS
- 2017-11-17 Listing Removed — NTREIS
- 2017-09-14 Price Changed $23,000 NTREIS
- 2017-09-05 Price Changed $24,000 NTREIS
- 2017-08-18 Price Changed $25,000 NTREIS
- 2017-07-22 Listed $26,000 NTREIS
- 2013-09-16 Sold (Public Records) $27,855 Public Records
- 2012-10-04 Sold (Public Records) — Public Records
- 2012-09-25 Sold (MLS) — NTREIS
- 2012-09-20 Listing Removed — NTREIS
- 2012-08-17 Listing Removed — NTREIS
- 2012-05-17 Listed $9,700 NTREIS
- 2012-05-17 Listed $19,000 NTREIS
- 2012-02-07 Sold (Public Records) — Public Records
- 2005-01-07 Sold (Public Records) — Public Records
Property tax history
+7.7%/yrLatest (2025): $1,108 · -11.7% YoY. Source: county tax records.
Cash-flow waterfall
monthlySold comps — $/sqft
last 12 mo · ≤1 miLoading sold comps…