 Duplex
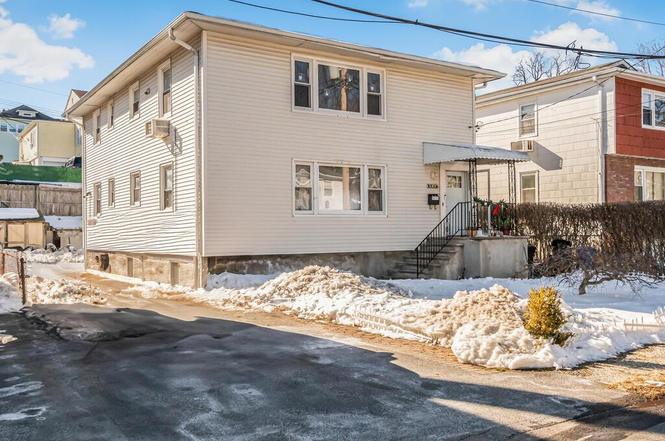
64 Ashland St · New Rochelle, NY
Flood risk 10/10 · Severe
- FEMA flood zone
- X (unshaded)
- Chance of flooding over 30 yrs
- 0.99%
- Est. flood insurance / yr
- $507 – $1,088
Fire risk 1/10 · Minimal
- Est. fire insurance / yr
- $691 – $1,283
Heat risk 6/10 · Moderate
- Hot days now (above 98°F)
- 7 days/yr
- Hot days in 30 yrs
- 16 days/yr
Wind risk 6/10 · Moderate
- Chance of severe wind over 30 yrs
- 27.0%
Air-quality risk 5/10 · Moderate
- Unhealthy air days now
- 6 days/yr
- Unhealthy air days in 30 yrs
- 8 days/yr
Risk factors via First Street. Map © Google.
Why this score? — see what drove the C- grade
The composite is a weighted blend of 9 inputs, each scored 0–100. Each bar is that input's sub-score; the figure is the points it added to the 100-point composite (weight × sub-score).
- ARV discount +14.6/15.0
- Cash flow +13.6/30.0
- Schools +5.7/10.0
- 1% rule +4.3/10.0
- DSCR +4.1/10.0
- Livability +3.5/5.0
- Rent growth +2.9/5.0
- Condition / age +2.5/5.0
- Appreciation +0.0/10.0
$799,999
🖨 Deal sheet 📄 Offer letter ✓ Due diligence
Multi-family units
County records classify this as Multi-Family (2-4 Unit). Listing-text estimate: 2 units. confirmed
Listing remarks
Beautiful fully detached legal 2-family home located in the highly sought-after New Rochelle neighborhood. This well-maintained property sits on a large 50x100 lot and features a spacious 3-bedroom, 1-bath apartment over another 3-bedroom, 1-bath apartment, making it perfect for investors or owner-occupants. The home also includes a full basement with an additional bathroom, offering great potential for additional space or storage. A private driveway provides parking for 3–4 vehicles, adding to the home's convenience and value. A fantastic opportunity in a prime location close to transportation, shopping, shopping, and local amenities.
Key facts
- 4,792 sq ft lot
- 4 parking spots
- Built 1967
Neighborhood map
What this means for you Summary
Snapshot
- This is a 2 × 3-bed/1.0-bath units multifamily listed at $800k.
Deal economics
- At list price, monthly cash flow is $-28 ($-339/yr) — negative. Per door: $-14/mo.
- To cash-flow at today's rent, offer at most $795k (0.6% below list).
- To meet the 1% rule (rent ≥ 1% of price), the offer needs to be $742k (7.2% below list).
- Recommended offer: $742k (7.2% below list) — sets the bar for 1% rule.
- Cap rate 6.4% vs local median 4.5% in New Rochelle — top-decile yield for the area; either an underpriced asset or a hidden risk that comps aren't pricing in. Stress-test before assuming the spread holds.
Location & tenants
- Location reads 69/100 on livability (#487 in NY) — a middle-class / working-renter tenant base. Strengths: employment A+, crime A, amenities B+; Watch: housing D+, commute F, cost of living F.
- New Rochelle City School District (suburban): math 63% / reading 66% proficiency, ranked #171 of 590 in NY (top 29%) — acceptable for families but not a draw, mixed tenant base, ~2y average lease.
- Market conditions: Rents rising (+1.4%/yr); 138 active listings in the ZIP; 1 comparable units currently listed for rent nearby; solid renter incomes; 954 units permitted in Westchester County in 2024 (649 in 5+ unit buildings).
- At $7,424/mo this rent would consume 104% of the median local household income ($86k/yr) (locally 2797% of renters already pay >50% of income on rent) — very limited rent-growth headroom before tenants either downsize or default.
Forward outlook
- Local home prices are declining (-3.0%/yr); year-one equity from $6k of loan paydown is wiped out by about $24k of value loss. Plan a longer hold.
- Westchester County population projected at +10% by 2050 — modest demand growth; plan on rents tracking national, not racing it.
Negotiation context
- Only 14 days on market — expect competitive offers; lowballing is unlikely to land.
- 4 sale attempts since 17y ago with the ask held roughly flat each time — persistent listings suggest the price (not the market) is what's stuck; bring a comps-based counter.
Risks & watch-outs
- Watch-outs: flood insurance adds $66/mo.
- Climate carrying-cost: severe flood risk; major wind risk, 27% chance of damaging wind over 30y; extreme-heat days projected 7→16/yr by 2055 (HVAC capex compounding) — expect insurance premiums to compound above CPI over the hold.
Questions for the listing agent
- What do current leases actually rent for vs. the listed asking? Can we see a recent rent roll and the last 12 months of T-12 income?
- Can we see the unit-by-unit rent roll, current vacancy, and any below-market leases? What's the average tenancy length?
- What capital expenditures (roof, boiler, parking lot, exteriors) have been made in the last 5 years, and what's planned in the next 2?
- Built in 1967 — when were the roof, HVAC, electrical panel, plumbing, and water heater last replaced?
- What's the actual annual flood-insurance premium (NFIP or private), and is the property in a SFHA with mandatory coverage?
- Is there a deadline driving the sale (1031 exchange, divorce, estate, relocation)? That informs how much negotiation room exists.
- What's the average days-on-market for RENTAL listings here right now (not sales)? A rising rental-DOM trend means longer vacancies and softer asking-rent achievability than the comps imply.
- What's the recent tenant-quality profile in this submarket — average credit score on applications, eviction rate, late-payment / NSF rate, and stable-employment percentage? A property-management company in the area should have these aggregated.
- How much new apartment / multifamily construction is in the pipeline within 1–3 miles? Heavy new supply (>2% of stock underway) typically softens rents 12–24 months out; light construction supports rent growth.
Investment metrics
- 1% rule
- 0.93% ✗
- Cap rate
- 6.35%
- Cash-on-cash
- 0.20%
- DSCR
- 1.01
- GRM
- 9.0
CMA / ARV
- ARV (on-the-fly)
- $950,208
- Comps found
- 5
Show comp detail 5 sales within ~0.75 mi
| Address | Dist | Beds/Ba | Sqft | Sold | Price | $/sf | Match |
|---|---|---|---|---|---|---|---|
| 57 Ashland St | 0.04mi | 6/4.0 | 2,600 (+10%) | 9mo | $1,050,000 | $404 | 65 |
| 61 Halcyon Ter | 0.42mi | 5/2.0 (-1) | 2,228 (-5%) | 17mo | $700,000 | $314 | 53 |
| 45 Ashland St | 0.05mi | 5/2.0 (-1) | 2,700 (+15%) | 22mo | $940,000 | $348 | 50 |
| 161 Stephenson Blvd | 0.70mi | 6/4.0 | 2,256 (-4%) | 6mo | $955,000 | $423 | 48 |
| 20 Treno St | 0.74mi | 6/3.0 | 2,000 (-15%) | 6mo | $965,000 | $483 | 32 |
Match score weights: distance 35% · size 25% · config 20% · recency 20%. Top-matched comps best support the ARV.
Projected returns pro-forma
-3.0% appreciation · 1.42% rent growth · sell at horizon
- IRR
- -18.4%
- Equity multiple
- 0.36×
- Total profit
- $-142,718
- Equity at exit
- $119,282
- IRR
- -14.4%
- Equity multiple
- 0.23×
- Total profit
- $-171,418
- Equity at exit
- $69,169
Cash invested: $224,000 (down + closing). Projections, not guarantees.
Landlord ↔ Tenant lean methodology
- Overall (STATE)
- 15 Strongly Tenant-Friendly
- State New York
- 15 Strongly Tenant-Friendly · D+10
- County
- — inherits STATE
- City
- — inherits STATE
ZIP-level market 10801
- Rents YoY
- 1.4%
- Active inventory
- 138
- Price-to-rent
- 18.0×
Monthly cashflow live
- Estimated rent
- $7,424 high interval (Pro) →
- Mortgage (P&I)
- −$4,195
- Tax from tax record
- −$1,298 /mo · $15,578/yr
- Insurance
- −$333
- Flood insurance flood zone
- −$66 /mo · $798/yr
- HOA
- −$0
- Vacancy / Maint / Mgmt
- −$1,559
- Net cashflow
- $-28
Break-even live
2-unit breakdown (identical units grouped — click to expand)
| Units | Beds | Baths | Est. rent |
|---|---|---|---|
| 2× units | 3 | 1 | $7,424 |
| #1 | 3 | 1 | $3,712 |
| #2 | 3 | 1 | $3,712 |
| Total (2 units) | $7,424 | ||
UW: 25.0% down · 7.5% · 30yr · 1.5% tax · 5.0% vac · 8.0% maint · 8.0% mgmt
Financing live
Cash to close
- Down payment
- $200,000
- Closing costs
- $24,000
- Reserves months
- —
- Total cash needed
- —
Loan-product check · same deal, 3 products live
Conventional
25% down · 7.5% · 30yr
- Down + closing
- —
- Monthly P&I
- —
- Monthly cashflow
- —
- DSCR
- —
- Eligible?
- —
Personal DTI + credit; lowest rate.
DSCR
20% down · 8.5% · 30yr
- Down + closing
- —
- Monthly P&I
- —
- Monthly cashflow
- —
- DSCR
- —
- Eligible?
- —
No personal income docs; deal must DSCR.
Hard money
10% down · 12.0% · 12mo
- Down + closing
- —
- Monthly P&I
- —
- Monthly cashflow
- —
- DSCR
- —
- Eligible?
- —
Short-term bridge; refi at stabilization.
Rent comps 1 comps
| Address | Beds | Baths | Sqft | Rent | $/sqft | DOM | Units | Dist |
|---|---|---|---|---|---|---|---|---|
| 72 Chauncey Ave New Rochelle, NY | 5.0 | 1.0 | 2406 | $4,500 | $1.87 | 21d | 1 | 0.93mi |
Tax reassessment forecast NY · Partial reset (capped growth)
- Current annual tax
- $15,578 · $1,298/mo
- Projected year-2 tax
- $15,578 · $1,298/mo
- Expected delta
- $0/yr ($0/mo · 0.0%)
ⓘ Screening estimate from a state-policy table — verify with the county assessor before closing.
Climate risk First Street
- Flood 10/10 Extreme FEMA zone X (unshaded) · 99% chance over 30 yrs
- Wildfire 1/10 Low
- Heat 6/10 Major 7 d/yr ≥98°F today · 16 d/yr by 30 yrs out
- Wind 6/10 Major 27% chance of damaging wind over 30 yrs
- Air quality 5/10 Major 6 unhealthy d/yr today · 8 by 30 yrs out
Nearby sold comps map
Loading sold comps map…
Walkable amenities ~0.75 mi
Loading nearby amenities…
Taxation est. · year 1
- Rental income
- $89,088
- − Mortgage interest
- −$44,812
- − Property taxes
- −$15,578
- − Insurance
- −$4,797
- − Repairs & maintenance
- −$7,127
- − Management
- −$7,127
- − Depreciation
- −$23,273
- Taxable loss
- −$13,626
- Est. tax savings @ 24.0%
- +$3,270
- After-tax cash flow
- $2,931/yr
For passive investors: Depreciation is non-cash, so a rental often shows a tax loss while cash-flowing — sheltering income. Rental losses are passive: they offset passive income freely, and up to $25,000/yr can offset ordinary (W-2) income if you actively participate and your MAGI is under $100k (phasing out to $0 by $150k); unused losses carry forward. On sale, claimed depreciation is recaptured at up to 25%, and gains may owe capital-gains tax (a 1031 exchange can defer both). Figures are a year-1 estimate at your 24.0% rate — not tax advice; consult a CPA.
Schools (NCES district)
- District
- New Rochelle City School District
- NCES district ID
- 3620490
- Math proficiency
- 63% ▲ 3.00%
- Reading proficiency
- 66% ▲ 9.00%
- Median HH income
- $69,165
- Composite
- 56.63/100
- National rank
- #1139
- State rank
- #171 of 590 in NY
Livability — New Rochelle
- Score
- 69/100
- State rank
- #487
- US rank
- #8572
Category grades
Schools grade is shown separately in the Schools card above.
Census & demographics
- Census place
- New Rochelle, NY
- County
- Westchester County · 709,332 people
- City population
- 63,657
- Metro
- New York-Newark-Jersey City, NY-NJ-PA
- Population (ZIP)
- 42,754
- Household income
- $85,573
- Rent vs Own
- Severe rent burden
- 2797.0
Population outlook (Westchester County) Hauer SSP2
- Today (2025)
- 1,028,035 people
- By 2030
- 1,051,636 · +2.3%
- By 2040
- 1,098,520 · +6.9%
- By 2050
- 1,136,044 · +10.5%
- By 2075
- 1,196,925 · +16.4%
- By 2100
- 1,175,147 · +14.3%
Race, ethnicity, and origin ACS 2023
- Neighborhood character
- Highly diverse neighborhood (Simpson 0.72)
- Race & ethnicity
- Hispanic / Latino 36% White 30% Black 24% Two or more races 16% Asian 7%
- Hispanic origin (detail)
- Mexican 17% Puerto Rican 5% Dominican 3%
- Common ancestry
- Hispanic 3% Scotch-Irish 1% Romanian 1%
- Foreign-born
- 34% · Canada, Jamaica, China
- Languages at home
- 54% English-only · Spanish 32% Other Indo-European 5% French/Haitian/Cajun 4%
Political lean MEDSL · Westchester
- 2024 margin
- Strong D (+26.3) · D 63.1% · R 36.9%
- 2008→2024 swing
- -1.3pp toward R · 2008: 27.6pp · 2024: 26.3pp
- All cycles
- 2024: D+26.3 2020: D+36.3 2016: D+32.8 2012: D+22.2 2008: D+27.6
Not yet ingested
- Civics
- —
Market trends
- HPI YoY
- ▼ -910.37%
- Current HPI
- 270.8019
- Rent YoY
- ▲ 1.42%
- Metro
- New York-Newark-Jersey City, NY-NJ-PA
- State GDP YoY
- ▲ 2.60%
- F500 in state
- 92
Industry mix (Fortune 500 HQ in NY)
| Industry | F500 HQs | Revenue |
|---|---|---|
| Financial Services | 10 | $950B |
|
||
| Consumer Goods | 9 | $162B |
|
||
| Insurance | 4 | $225B |
|
||
| Telecommunications | 2 | $144B |
|
||
| Pharmaceuticals | 2 | $112B |
|
||
| Media / Entertainment | 2 | $69B |
|
||
Price history
+0.0% since first listed13 events — show timeline
- 2026-05-28 Pending — OneKey® MLS as Distributed by MLS Grid
- 2026-03-06 Listed $799,999 OneKey® MLS as Distributed by MLS Grid
- 2026-03-05 Coming Soon $799,999 OneKey® MLS as Distributed by MLS Grid
- 2011-12-29 Delisted — HGMLS
- 2011-09-19 Price Changed — HGMLS
- 2011-03-25 Listed — HGMLS
- 2010-11-28 Delisted — HGMLS
- 2010-09-14 Price Changed — HGMLS
- 2010-05-28 Listed — HGMLS
- 2010-04-16 Delisted — HGMLS
- 2009-12-17 Price Changed — HGMLS
- 2009-10-24 Price Changed — HGMLS
- 2009-10-22 Listed — HGMLS
Property tax history
-0.7%/yrLatest (2025): $15,578 · -20.7% YoY. Source: county tax records.
Cash-flow waterfall
monthlySold comps — $/sqft
last 12 mo · ≤1 miLoading sold comps…