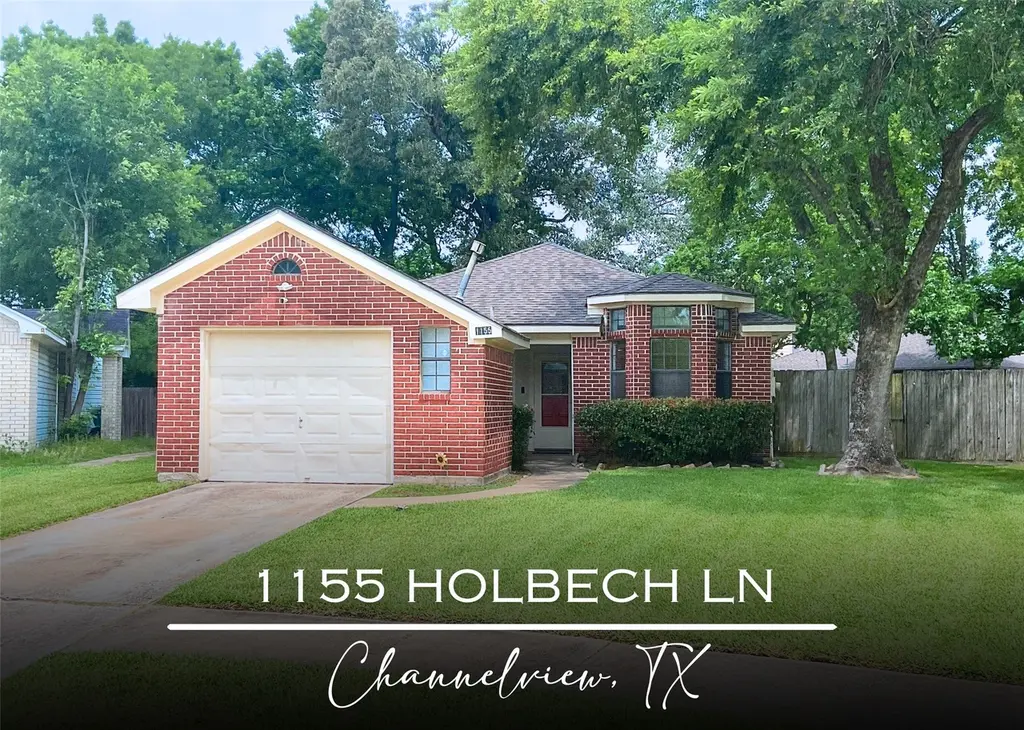
1155 Holbech Ln · Channelview, TX
Flood risk 1/10 · Minimal
- FEMA flood zone
- X (unshaded)
- Chance of flooding over 30 yrs
- 0.0%
- Est. flood insurance / yr
- $507 – $1,088
Fire risk 4/10 · Minor
- Est. fire insurance / yr
- $1,222 – $2,270
Heat risk 10/10 · Severe
- Hot days now (above 109°F)
- 7 days/yr
- Hot days in 30 yrs
- 25 days/yr
Wind risk 9/10 · Severe
- Chance of severe wind over 30 yrs
- 99.0%
Air-quality risk 2/10 · Minimal
- Unhealthy air days now
- 2 days/yr
- Unhealthy air days in 30 yrs
- 2 days/yr
Risk factors via First Street. Map © Google.
Why this score? — see what drove the D- grade
The composite is a weighted blend of 9 inputs, each scored 0–100. Each bar is that input's sub-score; the figure is the points it added to the 100-point composite (weight × sub-score).
- Cash flow +12.1/30.0
- ARV discount +5.7/15.0
- Rent growth +5.0/5.0
- 1% rule +3.8/10.0
- DSCR +3.6/10.0
- Livability +3.3/5.0
- Schools +2.5/10.0
- Condition / age +2.5/5.0
- Appreciation +0.0/10.0
$207,000
🖨 Deal sheet (PDF) 📄 Offer letter ✓ Due diligence
Listing remarks
Step into this charming and beautifully maintained 3-bedroom, 2.5-bath home offering the perfect blend of comfort, functionality, and character. From the moment you arrive, you’ll fall in love with the adorable curb appeal and welcoming atmosphere. Inside, the home features an open-concept floor plan with soaring high ceilings and abundant natural light throughout. The spacious living area is centered around a cozy wood-burning fireplace, creating the perfect space for relaxing or entertaining. Fresh interior paint gives the home a bright, updated feel, while the adorable kitchen offers updated appliances, ample cabinet space, and everyday functionality. The shared bathroom includes a
Key facts
- 7,117 sq ft lot
- Garage
- Built 1994
Property features AI
Finance
- Other: Seller disclosure provided
- HOA & community: Sterling Green CIA homeowners association; Annual HOA fee of $270; Community features include curbs
Exterior
- Parking: Attached garage (1 car)
- Security: Smoke detector(s)
- Utilities: Public water; Public sewer
- Home design: Residential property; One-story entry (all main rooms on first floor); Built in 1994
- Construction: Brick and wood siding exterior; Composition roof; Slab foundation
- Exterior features: Fenced private yard; Back yard fencing; Concrete road access; Subdivision setting
Interior
- Kitchen: Dishwasher; Electric oven; Electric range; Free-standing range; Disposal; Pantry; Breakfast bar
- Bedrooms: Primary bedroom on the first floor (14x11); Bedroom on the first floor (12x12); Bedroom on the first floor (12x11)
- Flooring: Carpet; Laminate; Tile
- Bathrooms: 2 full bathrooms; 1 half bathroom
- Heating & cooling: Central heating (electric); Central air (electric)
- Interior features: Breakfast bar; High ceilings; Bath in primary bedroom; Pantry; Tub with shower; Vanity; Vaulted ceiling(s); Ceiling fan(s); Living/dining room; Programmable thermostat; Wood burning fireplace (1)
- Laundry & utility: Washer hookup; Electric dryer hookup
Neighborhood map
What this means for you Summary
Snapshot
- This is a 3-bed/2.5-bath single-family listed at $207k.
Deal economics
- At list price, monthly cash flow is $-46 ($-557/yr) — negative.
- To cash-flow at today's rent, offer at most $199k (4.0% below list).
- To meet the 1% rule (rent ≥ 1% of price), the offer needs to be $183k (11.5% below list).
- Recommended offer: $183k (11.5% below list) — sets the bar for 1% rule.
- Cap rate 6.0% vs local median 4.7% in Channelview — meaningfully above typical; check what's discounted (condition, days-on-market, listing class) to confirm the premium yield is real.
Location & tenants
- Location reads 66/100 on livability (#598 in TX) — a middle-class / working-renter tenant base. Strengths: cost of living A+, housing A+; Watch: crime F, amenities F, commute F.
- Channelview ISD (suburban): math 27% / reading 30% proficiency, ranked #640 of 826 in TX (top 78%) — low school quality limits family demand, transient renter base, plan for 1-2y turnover; 70% free/reduced lunch — lower-income household profile, screen leases tightly.
- Zoned schools: B H Hamblen El (math 30% / reading 32%, grade F, #2,429 of 4,322 statewide, top 57%, 954 students, 83% FRL); Aguirre J H (math 24% / reading 28%, grade F, #1,222 of 1,662 statewide, top 74%, 975 students, 76% FRL); Channelview H S (math 24% / reading 35%, grade F, #1,112 of 1,632 statewide, top 70%, 2,893 students, 87% FRL).
- Market conditions: Rents rising fast (+16.9%/yr); 100 active listings in the ZIP; 11 comparable units currently listed for rent nearby; rentals leasing fast (median 4d on market — plan ~1-2 weeks tenant-placement turnaround); 29,883 units permitted in Harris County in 2024 (8,621 in 5+ unit buildings).
- This rent runs 35% of the median local income ($62k/yr) — at the standard rent-burdened threshold; future hikes will face affordability resistance.
Forward outlook
- Local home prices are declining (-3.0%/yr); year-one equity from $1k of loan paydown is wiped out by about $6k of value loss. Plan a longer hold.
- Harris County population projected at +47% by 2050 — long-run rental-demand tailwind backs the buy-and-hold thesis.
Negotiation context
- It's been on market 15 days — a 2% lower offer ($204k) is reasonable based on typical stale-listing flexibility.
- 7 sale attempts since 21y ago; this cycle's ask is 184% above the opening price — seller raised mid-cycle; expect resistance to lowballs.
- Current owner paid $54k; list at $207k implies a 280% gain — meaningful room to come down on a strong offer.
Risks & watch-outs
- Climate carrying-cost: severe wind risk, 99% chance of damaging wind over 30y; extreme-heat days projected 7→25/yr by 2055 (HVAC capex compounding) — expect insurance premiums to compound above CPI over the hold.
Questions for the listing agent
- What do current leases actually rent for vs. the listed asking? Can we see a recent rent roll and the last 12 months of T-12 income?
- What does the HOA fee cover, when was the last increase, and are there any pending special assessments or reserve-fund shortfalls?
- Is there a deadline driving the sale (1031 exchange, divorce, estate, relocation)? That informs how much negotiation room exists.
- Schools are D-rated, which usually means shorter tenancies and higher turnover. Who's the typical renter profile here, and what's been the actual vacancy rate?
- Crime grade is F in this area — have there been break-ins, vandalism, or insurance claims at this property in the last 3 years? What carrier currently insures it and at what premium?
- The area grade is low — what's the realistic commute time and amenity access for the typical tenant pool here? Any planned neighborhood developments (good or bad) we should know about?
- What's the average days-on-market for RENTAL listings here right now (not sales)? A rising rental-DOM trend means longer vacancies and softer asking-rent achievability than the comps imply.
- What's the recent tenant-quality profile in this submarket — average credit score on applications, eviction rate, late-payment / NSF rate, and stable-employment percentage? A property-management company in the area should have these aggregated.
- How much new for-sale + rental construction is in the pipeline within 1–3 miles? Heavy new supply typically softens prices + rents 12–24 months out; constrained supply supports both.
Investment metrics
- 1% rule
- 0.88% ✗
- Cap rate
- 6.02%
- Cash-on-cash
- -0.96%
- DSCR
- 0.96
- GRM
- 9.4
CMA / ARV
- ARV (on-the-fly)
- $198,900
- Comps found
- 12
Show comp detail 12 sales within ~0.75 mi
| Address | Dist | Beds/Ba | Sqft | Sold | Price | $/sf | Match |
|---|---|---|---|---|---|---|---|
| 1034 Little Prt | 0.18mi | 3/2.0 | 1,319 (-0%) | 4mo | $204,990 | $155 | 86 |
| 1054 Somercotes Ln | 0.20mi | 3/2.5 | 1,410 (+6%) | 3mo | $229,950 | $163 | 77 |
| 1327 Padstow Ln | 0.22mi | 3/2.0 | 1,417 (+7%) | 1mo | $229,000 | $162 | 75 |
| 15302 Bedford Glen Dr | 0.69mi | 3/2.5 | 1,370 (+3%) | 2mo | $165,000 | $120 | 61 |
| 15242 Peachmeadow Ln | 0.71mi | 2/2.0 (-1) | 1,326 (0%) | 3mo | $140,000 | $106 | 58 |
| 15110 Peachmeadow Ln | 0.58mi | 3/2.0 | 1,417 (+7%) | 3mo | $249,900 | $176 | 57 |
| 1502 Stevenage Ln | 0.58mi | 4/3.0 (+1) | 1,270 (-4%) | 3mo | $185,000 | $146 | 57 |
| 726 Brookview St | 0.71mi | 3/1.5 | 1,369 (+3%) | 3mo | $190,000 | $139 | 55 |
| 1322 Great Dover Cir | 0.44mi | 4/3.0 (+1) | 1,464 (+10%) | 3mo | $200,000 | $137 | 53 |
| 1118 Chestnut Bough St | 0.50mi | 3/2.0 | 1,499 (+13%) | 1mo | $225,000 | $150 | 52 |
| 714 Donfield St | 0.70mi | 3/2.0 | 1,154 (-13%) | 2mo | $139,990 | $121 | 42 |
| 730 Doncrest St | 0.65mi | 4/2.0 (+1) | 1,503 (+13%) | 4mo | $230,000 | $153 | 37 |
Match score weights: distance 35% · size 25% · config 20% · recency 20%. Top-matched comps best support the ARV.
Projected returns pro-forma
-3.0% appreciation · 8.0% rent growth · sell at horizon
- IRR
- -12.2%
- Equity multiple
- 0.54×
- Total profit
- $-26,753
- Equity at exit
- $30,864
- IRR
- 3.3%
- Equity multiple
- 1.30×
- Total profit
- $17,221
- Equity at exit
- $17,898
Cash invested: $57,960 (down + closing). Projections, not guarantees.
Landlord ↔ Tenant lean methodology
- Overall (STATE)
- 87 Strongly Landlord-Friendly
- State Texas
- 87 Strongly Landlord-Friendly · R+5
- County
- — inherits STATE
- City
- — inherits STATE
ZIP-level market 77530
- Rents YoY
- 16.9%
- Active inventory
- 100
- Price-to-rent
- 9.4×
Monthly cashflow live
- Estimated rent
- $1,832 high interval (Pro) →
- Mortgage (P&I)
- −$1,086
- Tax from tax record
- −$299 /mo · $3,582/yr
- Insurance
- −$86
- HOA
- −$23
- Vacancy / Maint / Mgmt
- −$385
- Net cashflow
- $-46
Break-even live
Sensitivity live
| Price | -10% $71 | -5% $12 | +0% $-46 | +5% $-105 | +10% $-164 |
|---|---|---|---|---|---|
| Rent | -10% $-191 | -5% $-119 | +0% $-46 | +5% $26 | +10% $98 |
| Rate | -1.0pp $58 | -0.5pp $6 | base $-46 | +0.5pp $-100 | +1.0pp $-155 |
UW: 25.0% down · 7.5% · 30yr · 1.5% tax · 5.0% vac · 8.0% maint · 8.0% mgmt
Financing live
Cash to close
- Down payment
- $51,750
- Closing costs
- $6,210
- Reserves months
- —
- Total cash needed
- —
Loan-product check · same deal, 3 products live
Conventional
25% down · 7.5% · 30yr
- Down + closing
- —
- Monthly P&I
- —
- Monthly cashflow
- —
- DSCR
- —
- Eligible?
- —
Personal DTI + credit; lowest rate.
DSCR
20% down · 8.5% · 30yr
- Down + closing
- —
- Monthly P&I
- —
- Monthly cashflow
- —
- DSCR
- —
- Eligible?
- —
No personal income docs; deal must DSCR.
Hard money
10% down · 12.0% · 12mo
- Down + closing
- —
- Monthly P&I
- —
- Monthly cashflow
- —
- DSCR
- —
- Eligible?
- —
Short-term bridge; refi at stabilization.
Rent comps 11 comps
| Address | Beds | Baths | Sqft | Rent | $/sqft | DOM | Units | Dist |
|---|---|---|---|---|---|---|---|---|
| 1335 Willersley Ln Channelview, TX | 3.0 | 2.0 | 1669 | $1,775 | $1.06 | 4d | 1 | 0.29mi |
| 947 Leadenhall Cir Channelview, TX | 3.0 | 2.5 | 1620 | $1,806 | $1.11 | 0d | 1 | 0.37mi |
| 15255 Ferness Ln Channelview, TX | 4.0 | 2.0 | 1326 | $1,668 | $1.26 | 4d | 10 | 0.41mi |
| 1391 Tenderden Dr Channelview, TX | 3.0 | 2.0 | 1464 | $1,699 | $1.16 | 0d | 1 | 0.42mi |
| 1379 Dell Dale St Channelview, TX | 4.0 | 2.0 | 1444 | $1,893 | $1.31 | 6d | 1 | 0.62mi |
| 810 Townley St Channelview, TX | 3.0 | 3.5 | 1713 | $1,925 | $1.12 | 45d | 1 | 0.66mi |
| 14831 Waterside Dr Houston, TX | 3.0 | 2.0 | 1638 | $1,779 | $1.09 | 4d | 1 | 0.91mi |
| 6160 E Sam Houston Pkwy N Unit 425 Houston, TX | 2.0 | 2.0 | 1033 | $1,600 | $1.55 | 0d | 1 | 1.44mi |
| 6160 E Sam Houston Pkwy N Unit 424 Houston, TX | 2.0 | 2.0 | 1033 | $1,616 | $1.56 | 6d | 1 | 1.44mi |
| 6160 E Sam Houston Pkwy N Unit 6197 Houston, TX | 2.0 | 2.0 | 1033 | $1,640 | $1.59 | 11d | 1 | 1.44mi |
| 6160 E Sam Houston Pkwy N Unit 6217 Houston, TX | 2.0 | 2.0 | 923 | $1,294 | $1.40 | 14d | 1 | 1.44mi |
HOA detail
- Monthly dues
- $23 · $276/yr
Listing history 28 events
-
2026-06-07days on market $207,000 Pending 15 DOM
-
2026-06-04days on market $207,000 Pending 13 DOM
-
2026-06-03days on market $207,000 Pending 12 DOM
-
2026-06-02days on market $207,000 Pending 11 DOM
-
2026-06-01days on market $207,000 Pending 10 DOM
-
2026-06-01status $207,000 Pending 9 DOM
-
2026-05-31days on market $207,000 Active 9 DOM
-
2026-05-22status Active
-
2026-05-22price $207,000
-
2015-07-02historical
-
2015-02-04status Pending
-
2014-09-02status Active
-
2014-05-19status Pending
-
2014-05-06status Option Pending
-
2014-01-23status Active
-
2014-01-10status Pending
-
2013-11-06$73,000 Active
-
2013-10-31historical
-
2013-07-30price $73,000
-
2013-07-29status Active
-
2013-06-14status Pending
-
2013-04-05status Pending, Continue to Show
-
2013-03-21status Option Pending
-
2012-04-17$59,900 Active
-
2005-04-11historical
-
2005-03-22$129,900
-
1999-10-21soldstatus
-
1996-09-26soldstatus $54,475
ⓘ Source: listings_history table (triggers on properties + properties_extension) + one-shot
backfill from property_details.listing_events for pre-trigger history.
Tax reassessment forecast TX · Resets to sale price
- Current annual tax
- $3,582 · $299/mo
- Projected year-2 tax
- $3,788 · $316/mo
- Expected delta
- +$206/yr (+$17/mo · 5.8%)
ⓘ Screening estimate from a state-policy table — verify with the county assessor before closing.
Climate risk First Street
- Flood 1/10 Low FEMA zone X (unshaded) · 0% chance over 30 yrs
- Wildfire 4/10 Moderate
- Heat 10/10 Extreme 7 d/yr ≥109°F today · 25 d/yr by 30 yrs out
- Wind 9/10 Extreme 99% chance of damaging wind over 30 yrs
- Air quality 2/10 Low 2 unhealthy d/yr today · 2 by 30 yrs out
Nearby sold comps map
Loading sold comps map…
Walkable amenities ~0.75 mi
Loading nearby amenities…
Taxation est. · year 1
- Rental income
- $21,978
- − Mortgage interest
- −$11,595
- − Property taxes
- −$3,582
- − Insurance
- −$1,035
- − Repairs & maintenance
- −$1,758
- − Management
- −$1,758
- − HOA
- −$276
- − Depreciation
- −$6,022
- Taxable loss
- −$4,049
- Est. tax savings @ 24.0%
- +$972
- After-tax cash flow
- $415/yr
For passive investors: Depreciation is non-cash, so a rental often shows a tax loss while cash-flowing — sheltering income. Rental losses are passive: they offset passive income freely, and up to $25,000/yr can offset ordinary (W-2) income if you actively participate and your MAGI is under $100k (phasing out to $0 by $150k); unused losses carry forward. On sale, claimed depreciation is recaptured at up to 25%, and gains may owe capital-gains tax (a 1031 exchange can defer both). Figures are a year-1 estimate at your 24.0% rate — not tax advice; consult a CPA.
Schools (NCES district)
- District
- Channelview ISD
- NCES district ID
- 4813590
- Math proficiency
- 27% ▼ -22.00%
- Reading proficiency
- 30% ▼ -8.00%
- Median HH income
- $52,320
- Composite
- 25.18/100
- National rank
- #7513
- State rank
- #640 of 826 in TX
Livability — Channelview
- Score
- 66/100
- State rank
- #598
- US rank
- #11392
Category grades
Schools grade is shown separately in the Schools card above.
Census & demographics
- Census place
- Channelview, TX
- County
- Harris County · 4,702,590 people
- City population
- 31,527
- Metro
- Houston-The Woodlands-Sugar Land, TX
- Population (ZIP)
- 31,527
- Household income
- $62,195
- Rent vs Own
- Severe rent burden
- 966.0
Population outlook (Harris County) Hauer SSP2
- Today (2025)
- 5,571,493 people
- By 2030
- 6,089,821 · +9.3%
- By 2040
- 7,142,806 · +28.2%
- By 2050
- 8,185,864 · +46.9%
- By 2075
- 10,574,329 · +89.8%
- By 2100
- 12,109,958 · +117.4%
Race, ethnicity, and origin ACS 2023
- Neighborhood character
- Predominantly Hispanic (71%)
- Race & ethnicity
- Hispanic / Latino 71% Two or more races 31% White 16% Black 9% Asian 4% Native American 1%
- Hispanic origin (detail)
- Mexican 61%
- Common ancestry
- Slovak 1% Lithuanian 1%
- Foreign-born
- 33% · Canada, Vietnam, Jamaica
- Languages at home
- 37% English-only · Spanish 60% Other Asian/Pacific 1% Vietnamese 1%
Political lean MEDSL · Harris
- 2024 margin
- Lean D (+5.5) · D 52.0% · R 46.4% · Other 1.6%
- 2008→2024 swing
- +3.9pp toward D · 2008: 1.6pp · 2024: 5.5pp
- All cycles
- 2024: D+5.5 2020: D+13.3 2016: D+12.4 2012: D+0.1 2008: D+1.6
Not yet ingested
- Civics
- —
Market trends
- HPI YoY
- ▼ -172.05%
- Current HPI
- 292.1862
- Rent YoY
- ▲ 16.85%
- Metro
- Houston-The Woodlands-Sugar Land, TX
- State GDP YoY
- ▲ 3.95%
- F500 in state
- 110
Industry mix (Fortune 500 HQ in TX)
| Industry | F500 HQs | Revenue |
|---|---|---|
| Energy | 16 | $1,198B |
|
||
| Technology | 5 | $198B |
|
||
| Engineering / Construction | 4 | $72B |
|
||
| Energy Services | 3 | $60B |
|
||
| Utilities | 3 | $41B |
|
||
| Healthcare | 2 | $330B |
|
||
Price history
+280.0% since first listed21 events — show timeline
- 2026-05-22 Relisted — HARMLS
- 2026-05-22 Price Changed $207,000 HARMLS
- 2015-07-02 Listing Removed — HARMLS
- 2015-02-04 Pending — HARMLS
- 2014-09-02 Relisted — HARMLS
- 2014-05-19 Pending — HARMLS
- 2014-05-06 Pending — HARMLS
- 2014-01-23 Relisted — HARMLS
- 2014-01-10 Pending — HARMLS
- 2013-11-06 Listed $73,000 HARMLS
- 2013-10-31 Listing Removed — HARMLS
- 2013-07-30 Price Changed $73,000 HARMLS
- 2013-07-29 Relisted — HARMLS
- 2013-06-14 Pending — HARMLS
- 2013-04-05 Pending — HARMLS
- 2013-03-21 Pending — HARMLS
- 2012-04-17 Listed $59,900 HARMLS
- 2005-04-11 Listing Removed — HARMLS
- 2005-03-22 Listed $129,900 HARMLS
- 1999-10-21 Sold (Public Records) — Public Records
- 1996-09-26 Sold (Public Records) $54,475 Public Records
Property tax history
+2.4%/yrLatest (2025): $3,582 · +9.5% YoY. Source: county tax records.
Cash-flow waterfall
monthlySold comps — $/sqft
last 12 mo · ≤1 miLoading sold comps…