 Multi-family
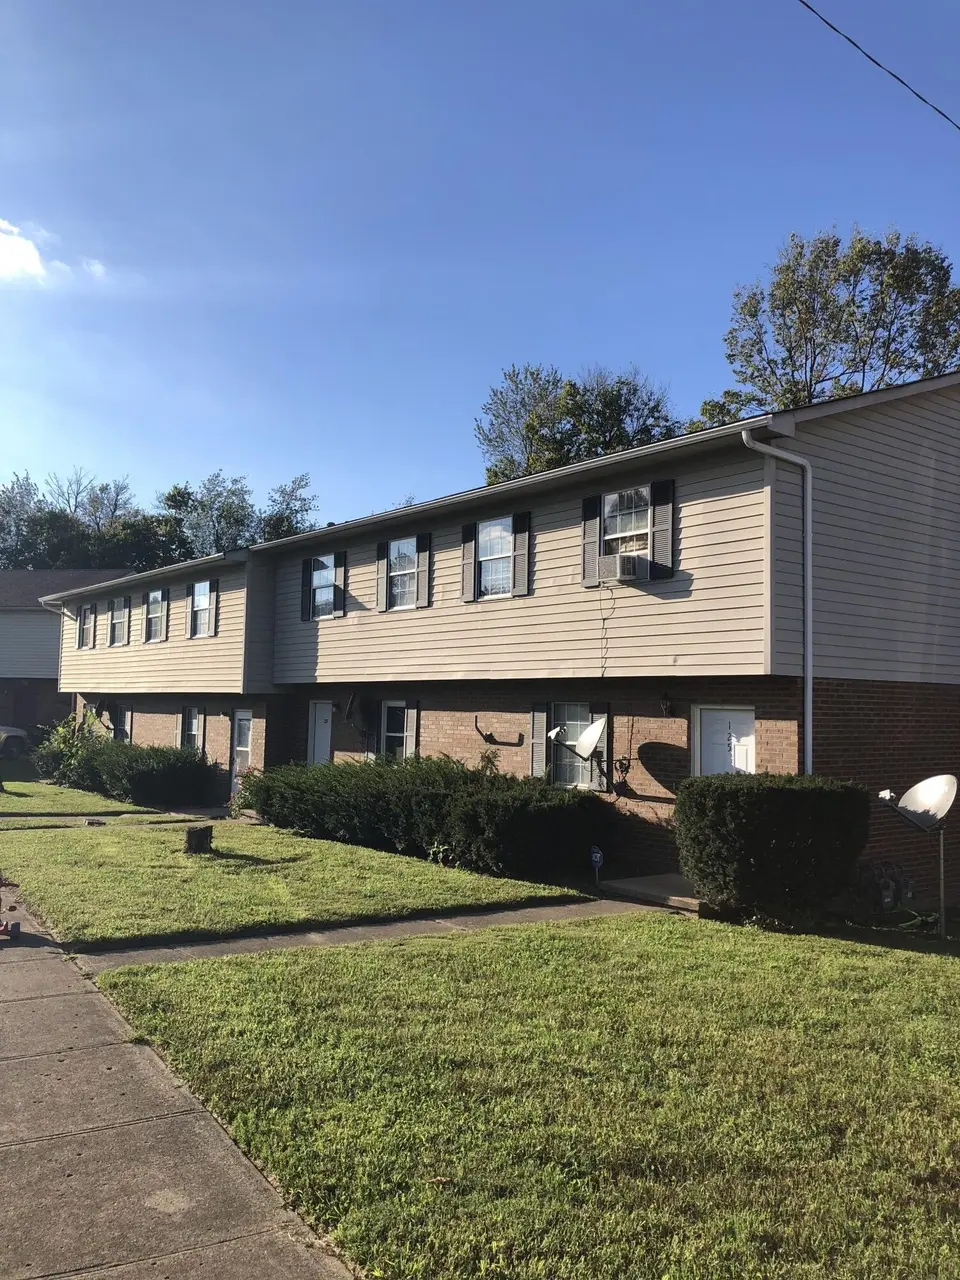
125-131 Bradford Dr · Paris, KY
Flood risk 7/10 · Major
- FEMA flood zone
- X (unshaded)
- Chance of flooding over 30 yrs
- 0.99%
- Est. flood insurance / yr
- $507 – $1,088
Fire risk 3/10 · Minor
- Est. fire insurance / yr
- $839 – $1,559
Heat risk 4/10 · Minor
- Hot days now (above 102°F)
- 7 days/yr
- Hot days in 30 yrs
- 19 days/yr
Wind risk 2/10 · Minimal
- Chance of severe wind over 30 yrs
- 2.0%
Air-quality risk 2/10 · Minimal
- Unhealthy air days now
- 1 days/yr
- Unhealthy air days in 30 yrs
- 1 days/yr
Risk factors via First Street. Map © Google.
Why this score? — see what drove the D grade
The composite is a weighted blend of 9 inputs, each scored 0–100. Each bar is that input's sub-score; the figure is the points it added to the 100-point composite (weight × sub-score).
- Cash flow +16.1/30.0
- ARV discount +7.5/15.0
- DSCR +5.0/10.0
- 1% rule +4.4/10.0
- Livability +3.4/5.0
- Condition / age +2.8/5.0
- Rent growth +2.5/5.0
- Schools +2.5/10.0
- Appreciation +0.0/10.0
$450,000
🖨 Deal sheet (PDF) 📄 Offer letter ✓ Due diligence
Multi-family units
County records classify this as Multi-Family (2-4 Unit). Listing-text estimate: 1 unit. estimate disagrees with records
Key facts
- 0.34 acre lot
- Listed 4 days
Neighborhood map
What this means for you Summary
Snapshot
- This is a 12-bed/6.0-bath multifamily listed at $450k. Condition is rated average.
Deal economics
- At list price, monthly cash flow is $164 ($2k/yr) — positive.
- The deal already cash-flows at list — no discount required.
- To meet the 1% rule (rent ≥ 1% of price), the offer needs to be $423k (6.0% below list).
- Recommended offer: $423k (6.0% below list) — sets the bar for 1% rule.
- Cap rate 6.9% vs local median 3.0% in Paris — top-decile yield for the area; either an underpriced asset or a hidden risk that comps aren't pricing in. Stress-test before assuming the spread holds.
Location & tenants
- Location reads 67/100 on livability (#218 in KY) — a middle-class / working-renter tenant base. Strengths: crime A+, cost of living A+, housing A+; Watch: amenities F, commute F, employment F.
- Bourbon County (town): math 26% / reading 32% proficiency, ranked #108 of 165 in KY (top 66%) — low school quality limits family demand, transient renter base, plan for 1-2y turnover.
- Zoned schools: Bourbon Central Elementary School (math 32% / reading 27%, grade F, #393 of 676 statewide, top 63%, 483 students, 70% FRL); Bourbon County Middle School (math 25% / reading 38%, grade F, #125 of 217 statewide, top 63%, 593 students, 63% FRL); Bourbon County High School (math 27% / reading 32%, grade F, #127 of 254 statewide, top 58%, 790 students, 53% FRL).
- Market conditions: 128 active listings in the ZIP; 90 units permitted in Bourbon County in 2024 (0 in 5+ unit buildings).
- At $4,228/mo this rent would consume 80% of the median local household income ($63k/yr) (locally 509% of renters already pay >50% of income on rent) — very limited rent-growth headroom before tenants either downsize or default.
Forward outlook
- Local home prices are declining (-3.0%/yr); year-one equity from $3k of loan paydown is wiped out by about $14k of value loss. Plan a longer hold.
Negotiation context
- Only 4 days on market — expect competitive offers; lowballing is unlikely to land.
Risks & watch-outs
- Watch-outs: flood insurance adds $66/mo.
- Climate carrying-cost: major flood risk — expect insurance premiums to compound above CPI over the hold.
Questions for the listing agent
- What's the actual annual flood-insurance premium (NFIP or private), and is the property in a SFHA with mandatory coverage?
- Is there a deadline driving the sale (1031 exchange, divorce, estate, relocation)? That informs how much negotiation room exists.
- Schools are D-rated, which usually means shorter tenancies and higher turnover. Who's the typical renter profile here, and what's been the actual vacancy rate?
- The area grade is low — what's the realistic commute time and amenity access for the typical tenant pool here? Any planned neighborhood developments (good or bad) we should know about?
- What's the average days-on-market for RENTAL listings here right now (not sales)? A rising rental-DOM trend means longer vacancies and softer asking-rent achievability than the comps imply.
- What's the recent tenant-quality profile in this submarket — average credit score on applications, eviction rate, late-payment / NSF rate, and stable-employment percentage? A property-management company in the area should have these aggregated.
- How much new apartment / multifamily construction is in the pipeline within 1–3 miles? Heavy new supply (>2% of stock underway) typically softens rents 12–24 months out; light construction supports rent growth.
Investment metrics
- 1% rule
- 0.94% ✗
- Cap rate
- 6.91%
- Cash-on-cash
- 2.19%
- DSCR
- 1.10
- GRM
- 8.9
CMA / ARV
No comps found within radius.
Projected returns pro-forma
-3.0% appreciation · 3.0% rent growth · sell at horizon
- IRR
- -13.8%
- Equity multiple
- 0.50×
- Total profit
- $-62,381
- Equity at exit
- $67,096
- IRR
- -4.9%
- Equity multiple
- 0.68×
- Total profit
- $-40,461
- Equity at exit
- $38,908
Cash invested: $126,000 (down + closing). Projections, not guarantees.
Landlord ↔ Tenant lean methodology
- Overall (STATE)
- 83 Strongly Landlord-Friendly
- State Kentucky
- 83 Strongly Landlord-Friendly · R+16
- County
- — inherits STATE
- City
- — inherits STATE
ZIP-level market 40361
- Home prices YoY
- -23.1%
- Active inventory
- 128
- Price-to-rent
- 35.5×
Monthly cashflow live
- Estimated rent
- $4,228 high interval (Pro) →
- Mortgage (P&I)
- −$2,360
- Tax est. 1.5%
- −$562 /mo · $6,750/yr
- Insurance
- −$188
- Flood insurance flood zone
- −$66 /mo · $798/yr
- HOA
- −$0
- Vacancy / Maint / Mgmt
- −$888
- Net cashflow
- $164
Break-even live
Sensitivity live
| Price | -10% $475 | -5% $319 | +0% $164 | +5% $8 | +10% $-147 |
|---|---|---|---|---|---|
| Rent | -10% $-170 | -5% $-3 | +0% $164 | +5% $331 | +10% $498 |
| Rate | -1.0pp $390 | -0.5pp $278 | base $164 | +0.5pp $47 | +1.0pp $-71 |
4-unit breakdown (identical units grouped — click to expand)
| Units | Beds | Baths | Est. rent |
|---|---|---|---|
| 4× units | 2 | 1 | $4,228 |
| #1 | 2 | 1 | $1,057 |
| #2 | 2 | 1 | $1,057 |
| #3 | 2 | 1 | $1,057 |
| #4 | 2 | 1 | $1,057 |
| Total (4 units) | $4,228 | ||
UW: 25.0% down · 7.5% · 30yr · 1.5% tax · 5.0% vac · 8.0% maint · 8.0% mgmt
Financing live
Cash to close
- Down payment
- $112,500
- Closing costs
- $13,500
- Reserves months
- —
- Total cash needed
- —
Loan-product check · same deal, 3 products live
Conventional
25% down · 7.5% · 30yr
- Down + closing
- —
- Monthly P&I
- —
- Monthly cashflow
- —
- DSCR
- —
- Eligible?
- —
Personal DTI + credit; lowest rate.
DSCR
20% down · 8.5% · 30yr
- Down + closing
- —
- Monthly P&I
- —
- Monthly cashflow
- —
- DSCR
- —
- Eligible?
- —
No personal income docs; deal must DSCR.
Hard money
10% down · 12.0% · 12mo
- Down + closing
- —
- Monthly P&I
- —
- Monthly cashflow
- —
- DSCR
- —
- Eligible?
- —
Short-term bridge; refi at stabilization.
Listing history 2 events
-
2026-04-20status Pending
-
2026-04-16$450,000 Active
ⓘ Source: listings_history table (triggers on properties + properties_extension) + one-shot
backfill from property_details.listing_events for pre-trigger history.
Climate risk First Street
- Flood 7/10 Severe FEMA zone X (unshaded) · 99% chance over 30 yrs
- Wildfire 3/10 Moderate
- Heat 4/10 Moderate 7 d/yr ≥102°F today · 19 d/yr by 30 yrs out
- Wind 2/10 Low 2% chance of damaging wind over 30 yrs
- Air quality 2/10 Low 1 unhealthy d/yr today · 1 by 30 yrs out
Nearby sold comps map
Loading sold comps map…
Walkable amenities ~0.75 mi
Loading nearby amenities…
Taxation est. · year 1
- Rental income
- $50,736
- − Mortgage interest
- −$25,207
- − Property taxes
- −$6,750
- − Insurance
- −$3,048
- − Repairs & maintenance
- −$4,059
- − Management
- −$4,059
- − Depreciation
- −$13,091
- Taxable loss
- −$5,477
- Est. tax savings @ 24.0%
- +$1,315
- After-tax cash flow
- $3,280/yr
For passive investors: Depreciation is non-cash, so a rental often shows a tax loss while cash-flowing — sheltering income. Rental losses are passive: they offset passive income freely, and up to $25,000/yr can offset ordinary (W-2) income if you actively participate and your MAGI is under $100k (phasing out to $0 by $150k); unused losses carry forward. On sale, claimed depreciation is recaptured at up to 25%, and gains may owe capital-gains tax (a 1031 exchange can defer both). Figures are a year-1 estimate at your 24.0% rate — not tax advice; consult a CPA.
Condition & rehab AI · 13 photos
A multi-family property with average condition, requiring minor repairs and maintenance to enhance its curb appeal and value.
Repairs flagged
- Minor Exterior paint — Slight discoloration visible on siding.
- Minor Landscaping — Some areas could use trimming and additional plants.
- Minor Interior paint — Slight wear visible on walls and trim.
Value-add opportunities
- Both Paint exterior siding — Enhances curb appeal and property value.
- Both Landscaping improvements — Improves curb appeal and adds value.
- Both Interior paint refresh — Enhances interior appearance and value.
- Both HVAC maintenance — Ensures comfort and energy efficiency, boosting value.
Renovation cost estimate screening
| Repair item | Severity | Est. cost |
|---|---|---|
| Exterior paint · Slight discoloration visible on siding. | Minor | $500–3,000 |
| Landscaping · Some areas could use trimming and additional plants. | Minor | $500–3,000 |
| Interior paint · Slight wear visible on walls and trim. | Minor | $500–3,000 |
| Total estimated repair cost · 3 items | $1,500–9,000 |
Value-add ROI direction
- Both Paint exterior siding — Enhances curb appeal and property value. ↑
- Both Landscaping improvements — Improves curb appeal and adds value. ↑
- Both Interior paint refresh — Enhances interior appearance and value. ↑
- Both HVAC maintenance — Ensures comfort and energy efficiency, boosting value. ↑
ⓘ Cost ranges are severity-bucket heuristics (US national rule-of-thumb). Get contractor quotes + a written scope before underwriting a rehab budget.
Schools (NCES district)
- District
- Bourbon County
- NCES district ID
- 2100540
- Math proficiency
- 26% ▼ -19.00%
- Reading proficiency
- 32% ▼ -21.00%
- Median HH income
- $47,654
- Composite
- 25.13/100
- National rank
- #7523
- State rank
- #108 of 165 in KY
Livability — Paris
- Score
- 67/100
- State rank
- #218
- US rank
- #10589
Category grades
Schools grade is shown separately in the Schools card above.
Census & demographics
- Census place
- Paris, KY
- County
- Bourbon County · 18,361 people
- City population
- 18,361
- Metro
- Lexington-Fayette, KY
- Population (ZIP)
- 18,361
- Household income
- $63,333
- Rent vs Own
- Severe rent burden
- 509.0
Population outlook (Bourbon County) Hauer SSP2
- Today (2025)
- 20,485 people
- By 2030
- 20,559 · +0.4%
- By 2040
- 20,491 · +0.0%
- By 2050
- 20,065 · -2.1%
- By 2075
- 19,173 · -6.4%
- By 2100
- 16,646 · -18.7%
Race, ethnicity, and origin ACS 2023
- Neighborhood character
- Predominantly White (83%)
- Race & ethnicity
- White 83% Hispanic / Latino 8% Two or more races 6% Black 5%
- Hispanic origin (detail)
- Mexican 6% Cuban 1%
- Common ancestry
- Slovak 2% Serbian 2% Iranian 2%
- Foreign-born
- 4% · Canada, Dominican Republic
- Languages at home
- 94% English-only · Spanish 5% French/Haitian/Cajun 1%
Political lean MEDSL · Bourbon
- 2024 margin
- Solid R (+33.5) · D 32.4% · R 65.9% · Other 1.7%
- 2008→2024 swing
- -16.3pp toward R · 2008: -17.2pp · 2024: -33.5pp
- All cycles
- 2024: R+33.5 2020: R+30.0 2016: R+31.6 2012: R+20.4 2008: R+17.2
Not yet ingested
- Civics
- —
Market trends
- HPI YoY
- ▼ -72.90%
- Current HPI
- 241.9393
- Rent YoY
- —
- Metro
- Lexington-Fayette, KY
- State GDP YoY
- ▲ 1.81%
- F500 in state
- 4
Industry mix (Fortune 500 HQ in KY)
| Industry | F500 HQs | Revenue |
|---|---|---|
| Healthcare | 1 | $118B |
|
||
| Food / Beverage | 1 | $7B |
|
||
Price history
2 events — show timeline
- 2026-04-20 Pending — ImagineMLS
- 2026-04-16 Listed $450,000 ImagineMLS
Cash-flow waterfall
monthlySold comps — $/sqft
last 12 mo · ≤1 miLoading sold comps…