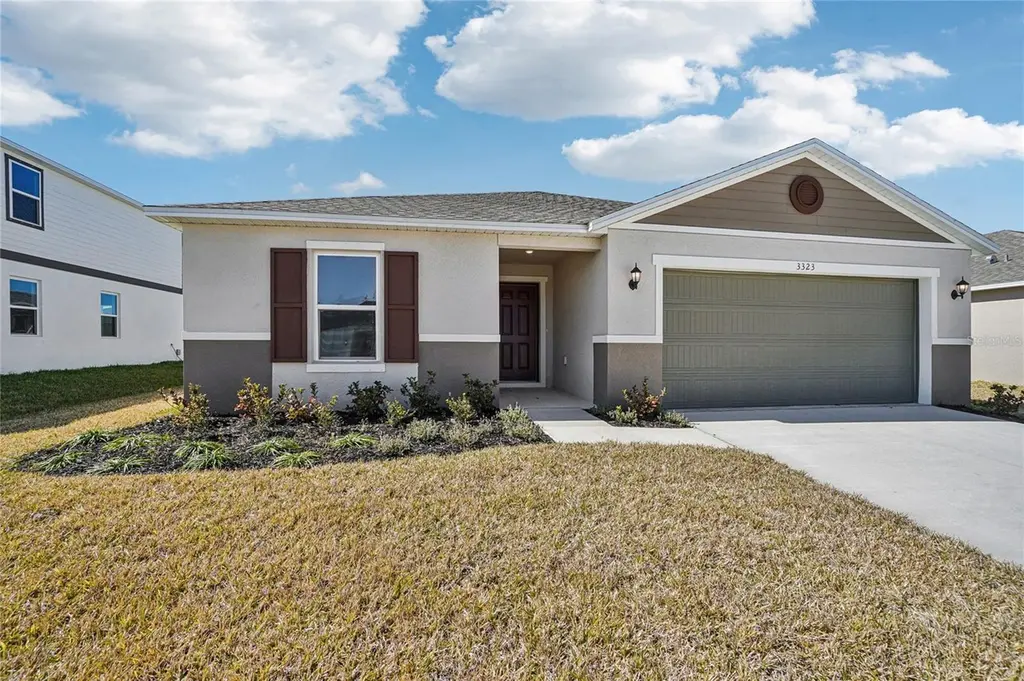
3323 Canberra Pl · Ellenton, FL
Flood risk No data
- FEMA flood zone
- —
- Chance of flooding over 30 yrs
- —
- Est. flood insurance / yr
- —
Fire risk No data
- Est. fire insurance / yr
- —
Heat risk No data
- Hot days now (above threshold)
- —
- Hot days in 30 yrs
- —
Wind risk No data
- Chance of severe wind over 30 yrs
- —
Air-quality risk No data
- Unhealthy air days now
- —
- Unhealthy air days in 30 yrs
- —
Risk factors via First Street. Map © Google.
Why this score? — see what drove the D- grade
The composite is a weighted blend of 9 inputs, each scored 0–100. Each bar is that input's sub-score; the figure is the points it added to the 100-point composite (weight × sub-score).
- Cash flow +10.1/30.0
- ARV discount +7.5/15.0
- Schools +4.4/10.0
- Livability +3.8/5.0
- DSCR +2.9/10.0
- Condition / age +2.5/5.0
- 1% rule +2.2/10.0
- Rent growth +1.8/5.0
- Appreciation +0.0/10.0
$372,758
🖨 Deal sheet (PDF) 📄 Offer letter ✓ Due diligence
Listing remarks
This spectacular single-story home is sure to leave you in awe. As you enter, you will immediately notice the tile flooring located throughout the wet and common areas. Positioned toward the front of the house are 3 secondary bedrooms, each with its own closet and a full secondary bathroom. The spacious great room offers 8-ft. ceilings which lead you out to the covered patio. Meal prep will be a breeze in this kitchen with 36-in. upper cabinets with brushed nickel hardware, a pantry, an eat-at island, a stainless-steel Whirlpool® appliance package, and granite countertops. The primary bedroom with connecting bath includes a sizeable walk-in closet, an extended dual sink vanity with gran
Key facts
- Walk-in closet
- Covered patio
- Tile flooring
Tags
Property features AI
Finance
- Other: Lot approximately 0.16 acres (about 0 to less than 1/4 acre); Asphalt road access; Direction to property available
- Financial info: CDD present; Lease restrictions apply
- HOA & community: HOA managed by Unique Property Services/Ken Perrault; HOA required with annual fee of $164 (monthly equivalent $13.67); Community amenities include a pool and a playground; Pets allowed
Exterior
- Parking: Attached 2-car garage
- Utilities: Public water; Public sewer; Cable available; High-speed internet available
- Home design: Single family residence; One story; Property faces east; Completed condition
- Construction: Block and stucco construction; Shingle roof; Slab foundation; New construction; Built by KB Home (model 1989F)
- Exterior features: Covered patio; Patio; Sidewalk; Sliding doors
Interior
- Kitchen: Dishwasher; Disposal; Range; Range hood
- Bedrooms: 4 bedrooms
- Flooring: Carpet; Tile
- Bathrooms: 2 full bathrooms
- Heating & cooling: Central heating; Central air conditioning
- Interior features: Open floorplan; Stone counters; Thermostat; Walk-in closets
- Laundry & utility: Dedicated laundry room
Neighborhood map
What this means for you Summary
Snapshot
- This is a 4-bed/2.0-bath land listed at $373k.
Deal economics
- At list price, monthly cash flow is $-220 ($-3k/yr) — negative.
- To cash-flow at today's rent, offer at most $334k (10.4% below list).
- To meet the 1% rule (rent ≥ 1% of price), the offer needs to be $269k (27.9% below list).
- Recommended offer: $269k (27.9% below list) — sets the bar for 1% rule.
- Cap rate 5.6% vs local median 4.5% in Ellenton — meaningfully above typical; check what's discounted (condition, days-on-market, listing class) to confirm the premium yield is real.
Location & tenants
- Location reads 76/100 on livability (#232 in FL, #3,666 nationally) — a middle-class / working-renter tenant base. Strengths: cost of living A+, housing A+, health & safety A+; Watch: amenities F, commute F.
- Manatee (suburban): math 54% / reading 50% proficiency, ranked #26 of 73 in FL (top 36%) — acceptable for families but not a draw, mixed tenant base, ~2y average lease.
- Zoned schools: Blackburn Elementary School (math 62% / reading 42%, grade C-, #990 of 2,144 statewide, top 48%, 551 students, 78% FRL); Palmetto High School (math 22% / reading 36%, grade F, #456 of 667 statewide, top 68%, 2,100 students, 61% FRL) — zoned schools average 70% FRL vs 51% district-wide (19 pts higher); higher-poverty schools than district average — tighter screening recommended.
- Market conditions: Rents soft (-3.0%/yr); 1170 active listings in the ZIP; 13 comparable units currently listed for rent nearby; rentals leasing fast (median 5d on market — plan ~1-2 weeks tenant-placement turnaround); solid renter incomes; 7,472 units permitted in Manatee County in 2024 (1,782 in 5+ unit buildings).
- This rent runs 41% of the median local income ($78k/yr) — at the standard rent-burdened threshold; future hikes will face affordability resistance.
Forward outlook
- Local home prices are declining (-3.0%/yr); year-one equity from $3k of loan paydown is wiped out by about $11k of value loss. Plan a longer hold.
- Manatee County population projected at +43% by 2050 — long-run rental-demand tailwind backs the buy-and-hold thesis.
Negotiation context
- It's been on market 254 days — a 12% lower offer ($328k) is reasonable based on typical stale-listing flexibility.
Questions for the listing agent
- What do current leases actually rent for vs. the listed asking? Can we see a recent rent roll and the last 12 months of T-12 income?
- It's been on market 254 days. Have you received any prior offers? Is the seller open to a 28% concession, seller financing, or rate buy-down credit?
- What does the HOA fee cover, when was the last increase, and are there any pending special assessments or reserve-fund shortfalls?
- Why hasn't it sold? Are there any deal-killer items the seller is aware of (foundation, flood, title, zoning, code violations)?
- Is there a deadline driving the sale (1031 exchange, divorce, estate, relocation)? That informs how much negotiation room exists.
- Schools are D-rated, which usually means shorter tenancies and higher turnover. Who's the typical renter profile here, and what's been the actual vacancy rate?
- The area grade is low — what's the realistic commute time and amenity access for the typical tenant pool here? Any planned neighborhood developments (good or bad) we should know about?
- What's the average days-on-market for RENTAL listings here right now (not sales)? A rising rental-DOM trend means longer vacancies and softer asking-rent achievability than the comps imply.
- What's the recent tenant-quality profile in this submarket — average credit score on applications, eviction rate, late-payment / NSF rate, and stable-employment percentage? A property-management company in the area should have these aggregated.
- How much new for-sale + rental construction is in the pipeline within 1–3 miles? Heavy new supply typically softens prices + rents 12–24 months out; constrained supply supports both.
Investment metrics
- 1% rule
- 0.72% ✗
- Cap rate
- 5.59%
- Cash-on-cash
- -2.52%
- DSCR
- 0.89
- GRM
- 11.6
CMA / ARV
No comps found within radius.
Projected returns pro-forma
-3.0% appreciation · 0.0% rent growth · sell at horizon
- IRR
- -23.6%
- Equity multiple
- 0.21×
- Total profit
- $-82,360
- Equity at exit
- $55,579
- IRR
- -28.2%
- Equity multiple
- -0.16×
- Total profit
- $-120,563
- Equity at exit
- $32,229
Cash invested: $104,372 (down + closing). Projections, not guarantees.
Landlord ↔ Tenant lean methodology
- Overall (STATE)
- 87 Strongly Landlord-Friendly
- State Florida
- 87 Strongly Landlord-Friendly · R+3
- County
- — inherits STATE
- City
- — inherits STATE
ZIP-level market 34221
- Rents YoY
- -3.0%
- Active inventory
- 1170
- Price-to-rent
- 11.6×
Monthly cashflow live
- Estimated rent
- $2,686 high interval (Pro) →
- Mortgage (P&I)
- −$1,955
- Tax from tax record
- −$218 /mo · $2,620/yr
- Insurance
- −$155
- HOA
- −$13
- Vacancy / Maint / Mgmt
- −$564
- Net cashflow
- $-220
Break-even live
Sensitivity live
| Price | -10% $-9 | -5% $-114 | +0% $-220 | +5% $-325 | +10% $-431 |
|---|---|---|---|---|---|
| Rent | -10% $-432 | -5% $-326 | +0% $-220 | +5% $-113 | +10% $-7 |
| Rate | -1.0pp $-32 | -0.5pp $-125 | base $-220 | +0.5pp $-316 | +1.0pp $-414 |
UW: 25.0% down · 7.5% · 30yr · 1.5% tax · 5.0% vac · 8.0% maint · 8.0% mgmt
Financing live
Cash to close
- Down payment
- $93,190
- Closing costs
- $11,183
- Reserves months
- —
- Total cash needed
- —
Loan-product check · same deal, 3 products live
Conventional
25% down · 7.5% · 30yr
- Down + closing
- —
- Monthly P&I
- —
- Monthly cashflow
- —
- DSCR
- —
- Eligible?
- —
Personal DTI + credit; lowest rate.
DSCR
20% down · 8.5% · 30yr
- Down + closing
- —
- Monthly P&I
- —
- Monthly cashflow
- —
- DSCR
- —
- Eligible?
- —
No personal income docs; deal must DSCR.
Hard money
10% down · 12.0% · 12mo
- Down + closing
- —
- Monthly P&I
- —
- Monthly cashflow
- —
- DSCR
- —
- Eligible?
- —
Short-term bridge; refi at stabilization.
Rent comps 13 comps
| Address | Beds | Baths | Sqft | Rent | $/sqft | DOM | Units | Dist |
|---|---|---|---|---|---|---|---|---|
| 3911 Willow Walk Dr Palmetto, FL | 3.0 | 2.0 | 1978 | $2,636 | $1.33 | 5d | 1 | 0.51mi |
| 4042 Wayfarer Way Palmetto, FL | 4.0 | 2.0 | 1828 | $2,600 | $1.42 | 18d | 1 | 0.60mi |
| 3616 Mossy Limb Ct Palmetto, FL | 4.0 | 2.0 | 2068 | $2,500 | $1.21 | 13d | 1 | 0.60mi |
| 4648 Lindever Ln Palmetto, FL | 3.0 | 2.0 | 1498 | $2,289 | $1.53 | 4d | 1 | 0.82mi |
| 4916 Willow Breeze Way Palmetto, FL | 4.0 | 2.5 | 1997 | $2,245 | $1.12 | 3d | 1 | 0.97mi |
| 5185 Rocky Coast Pl Palmetto, FL | 3.0 | 2.0 | 1529 | $2,450 | $1.60 | 16d | 1 | 1.06mi |
| 3303 54th St E Palmetto, FL | 3.0 | 2.0 | 1285 | $2,000 | $1.56 | 5d | 1 | 1.11mi |
| 5141 Rocky Coast Pl Palmetto, FL | 4.0 | 2.5 | 2260 | $2,650 | $1.17 | 5d | 1 | 1.14mi |
| 5514 Night Owl Ter Palmetto, FL | 4.0 | 2.0 | 1752 | $2,650 | $1.51 | 18d | 1 | 1.24mi |
| 5520 Flagstone Trl Palmetto, FL | 4.0 | 2.5 | 2248 | $3,200 | $1.42 | 25d | 1 | 1.29mi |
| 5029 Rocky Coast Pl Palmetto, FL | 3.0 | 2.0 | 1482 | $2,400 | $1.62 | 12d | 1 | 1.32mi |
| 4180 Yardly Dr Palmetto, FL | 1.0–3.0 | 1.0–2.0 | 1021 | $3,139 | $3.07 | 5d | 15 | 1.46mi |
| 6010 33rd Dr E Palmetto, FL | 3.0 | 2.0 | 1287 | $2,115 | $1.64 | 5d | 1 | 1.49mi |
HOA detail
- Monthly dues
- $13 · $156/yr
- Likely covers
- pool
Listing history 17 events
-
2026-06-22days on market $372,758 Active 254 DOM
-
2026-06-18days on market $372,758 Active 251 DOM
-
2026-06-17days on market $372,758 Active 250 DOM
-
2026-06-16days on market $372,758 Active 249 DOM
-
2026-06-15days on market $372,758 Active 248 DOM
-
2026-06-13days on market $372,758 Active 246 DOM
-
2026-06-13days on market $372,758 Active 245 DOM
-
2026-06-10days on market $372,758 Active 243 DOM
-
2026-06-09days on market $372,758 Active 242 DOM
-
2026-06-08days on market $372,758 Active 241 DOM
-
2026-06-08days on market $372,758 Active 240 DOM
-
2026-06-03days on market $372,758 Active 236 DOM
-
2026-06-02days on market $372,758 Active 235 DOM
-
2026-06-01days on market $372,758 Active 234 DOM
-
2026-05-31days on market $372,758 Active 233 DOM
-
2025-10-17price $372,758
-
2025-10-10$367,758 Active
ⓘ Source: listings_history table (triggers on properties + properties_extension) + one-shot
backfill from property_details.listing_events for pre-trigger history.
Tax reassessment forecast FL · Resets to sale price
- Current annual tax
- $2,620 · $218/mo
- Projected year-2 tax
- $3,094 · $258/mo
- Expected delta
- +$474/yr (+$39/mo · 18.1%)
ⓘ Screening estimate from a state-policy table — verify with the county assessor before closing.
Nearby sold comps map
Loading sold comps map…
Walkable amenities ~0.75 mi
Loading nearby amenities…
Taxation est. · year 1
- Rental income
- $32,232
- − Mortgage interest
- −$20,880
- − Property taxes
- −$2,620
- − Insurance
- −$1,864
- − Repairs & maintenance
- −$2,579
- − Management
- −$2,579
- − HOA
- −$156
- − Depreciation
- −$10,844
- Taxable loss
- −$9,289
- Est. tax savings @ 24.0%
- +$2,229
- After-tax cash flow
- $-405/yr
For passive investors: Depreciation is non-cash, so a rental often shows a tax loss while cash-flowing — sheltering income. Rental losses are passive: they offset passive income freely, and up to $25,000/yr can offset ordinary (W-2) income if you actively participate and your MAGI is under $100k (phasing out to $0 by $150k); unused losses carry forward. On sale, claimed depreciation is recaptured at up to 25%, and gains may owe capital-gains tax (a 1031 exchange can defer both). Figures are a year-1 estimate at your 24.0% rate — not tax advice; consult a CPA.
Schools (NCES district)
- District
- Manatee
- NCES district ID
- 1201230
- Math proficiency
- 54% ▼ -6.00%
- Reading proficiency
- 50% ▼ -2.00%
- Median HH income
- $49,607
- Composite
- 44.43/100
- National rank
- #2806
- State rank
- #26 of 73 in FL
Livability — Ellenton
- Score
- 76/100
- State rank
- #232
- US rank
- #3666
Category grades
Schools grade is shown separately in the Schools card above.
Census & demographics
- Census place
- Ellenton, FL
- County
- Manatee County · 416,364 people
- City population
- 56,208
- Metro
- North Port-Sarasota-Bradenton, FL
- Population (ZIP)
- 56,208
- Household income
- $77,712
- Rent vs Own
- Severe rent burden
- 1193.0
Population outlook (Manatee County) Hauer SSP2
- Today (2025)
- 447,342 people
- By 2030
- 488,911 · +9.3%
- By 2040
- 567,934 · +27.0%
- By 2050
- 637,995 · +42.6%
- By 2075
- 781,970 · +74.8%
- By 2100
- 848,272 · +89.6%
Race, ethnicity, and origin ACS 2023
- Neighborhood character
- Diverse neighborhood (Simpson 0.58)
- Race & ethnicity
- White 59% Hispanic / Latino 22% Black 14% Two or more races 11%
- Hispanic origin (detail)
- Mexican 14% Puerto Rican 3%
- Common ancestry
- Romanian 2% Lithuanian 2% Italian 2%
- Foreign-born
- 10% · Canada, Dominican Republic, Jamaica
- Languages at home
- 81% English-only · Spanish 16% Other Indo-European 1%
Political lean MEDSL · Manatee
- 2024 margin
- Strong R (+23.5) · D 37.9% · R 61.4%
- 2008→2024 swing
- -16.5pp toward R · 2008: -7.0pp · 2024: -23.5pp
- All cycles
- 2024: R+23.5 2020: R+16.1 2016: R+17.1 2012: R+12.5 2008: R+7.0
Not yet ingested
- Civics
- —
Market trends
- HPI YoY
- ▼ -383.53%
- Current HPI
- 302.1458
- Rent YoY
- ▼ -2.98%
- Metro
- North Port-Sarasota-Bradenton, FL
- State GDP YoY
- ▲ 3.28%
- F500 in state
- 36
Industry mix (Fortune 500 HQ in FL)
| Industry | F500 HQs | Revenue |
|---|---|---|
| Industrial Technology | 2 | $29B |
|
||
| Insurance | 2 | $17B |
|
||
| Retail | 1 | $60B |
|
||
| Technology Distribution | 1 | $58B |
|
||
| Homebuilding | 1 | $35B |
|
||
| Technology Manufacturing | 1 | $35B |
|
||
Price history
+1.4% since first listed2 events — show timeline
- 2025-10-17 Price Changed $372,758 Stellar MLS as Distributed by MLS Grid
- 2025-10-10 Listed $367,758 Stellar MLS as Distributed by MLS Grid
Cash-flow waterfall
monthlySold comps — $/sqft
last 12 mo · ≤1 miLoading sold comps…