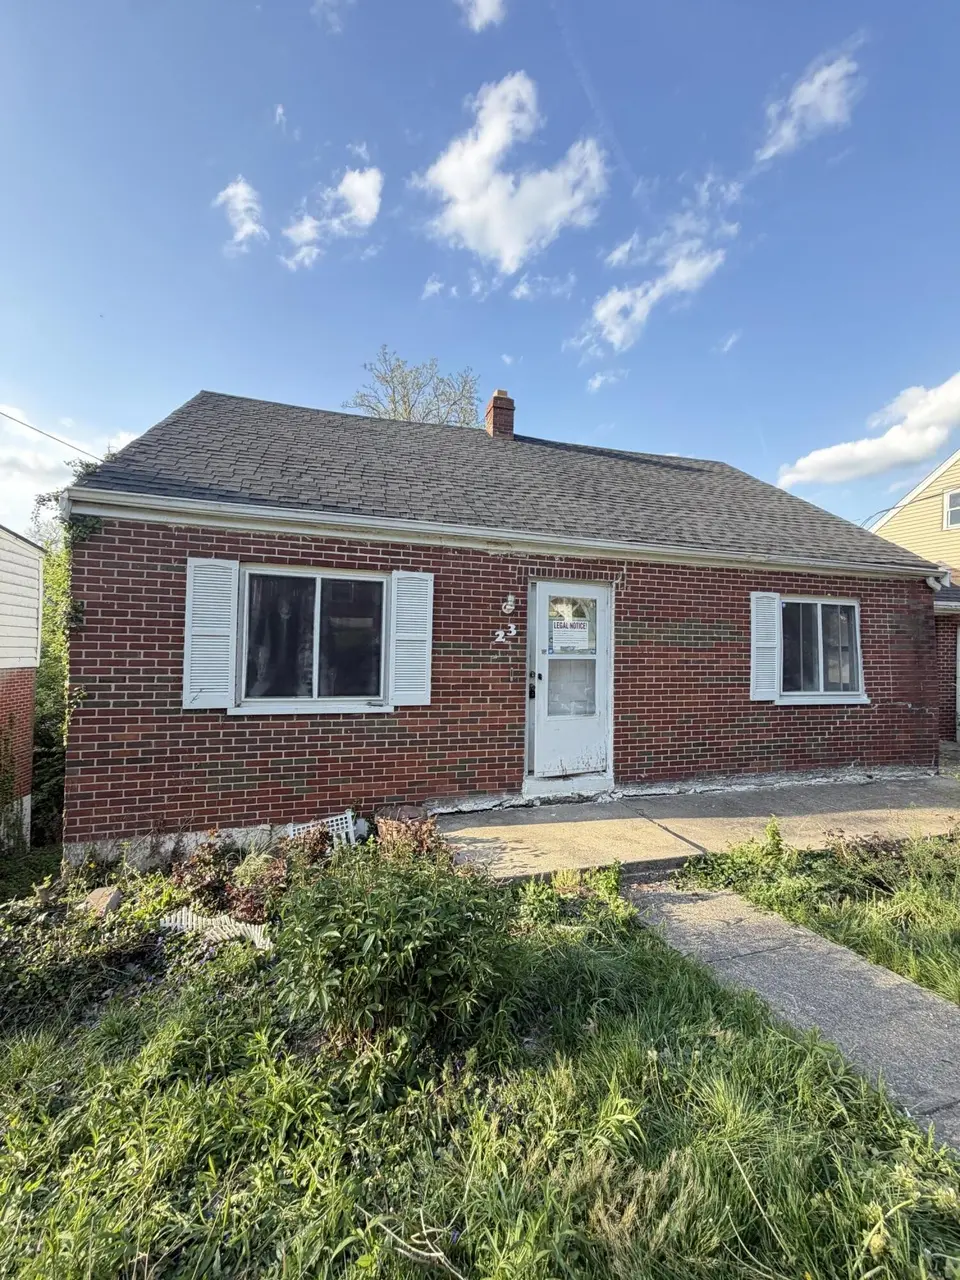
23 Laycock Ln · Newport, KY
Flood risk 1/10 · Minimal
- FEMA flood zone
- X (unshaded)
- Chance of flooding over 30 yrs
- 0.0%
- Est. flood insurance / yr
- $473 – $860
Fire risk 1/10 · Minimal
- Est. fire insurance / yr
- $839 – $1,559
Heat risk 4/10 · Minor
- Hot days now (above 103°F)
- 7 days/yr
- Hot days in 30 yrs
- 19 days/yr
Wind risk 2/10 · Minimal
- Chance of severe wind over 30 yrs
- 1.0%
Air-quality risk 3/10 · Minor
- Unhealthy air days now
- 2 days/yr
- Unhealthy air days in 30 yrs
- 3 days/yr
Risk factors via First Street. Map © Google.
Why this score? — see what drove the B- grade
The composite is a weighted blend of 9 inputs, each scored 0–100. Each bar is that input's sub-score; the figure is the points it added to the 100-point composite (weight × sub-score).
- Cash flow +30.0/30.0
- 1% rule +10.0/10.0
- DSCR +10.0/10.0
- ARV discount +7.5/15.0
- Livability +4.1/5.0
- Rent growth +3.7/5.0
- Condition / age +2.5/5.0
- Schools +1.7/10.0
- Appreciation +0.0/10.0
$60,000
🖨 Deal sheet 📄 Offer letter ✓ Due diligence
Listing remarks
Your next investment opportunity is here! Cash, as is. New roof.
Key facts
- New roof
- 6,098 sq ft lot
- Garage
Tags
Property features AI
Exterior
- Parking: Garage; Off-street parking; 1-car garage
- Utilities: Public water; Public sewer; Natural gas available
- Home design: Single-family residence; Two levels
- Construction: Built in 1952; Concrete construction; Shingle roof; Poured concrete foundation
- Exterior features: Lot approximately 0.14 acres
Interior
- Kitchen: Kitchen (approx. 10 x 12)
- Bedrooms: Primary bedroom (approx. 12 x 13)
- Bathrooms: One full bathroom; One half bathroom; Primary bath (approx. 5 x 8); Additional bathrooms (approx. 10 x 11 and 4 x 7.5)
- Heating & cooling: Central air conditioning; Forced air heating
- Interior features: Living room (approx. 12 x 16); Dining room (approx. 10 x 12); Additional bathroom spaces (multiple bathrooms described below)
Neighborhood map
What this means for you Summary
Snapshot
- This is a 3-bed/1.5-bath single-family listed at $60k.
Deal economics
- At list price, monthly cash flow is $1k ($14k/yr) — positive.
- The deal already cash-flows at list — no discount required.
- Meets the 1% rule at list price ($2k rent vs $60k).
- Recommended offer: $58k (3.0% below list) — sets the bar for market timing.
- Cap rate 29.1% vs local median 4.9% in Newport — top-decile yield for the area; either an underpriced asset or a hidden risk that comps aren't pricing in. Stress-test before assuming the spread holds.
Location & tenants
- Location reads 82/100 on livability (#58 in KY, #1,070 nationally) — a professional / high-income tenant draw. Strengths: amenities A+, commute A+, cost of living A+; Watch: crime F, employment D-.
- Newport Independent (suburban): math 14% / reading 26% proficiency, ranked #160 of 165 in KY (top 97%) — low school quality limits family demand, transient renter base, plan for 1-2y turnover; 79% free/reduced lunch — lower-income household profile, screen leases tightly.
- Zoned schools: Newport High School (math 16% / reading 28%, grade F, #202 of 254 statewide, top 82%, 579 students, 84% FRL).
- Market conditions: Rents rising fast (+4.6%/yr); 236 active listings in the ZIP; 14 comparable units currently listed for rent nearby; rentals at typical pace (median 21d on market — plan ~3-4 weeks tenant-placement turnaround); 247 units permitted in Campbell County in 2024 (77 in 5+ unit buildings).
- This rent runs 38% of the median local income ($60k/yr) — at the standard rent-burdened threshold; future hikes will face affordability resistance.
Forward outlook
- Local home prices are declining (-3.0%/yr); year-one equity from $415 of loan paydown is wiped out by about $2k of value loss. Plan a longer hold.
- At projected returns (-3.0% appreciation + 4.6% rent growth), your $17k cash investment doubles in ~2 years — after that, you're playing with house money.
Negotiation context
- It's been on market 55 days — a 3% lower offer ($58k) is reasonable based on typical stale-listing flexibility.
Risks & watch-outs
- Watch-outs: built in 1952 — expect roof / HVAC / electrical / plumbing capex.
Questions for the listing agent
- It's been on market 55 days. Have you received any prior offers? Is the seller open to a 3% concession, seller financing, or rate buy-down credit?
- Built in 1952 — when were the roof, HVAC, electrical panel, plumbing, and water heater last replaced?
- Is there a deadline driving the sale (1031 exchange, divorce, estate, relocation)? That informs how much negotiation room exists.
- Schools are D-rated, which usually means shorter tenancies and higher turnover. Who's the typical renter profile here, and what's been the actual vacancy rate?
- Crime grade is F in this area — have there been break-ins, vandalism, or insurance claims at this property in the last 3 years? What carrier currently insures it and at what premium?
- What's the average days-on-market for RENTAL listings here right now (not sales)? A rising rental-DOM trend means longer vacancies and softer asking-rent achievability than the comps imply.
- What's the recent tenant-quality profile in this submarket — average credit score on applications, eviction rate, late-payment / NSF rate, and stable-employment percentage? A property-management company in the area should have these aggregated.
- How much new for-sale + rental construction is in the pipeline within 1–3 miles? Heavy new supply typically softens prices + rents 12–24 months out; constrained supply supports both.
Investment metrics
- 1% rule
- 3.19% ✓
- Cap rate
- 29.13%
- Cash-on-cash
- 81.55%
- DSCR
- 4.63
- GRM
- 2.6
CMA / ARV
- ARV (median comp)
- $219,690
- List price
- $60,000
- Delta
- -72.69%
- Verdict
- UNDERPRICED
- Comps
- 20 within 1.0 mi
Show comp detail 12 sales within ~0.75 mi
| Address | Dist | Beds/Ba | Sqft | Sold | Price | $/sf | Match |
|---|---|---|---|---|---|---|---|
| 2318 Macarthur Ln | 0.25mi | 3/1.0 | 1,438 (-3%) | 3mo | $285,000 | $198 | 78 |
| 222 Beech Rd | 0.58mi | 3/1.0 | 1,532 (+3%) | 4mo | $239,900 | $157 | 62 |
| 63 Parkview Ave | 0.65mi | 3/2.5 | 1,452 (-2%) | 2mo | $288,000 | $198 | 60 |
| 2318 Joyce Ave | 0.33mi | 3/1.0 | 1,325 (-11%) | 5mo | $252,500 | $191 | 60 |
| 2413 Joyce Ave | 0.38mi | 3/1.5 | 1,304 (-12%) | 6mo | $277,000 | $212 | 57 |
| 103 W Walnut St | 0.66mi | 3/1.0 | 1,579 (+6%) | 0mo | $286,500 | $181 | 57 |
| 39 19th St | 0.54mi | 3/2.5 | 1,590 (+7%) | 4mo | $260,000 | $164 | 56 |
| 7 Parkview Ave | 0.57mi | 2/1.0 (-1) | 1,395 (-6%) | 0mo | $259,900 | $186 | 56 |
| 64 Parkview Ave | 0.64mi | 3/2.0 | 1,620 (+9%) | 2mo | $130,000 | $80 | 52 |
| 1157 Park Ave | 0.66mi | 2/2.0 (-1) | 1,564 (+5%) | 4mo | $290,000 | $185 | 50 |
| 110 Maple Ave | 0.67mi | 3/2.0 | 1,700 (+14%) | 1mo | $260,000 | $153 | 42 |
| 94 Home St | 0.70mi | 3/1.0 | 1,288 (-13%) | 2mo | $210,000 | $163 | 41 |
Match score weights: distance 35% · size 25% · config 20% · recency 20%. Top-matched comps best support the ARV.
Projected returns pro-forma
-3.0% appreciation · 4.64% rent growth · sell at horizon
- IRR
- 83.6%
- Equity multiple
- 4.94×
- Total profit
- $66,201
- Equity at exit
- $8,946
- IRR
- 87.2%
- Equity multiple
- 10.81×
- Total profit
- $164,889
- Equity at exit
- $5,188
Cash invested: $16,800 (down + closing). Projections, not guarantees.
Landlord ↔ Tenant lean methodology
- Overall (STATE)
- 83 Strongly Landlord-Friendly
- State Kentucky
- 83 Strongly Landlord-Friendly · R+16
- County
- — inherits STATE
- City
- — inherits STATE
ZIP-level market 41071
- Rents YoY
- 4.6%
- Active inventory
- 236
- Price-to-rent
- 2.6×
Monthly cashflow live
- Estimated rent
- $1,912 high interval (Pro) →
- Mortgage (P&I)
- −$315
- Tax from tax record
- −$29 /mo · $348/yr
- Insurance
- −$25
- HOA
- −$0
- Vacancy / Maint / Mgmt
- −$401
- Net cashflow
- $1,142
Break-even live
UW: 25.0% down · 7.5% · 30yr · 1.5% tax · 5.0% vac · 8.0% maint · 8.0% mgmt
Financing live
Cash to close
- Down payment
- $15,000
- Closing costs
- $1,800
- Reserves months
- —
- Total cash needed
- —
Loan-product check · same deal, 3 products live
Conventional
25% down · 7.5% · 30yr
- Down + closing
- —
- Monthly P&I
- —
- Monthly cashflow
- —
- DSCR
- —
- Eligible?
- —
Personal DTI + credit; lowest rate.
DSCR
20% down · 8.5% · 30yr
- Down + closing
- —
- Monthly P&I
- —
- Monthly cashflow
- —
- DSCR
- —
- Eligible?
- —
No personal income docs; deal must DSCR.
Hard money
10% down · 12.0% · 12mo
- Down + closing
- —
- Monthly P&I
- —
- Monthly cashflow
- —
- DSCR
- —
- Eligible?
- —
Short-term bridge; refi at stabilization.
Rent comps 14 comps
| Address | Beds | Baths | Sqft | Rent | $/sqft | DOM | Units | Dist |
|---|---|---|---|---|---|---|---|---|
| 35 Gettysburg Square Rd Fort Thomas, KY | 1.0–2.0 | 1.0 | 800 | $1,630 | $2.04 | 2d | 29 | 0.48mi |
| 3949 Vision CIR Southgate, KY | 1.0–2.0 | 1.0–2.0 | 1132 | $2,515 | $2.22 | 1d | 10 | 0.55mi |
| 1044 Washington Ave #2 Newport, KY | 2.0 | 2.0 | 1250 | $1,800 | $1.44 | 43d | 1 | 0.85mi |
| 40 Edwards Ct Fort Thomas, KY | 2.0 | 1.0 | 1013 | $2,100 | $2.07 | 1d | 1 | 0.87mi |
| 929 Boone St Newport, KY | 2.0 | 2.0 | 1458 | $1,495 | $1.03 | 43d | 1 | 0.96mi |
| 926 Ravine Cir Southgate, KY | 1.0–3.0 | 1.0–2.0 | 954 | $1,634 | $1.71 | 2d | 6 | 1.06mi |
| 814 Washington Ave Unit 2 Newport, KY | 2.0 | 2.0 | 1450 | $1,500 | $1.03 | 23d | 1 | 1.11mi |
| 911 Putnam St #2 Newport, KY | 2.0 | 1.0 | 1000 | $1,600 | $1.60 | 21d | 1 | 1.13mi |
| 128 W 9th St Newport, KY | 2.0 | 1.0 | 1012 | $1,650 | $1.63 | 2d | 1 | 1.20mi |
| 203 W 8th St Newport, KY | 2.0 | 1.5 | 1456 | $2,300 | $1.58 | 21d | 1 | 1.33mi |
| 809 Isabella St Newport, KY | 2.0 | 2.0 | 1519 | $2,200 | $1.45 | 43d | 1 | 1.34mi |
| 1700 Aspen Pines Dr Wilder, KY | 1.0–3.0 | 1.0–2.5 | 1420 | $2,365 | $1.67 | 1d | 14 | 1.35mi |
| 327 Covert Run Pike Unit 1 Bellevue, KY | 2.0 | 2.0 | 1580 | $1,850 | $1.17 | 23d | 1 | 1.40mi |
| 239 Grandview Ave Bellevue, KY | 2.0 | 2.0 | 1093 | $1,645 | $1.50 | 4d | 2 | 1.46mi |
Listing history 18 events
-
2026-06-18days on market $60,000 Active 55 DOM
-
2026-06-17days on market $60,000 Active 54 DOM
-
2026-06-16days on market $60,000 Active 53 DOM
-
2026-06-15days on market $60,000 Active 52 DOM
-
2026-06-13days on market $60,000 Active 50 DOM
-
2026-06-09days on market $60,000 Active 46 DOM
-
2026-06-08days on market $60,000 Active 45 DOM
-
2026-06-07days on market $60,000 Active 44 DOM
-
2026-06-05days on market $60,000 Active 41 DOM
-
2026-06-03days on market $60,000 Active 40 DOM
-
2026-06-02days on market $60,000 Active 39 DOM
-
2026-06-01days on market $60,000 Active 38 DOM
-
2026-05-31days on market $60,000 Active 37 DOM
-
2026-04-23$60,000 Active 65-char remark
-
2002-07-01soldstatus $66,500
-
1991-11-19soldstatus $20,000
-
1987-09-21soldstatus $37,000
-
1985-06-17soldstatus $35,000
ⓘ Source: listings_history table (triggers on properties + properties_extension) + one-shot
backfill from property_details.listing_events for pre-trigger history.
Tax reassessment forecast KY · Resets to sale price
- Current annual tax
- $348 · $29/mo
- Projected year-2 tax
- $516 · $43/mo
- Expected delta
- +$168/yr (+$14/mo · 48.2%)
ⓘ Screening estimate from a state-policy table — verify with the county assessor before closing.
Climate risk First Street
- Flood 1/10 Low FEMA zone X (unshaded) · 0% chance over 30 yrs
- Wildfire 1/10 Low
- Heat 4/10 Moderate 7 d/yr ≥103°F today · 19 d/yr by 30 yrs out
- Wind 2/10 Low 100% chance of damaging wind over 30 yrs
- Air quality 3/10 Moderate 2 unhealthy d/yr today · 3 by 30 yrs out
Nearby sold comps map
Loading sold comps map…
Walkable amenities ~0.75 mi
Loading nearby amenities…
Taxation est. · year 1
- Rental income
- $22,942
- − Mortgage interest
- −$3,361
- − Property taxes
- −$348
- − Insurance
- −$300
- − Repairs & maintenance
- −$1,835
- − Management
- −$1,835
- − Depreciation
- −$1,745
- Taxable income
- $13,517
- Est. tax owed @ 24.0%
- −$3,244
- After-tax cash flow
- $10,457/yr
For passive investors: Depreciation is non-cash, so a rental often shows a tax loss while cash-flowing — sheltering income. Rental losses are passive: they offset passive income freely, and up to $25,000/yr can offset ordinary (W-2) income if you actively participate and your MAGI is under $100k (phasing out to $0 by $150k); unused losses carry forward. On sale, claimed depreciation is recaptured at up to 25%, and gains may owe capital-gains tax (a 1031 exchange can defer both). Figures are a year-1 estimate at your 24.0% rate — not tax advice; consult a CPA.
Schools (NCES district)
- District
- Newport Independent
- NCES district ID
- 2104440
- Math proficiency
- 14% ▼ -11.00%
- Reading proficiency
- 26% ▼ -6.00%
- Median HH income
- $35,783
- Composite
- 16.51/100
- National rank
- #9182
- State rank
- #160 of 165 in KY
Livability — Newport
- Score
- 82/100
- State rank
- #58
- US rank
- #1070
Category grades
Schools grade is shown separately in the Schools card above.
Census & demographics
- Census place
- Newport, KY
- County
- Campbell County · 84,793 people
- City population
- 19,680
- Metro
- Cincinnati, OH-KY-IN
- Population (ZIP)
- 19,680
- Household income
- $59,976
- Rent vs Own
- Severe rent burden
- 1136.0
Population outlook (Campbell County) Hauer SSP2
- Today (2025)
- 95,668 people
- By 2030
- 96,886 · +1.3%
- By 2040
- 97,734 · +2.2%
- By 2050
- 96,413 · +0.8%
- By 2075
- 90,211 · -5.7%
- By 2100
- 79,434 · -17.0%
Race, ethnicity, and origin ACS 2023
- Neighborhood character
- Predominantly White (84%)
- Race & ethnicity
- White 84% Black 7% Two or more races 6% Hispanic / Latino 5%
- Common ancestry
- Slovak 3% Lithuanian 2% Italian 2%
- Foreign-born
- 4% · Canada
- Languages at home
- 95% English-only · Spanish 3% Other Indo-European 1%
Political lean MEDSL · Campbell
- 2024 margin
- R (+19.7) · D 39.2% · R 58.9% · Other 1.9%
- 2008→2024 swing
- +1.2pp toward D · 2008: -20.9pp · 2024: -19.7pp
- All cycles
- 2024: R+19.7 2020: R+18.6 2016: R+24.5 2012: R+22.8 2008: R+20.9
Not yet ingested
- Civics
- —
Market trends
- HPI YoY
- ▼ -193.38%
- Current HPI
- 244.9069
- Rent YoY
- ▲ 4.64%
- Metro
- Cincinnati, OH-KY-IN
- State GDP YoY
- ▲ 1.81%
- F500 in state
- 4
Industry mix (Fortune 500 HQ in KY)
| Industry | F500 HQs | Revenue |
|---|---|---|
| Healthcare | 1 | $118B |
|
||
| Food / Beverage | 1 | $7B |
|
||
Price history
+71.4% since first listed5 events — show timeline
- 2026-04-23 Listed $60,000 NKMLS
- 2002-07-01 Sold (Public Records) $66,500 Public Records
- 1991-11-19 Sold (Public Records) $20,000 Public Records
- 1987-09-21 Sold (Public Records) $37,000 Public Records
- 1985-06-17 Sold (Public Records) $35,000 Public Records
Property tax history
+0.7%/yrLatest (2025): $348 · -6.1% YoY. Source: county tax records.
Cash-flow waterfall
monthlySold comps — $/sqft
last 12 mo · ≤1 miLoading sold comps…