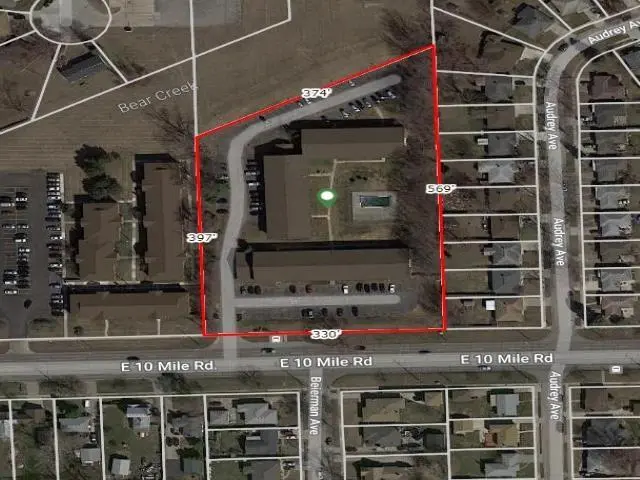
4949 E 10 Mile Rd · Warren, MI
Flood risk 9/10 · Severe
- FEMA flood zone
- X (unshaded)
- Chance of flooding over 30 yrs
- 0.99%
- Est. flood insurance / yr
- $507 – $1,088
Fire risk 1/10 · Minimal
- Est. fire insurance / yr
- $784 – $1,456
Heat risk 3/10 · Minor
- Hot days now (above 97°F)
- 7 days/yr
- Hot days in 30 yrs
- 15 days/yr
Wind risk 1/10 · Minimal
- Chance of severe wind over 30 yrs
- —
Air-quality risk 3/10 · Minor
- Unhealthy air days now
- 3 days/yr
- Unhealthy air days in 30 yrs
- 5 days/yr
Risk factors via First Street. Map © Google.
Why this score? — see what drove the B- grade
The composite is a weighted blend of 9 inputs, each scored 0–100. Each bar is that input's sub-score; the figure is the points it added to the 100-point composite (weight × sub-score).
- Cash flow +30.0/30.0
- 1% rule +10.0/10.0
- DSCR +10.0/10.0
- ARV discount +7.5/15.0
- Livability +3.7/5.0
- Rent growth +3.1/5.0
- Condition / age +2.5/5.0
- Schools +1.8/10.0
- Appreciation +0.0/10.0
$64,900
🖨 Deal sheet 📄 Offer letter ✓ Due diligence
Listing remarks MLS
Great location and place on ground level priced to sell
Key facts
- $290 HOA
- Built 1973
- Listed 34 days
Neighborhood map
What this means for you Summary
Snapshot
- This is a 2-bed/1.0-bath condo listed at $65k.
Deal economics
- At list price, monthly cash flow is $204 ($2k/yr) — positive.
- The deal already cash-flows at list — no discount required.
- Meets the 1% rule at list price ($1k rent vs $65k).
- Recommended offer: $63k (3.0% below list) — sets the bar for market timing.
- Cap rate 11.3% vs local median 5.3% in Warren — top-decile yield for the area; either an underpriced asset or a hidden risk that comps aren't pricing in. Stress-test before assuming the spread holds.
Location & tenants
- Location reads 74/100 on livability (#171 in MI, #4,491 nationally) — a middle-class / working-renter tenant base. Strengths: commute A+, cost of living A+, housing A+; Watch: schools D, amenities D, employment D.
- Center Line Public Schools (suburban): math 14% / reading 29% proficiency, ranked #459 of 540 in MI (top 85%) — low school quality limits family demand, transient renter base, plan for 1-2y turnover; 60% free/reduced lunch — lower-income household profile, screen leases tightly.
- Market conditions: Rents rising (+2.4%/yr); 168 active listings in the ZIP; 8 comparable units currently listed for rent nearby; rentals lingering (median 44d on market — plan ~5-8 weeks vacancy on turnover, expect pricing pressure); 50% of comp listings sitting > 30 days — soft ceiling on asking rent; 1,321 units permitted in Macomb County in 2024 (86 in 5+ unit buildings).
Forward outlook
- Local home prices are declining (-3.0%/yr); year-one equity from $449 of loan paydown is wiped out by about $2k of value loss. Plan a longer hold.
- Macomb County population projected at +9% by 2050 — modest demand growth; plan on rents tracking national, not racing it.
- At projected returns (-3.0% appreciation + 2.4% rent growth), your $18k cash investment doubles in ~10 years — after that, you're playing with house money.
Negotiation context
- It's been on market 34 days — a 3% lower offer ($63k) is reasonable based on typical stale-listing flexibility.
- 33 sale attempts since 32y ago with the ask held roughly flat each time — persistent listings suggest the price (not the market) is what's stuck; bring a comps-based counter.
- Current owner paid $53k; 22% above their basis — modest negotiation headroom, anchor on the comps not their cost.
Risks & watch-outs
- Watch-outs: flood insurance adds $66/mo; HOA is 23% of rent.
- Climate carrying-cost: severe flood risk — expect insurance premiums to compound above CPI over the hold.
Questions for the listing agent
- It's been on market 34 days. Have you received any prior offers? Is the seller open to a 3% concession, seller financing, or rate buy-down credit?
- Built in 1973 — when were the roof, HVAC, electrical panel, plumbing, and water heater last replaced?
- What's the actual annual flood-insurance premium (NFIP or private), and is the property in a SFHA with mandatory coverage?
- What does the HOA fee cover, when was the last increase, and are there any pending special assessments or reserve-fund shortfalls?
- Any open or pending special assessments — roof, HVAC, plumbing, elevator, façade? What's the per-unit balance and payoff schedule, and is the seller paying it off at close or rolling it to the buyer?
- Is there a deadline driving the sale (1031 exchange, divorce, estate, relocation)? That informs how much negotiation room exists.
- Schools are D-rated, which usually means shorter tenancies and higher turnover. Who's the typical renter profile here, and what's been the actual vacancy rate?
- Crime grade is D in this area — have there been break-ins, vandalism, or insurance claims at this property in the last 3 years? What carrier currently insures it and at what premium?
- What's the average days-on-market for RENTAL listings here right now (not sales)? A rising rental-DOM trend means longer vacancies and softer asking-rent achievability than the comps imply.
- What's the recent tenant-quality profile in this submarket — average credit score on applications, eviction rate, late-payment / NSF rate, and stable-employment percentage? A property-management company in the area should have these aggregated.
- How much new apartment / multifamily construction is in the pipeline within 1–3 miles? Heavy new supply (>2% of stock underway) typically softens rents 12–24 months out; light construction supports rent growth.
Investment metrics
- 1% rule
- 1.97% ✓
- Cap rate
- 11.29%
- Cash-on-cash
- 17.86%
- DSCR
- 1.79
- GRM
- 4.2
CMA / ARV
No comps found within radius.
Projected returns pro-forma
-3.0% appreciation · 2.35% rent growth · sell at horizon
- IRR
- 2.7%
- Equity multiple
- 1.10×
- Total profit
- $1,887
- Equity at exit
- $9,677
- IRR
- 11.6%
- Equity multiple
- 1.88×
- Total profit
- $15,983
- Equity at exit
- $5,611
Cash invested: $18,172 (down + closing). Projections, not guarantees.
Landlord ↔ Tenant lean methodology
- Overall (STATE)
- 62 Landlord-Friendly
- State Michigan
- 62 Landlord-Friendly · EVEN
- County
- — inherits STATE
- City
- — inherits STATE
ZIP-level market 48091
- Rents YoY
- 2.4%
- Active inventory
- 168
- Price-to-rent
- 4.2×
Monthly cashflow live
- Estimated rent
- $1,277 high interval (Pro) →
- Mortgage (P&I)
- −$340
- Tax est. 1.5%
- −$81 /mo · $974/yr
- Insurance
- −$27
- Flood insurance flood zone
- −$66 /mo · $798/yr
- HOA
- −$290
- Vacancy / Maint / Mgmt
- −$268
- Net cashflow
- $204
Break-even live
UW: 25.0% down · 7.5% · 30yr · 1.5% tax · 5.0% vac · 8.0% maint · 8.0% mgmt
Financing live
Cash to close
- Down payment
- $16,225
- Closing costs
- $1,947
- Reserves months
- —
- Total cash needed
- —
Loan-product check · same deal, 3 products live
Conventional
25% down · 7.5% · 30yr
- Down + closing
- —
- Monthly P&I
- —
- Monthly cashflow
- —
- DSCR
- —
- Eligible?
- —
Personal DTI + credit; lowest rate.
DSCR
20% down · 8.5% · 30yr
- Down + closing
- —
- Monthly P&I
- —
- Monthly cashflow
- —
- DSCR
- —
- Eligible?
- —
No personal income docs; deal must DSCR.
Hard money
10% down · 12.0% · 12mo
- Down + closing
- —
- Monthly P&I
- —
- Monthly cashflow
- —
- DSCR
- —
- Eligible?
- —
Short-term bridge; refi at stabilization.
Rent comps 8 comps
| Address | Beds | Baths | Sqft | Rent | $/sqft | DOM | Units | Dist |
|---|---|---|---|---|---|---|---|---|
| 4652 E 10 Mile Rd Warren, MI | 2.0 | 1.0 | 950 | $1,200 | $1.26 | 43d | 1 | 0.17mi |
| 4385 Frazho Rd Warren, MI | 1.0–2.0 | 1.0 | 825 | $1,305 | $1.58 | 3d | 6 | 0.54mi |
| 3840 Bart Ave Warren, MI | 3.0 | 1.0 | 1062 | $1,350 | $1.27 | 24d | 1 | 1.05mi |
| 22580 Masch Ave Warren, MI | 3.0 | 1.0 | 988 | $1,450 | $1.47 | 24d | 1 | 1.17mi |
| 25005 Lawrence Ave Center Line, MI | 1.0–2.0 | 1.0–1.5 | 1000 | $955 | $0.95 | 43d | 1 | 1.20mi |
| 22622 Panama Ave Warren, MI | 3.0 | 1.5 | 920 | $1,395 | $1.52 | 10d | 1 | 1.25mi |
| 7212 Helen St Unit 7212 Center Line, MI | 1.0 | 1.0 | 650 | $1,000 | $1.54 | 43d | 1 | 1.29mi |
| 2709 Capitol Ave Warren, MI | 3.0 | 2.0 | 1056 | $1,649 | $1.56 | 43d | 1 | 1.38mi |
HOA detail condo
- Monthly dues
- $290 · $3,480/yr
- Assessments
- None detected in remarks — confirm with the listing agent.
Listing history 50 events
-
2024-12-17status Pending
-
2022-06-17status Pending
Show marketing remark (58 chars)
Great location and place on ground level priced to sell
-
2022-06-17status Pending 58-char remark
Show marketing remark (58 chars)
Great location and place on ground level priced to sell
-
2022-05-21status Active
Show marketing remark (58 chars)
Great location and place on ground level priced to sell
-
2022-05-21status Active 58-char remark
Show marketing remark (58 chars)
Great location and place on ground level priced to sell
-
2022-05-08status Pending
Show marketing remark (58 chars)
Great location and place on ground level priced to sell
-
2022-05-08status Pending 58-char remark
Show marketing remark (58 chars)
Great location and place on ground level priced to sell
-
2022-05-02$64,900 Active
Show marketing remark (58 chars)
Great location and place on ground level priced to sell
-
2022-05-02$64,900 Active 58-char remark
Show marketing remark (58 chars)
Great location and place on ground level priced to sell
-
2021-04-01soldstatus $53,000 305-char remark
Show marketing remark (305 chars)
Specious Condo, 2nd floor unit Condo, fully remodeled. Ready to move in , 2 bed rooms. Master bedroom with walk in closet and also attached to walk in bathroom. Paint 2019, furnace 2011, Bathroom 2019. New spot lights 2020, new fridge and oven 2019 , new kitchen floor 2020 . Inground pool for Summer fun.
-
2020-11-07$65,550 305-char remark
Show marketing remark (305 chars)
Specious Condo, 2nd floor unit Condo, fully remodeled. Ready to move in , 2 bed rooms. Master bedroom with walk in closet and also attached to walk in bathroom. Paint 2019, furnace 2011, Bathroom 2019. New spot lights 2020, new fridge and oven 2019 , new kitchen floor 2020 . Inground pool for Summer fun.
-
2020-01-21soldstatus $37,500
-
2019-10-11$38,900
-
2017-03-31soldstatus $43,650
-
2017-03-31soldstatus $43,650
-
2017-02-10$48,000
-
2017-02-10historical
-
2017-02-10$48,000
-
2017-02-10historical
-
2017-01-05$48,000
-
2017-01-05$48,000
-
2017-01-05historical
-
2017-01-03soldstatus $28,000
-
2016-11-22$30,000
-
2016-08-10$50,000
-
2014-03-26soldstatus $38,000
-
2014-02-28historical
-
2013-10-31$40,000
-
2011-06-28soldstatus $12,522
-
2011-06-22historical
-
2011-05-18$10,500
-
2011-01-06soldstatus $11,001
-
2010-12-14historical
-
2010-07-02$12,000
-
2008-09-05historical
-
2007-08-24historical
-
2007-05-22$50,000
-
2007-05-22historical
-
2007-04-12$55,000
-
2007-04-12historical
-
2007-02-27$59,900
-
2007-02-27historical
-
2007-01-17$65,000
-
2007-01-17historical
-
2006-12-01$65,000
-
2006-10-14$65,000
-
2005-12-12soldstatus $55,700
-
2005-11-28historical
-
2005-11-07historical
-
2005-10-05$56,000
ⓘ Source: listings_history table (triggers on properties + properties_extension) + one-shot
backfill from property_details.listing_events for pre-trigger history.
Climate risk First Street
- Flood 9/10 Extreme FEMA zone X (unshaded) · 99% chance over 30 yrs
- Wildfire 1/10 Low
- Heat 3/10 Moderate 7 d/yr ≥97°F today · 15 d/yr by 30 yrs out
- Wind 1/10 Low
- Air quality 3/10 Moderate 3 unhealthy d/yr today · 5 by 30 yrs out
Nearby sold comps map
Loading sold comps map…
Walkable amenities ~0.75 mi
Loading nearby amenities…
Taxation est. · year 1
- Rental income
- $15,327
- − Mortgage interest
- −$3,635
- − Property taxes
- −$974
- − Insurance
- −$1,122
- − Repairs & maintenance
- −$1,226
- − Management
- −$1,226
- − HOA
- −$3,480
- − Depreciation
- −$1,888
- Taxable income
- $1,775
- Est. tax owed @ 24.0%
- −$426
- After-tax cash flow
- $2,022/yr
For passive investors: Depreciation is non-cash, so a rental often shows a tax loss while cash-flowing — sheltering income. Rental losses are passive: they offset passive income freely, and up to $25,000/yr can offset ordinary (W-2) income if you actively participate and your MAGI is under $100k (phasing out to $0 by $150k); unused losses carry forward. On sale, claimed depreciation is recaptured at up to 25%, and gains may owe capital-gains tax (a 1031 exchange can defer both). Figures are a year-1 estimate at your 24.0% rate — not tax advice; consult a CPA.
Schools (NCES district)
- District
- Center Line Public Schools
- NCES district ID
- 2608580
- Math proficiency
- 14% ▼ -8.00%
- Reading proficiency
- 29% ▼ -3.00%
- Median HH income
- $38,011
- Composite
- 17.95/100
- National rank
- #8992
- State rank
- #459 of 540 in MI
Livability — Warren
- Score
- 74/100
- State rank
- #171
- US rank
- #4491
Category grades
Schools grade is shown separately in the Schools card above.
Census & demographics
- Census place
- Warren, MI
- County
- Macomb County · 638,552 people
- City population
- 114,937
- Metro
- Detroit-Warren-Dearborn, MI
- Population (ZIP)
- 30,696
- Household income
- $54,230
- Rent vs Own
- Severe rent burden
- 1296.0
Population outlook (Macomb County) Hauer SSP2
- Today (2025)
- 925,296 people
- By 2030
- 948,226 · +2.5%
- By 2040
- 983,961 · +6.3%
- By 2050
- 1,010,200 · +9.2%
- By 2075
- 1,076,222 · +16.3%
- By 2100
- 1,077,065 · +16.4%
Race, ethnicity, and origin ACS 2023
- Neighborhood character
- Diverse neighborhood (Simpson 0.68)
- Race & ethnicity
- White 47% Black 25% Asian 19% Two or more races 5% Hispanic / Latino 3% Native American 2%
- Common ancestry
- Romanian 7% Lithuanian 2% Slovak 1%
- Foreign-born
- 16% · Canada
- Languages at home
- 77% English-only · Other Indo-European 14% Other Asian/Pacific 3% Russian/Polish/Slavic 2%
Political lean MEDSL · Macomb
- 2024 margin
- R (+13.7) · D 42.2% · R 55.9% · Other 1.9%
- 2008→2024 swing
- -22.3pp toward R · 2008: 8.6pp · 2024: -13.7pp
- All cycles
- 2024: R+13.7 2020: R+8.1 2016: R+11.6 2012: D+4.0 2008: D+8.6
Not yet ingested
- Civics
- —
Market trends
- HPI YoY
- ▼ -199.66%
- Current HPI
- 177.9273
- Rent YoY
- ▲ 2.35%
- Metro
- Detroit-Warren-Dearborn, MI
- State GDP YoY
- ▲ 1.37%
- F500 in state
- 28
Industry mix (Fortune 500 HQ in MI)
| Industry | F500 HQs | Revenue |
|---|---|---|
| Automotive Parts | 3 | $48B |
|
||
| Automotive | 2 | $372B |
|
||
| Chemicals | 1 | $45B |
|
||
| Automotive Retail | 1 | $29B |
|
||
| Healthcare / Medical Devices | 1 | $23B |
|
||
| Automotive Technology | 1 | $20B |
|
||
Price history
+54.9% since first listed81 events — show timeline
- 2024-12-17 Pending — REALCOMP
- 2022-06-17 Pending — REALCOMP
- 2022-06-17 Pending — MiRealSource-MiMLS
- 2022-05-21 Relisted — REALCOMP
- 2022-05-21 Relisted — MiRealSource-MiMLS
- 2022-05-08 Pending — REALCOMP
- 2022-05-08 Pending — MiRealSource-MiMLS
- 2022-05-02 Listed $64,900 MiRealSource-MiMLS
- 2022-05-02 Listed $64,900 REALCOMP
- 2021-04-01 Sold (MLS) $53,000 REALCOMP
- 2020-11-07 Listed $65,550 REALCOMP
- 2020-01-21 Sold (MLS) $37,500 REALCOMP
- 2019-10-11 Listed $38,900 REALCOMP
- 2017-03-31 Sold (MLS) $43,650 REALCOMP
- 2017-03-31 Sold (MLS) $43,650 REALCOMP
- 2017-02-10 Listing Removed — REALCOMP
- 2017-02-10 Listed $48,000 REALCOMP
- 2017-02-10 Listing Removed — REALCOMP
- 2017-02-10 Listed $48,000 REALCOMP
- 2017-01-05 Listing Removed — REALCOMP
- 2017-01-05 Listed $48,000 REALCOMP
- 2017-01-05 Listed $48,000 REALCOMP
- 2017-01-03 Sold (MLS) $28,000 REALCOMP
- 2016-11-22 Listed $30,000 REALCOMP
- 2016-08-10 Listed $50,000 REALCOMP
- 2014-03-26 Sold (MLS) $38,000 MiRealSource-MiMLS
- 2014-02-28 Listing Removed — MiRealSource-MiMLS
- 2013-10-31 Listed $40,000 MiRealSource-MiMLS
- 2011-06-28 Sold (MLS) $12,522 MiRealSource-MiMLS
- 2011-06-22 Listing Removed — MiRealSource-MiMLS
- 2011-05-18 Listed $10,500 MiRealSource-MiMLS
- 2011-01-06 Sold (MLS) $11,001 MiRealSource-MiMLS
- 2010-12-14 Listing Removed — MiRealSource-MiMLS
- 2010-07-02 Listed $12,000 MiRealSource-MiMLS
- 2008-09-05 Listing Removed — MiRealSource-MiMLS
- 2007-08-24 Listing Removed — MiRealSource-MiMLS
- 2007-05-22 Listing Removed — MiRealSource-MiMLS
- 2007-05-22 Listed $50,000 MiRealSource-MiMLS
- 2007-04-12 Listing Removed — MiRealSource-MiMLS
- 2007-04-12 Listed $55,000 MiRealSource-MiMLS
- 2007-02-27 Listing Removed — MiRealSource-MiMLS
- 2007-02-27 Listed $59,900 MiRealSource-MiMLS
- 2007-01-17 Listing Removed — MiRealSource-MiMLS
- 2007-01-17 Listed $65,000 MiRealSource-MiMLS
- 2006-12-01 Listed $65,000 MiRealSource-MiMLS
- 2006-10-14 Listed $65,000 MiRealSource-MiMLS
- 2005-12-12 Sold (MLS) $55,700 MiRealSource-MiMLS
- 2005-11-28 Listing Removed — MiRealSource-MiMLS
- 2005-11-07 Listing Removed — MiRealSource-MiMLS
- 2005-10-05 Listed $56,000 MiRealSource-MiMLS
- 2005-06-12 Listed $65,000 MiRealSource-MiMLS
- 2003-09-22 Sold (MLS) $69,800 MiRealSource-MiMLS
- 2003-07-25 Listing Removed — MiRealSource-MiMLS
- 2003-04-02 Listed $67,800 MiRealSource-MiMLS
- 2002-06-19 Sold (MLS) $72,000 MiRealSource-MiMLS
- 2002-05-17 Listing Removed — MiRealSource-MiMLS
- 2002-05-03 Sold (MLS) $58,000 MiRealSource-MiMLS
- 2002-04-16 Listed $72,900 MiRealSource-MiMLS
- 2002-03-18 Listing Removed — MiRealSource-MiMLS
- 2002-02-22 Listed $58,200 MiRealSource-MiMLS
- 2000-05-25 Sold (MLS) $53,000 MiRealSource-MiMLS
- 2000-05-10 Listing Removed — MiRealSource-MiMLS
- 2000-04-03 Sold (MLS) $60,500 MiRealSource-MiMLS
- 2000-04-02 Listed $55,900 MiRealSource-MiMLS
- 2000-01-11 Listing Removed — MiRealSource-MiMLS
- 1999-11-09 Listed $63,500 MiRealSource-MiMLS
- 1997-10-17 Sold (MLS) $41,000 MiRealSource-MiMLS
- 1997-09-23 Listing Removed — MiRealSource-MiMLS
- 1997-08-07 Listed $45,000 MiRealSource-MiMLS
- 1997-06-23 Sold (MLS) $43,500 MiRealSource-MiMLS
- 1997-05-02 Listing Removed — MiRealSource-MiMLS
- 1997-01-07 Listed $46,000 MiRealSource-MiMLS
- 1996-09-06 Sold (MLS) $40,000 MiRealSource-MiMLS
- 1996-08-13 Listing Removed — MiRealSource-MiMLS
- 1996-07-15 Listed $43,500 MiRealSource-MiMLS
- 1996-06-05 Sold (MLS) $37,000 MiRealSource-MiMLS
- 1996-05-04 Listing Removed — MiRealSource-MiMLS
- 1996-04-28 Listed $39,900 MiRealSource-MiMLS
- 1994-07-19 Listing Removed — MiRealSource-MiMLS
- 1994-07-12 Sold (MLS) $39,000 MiRealSource-MiMLS
- 1994-03-16 Listed $41,900 MiRealSource-MiMLS
Cash-flow waterfall
monthlySold comps — $/sqft
last 12 mo · ≤1 miLoading sold comps…