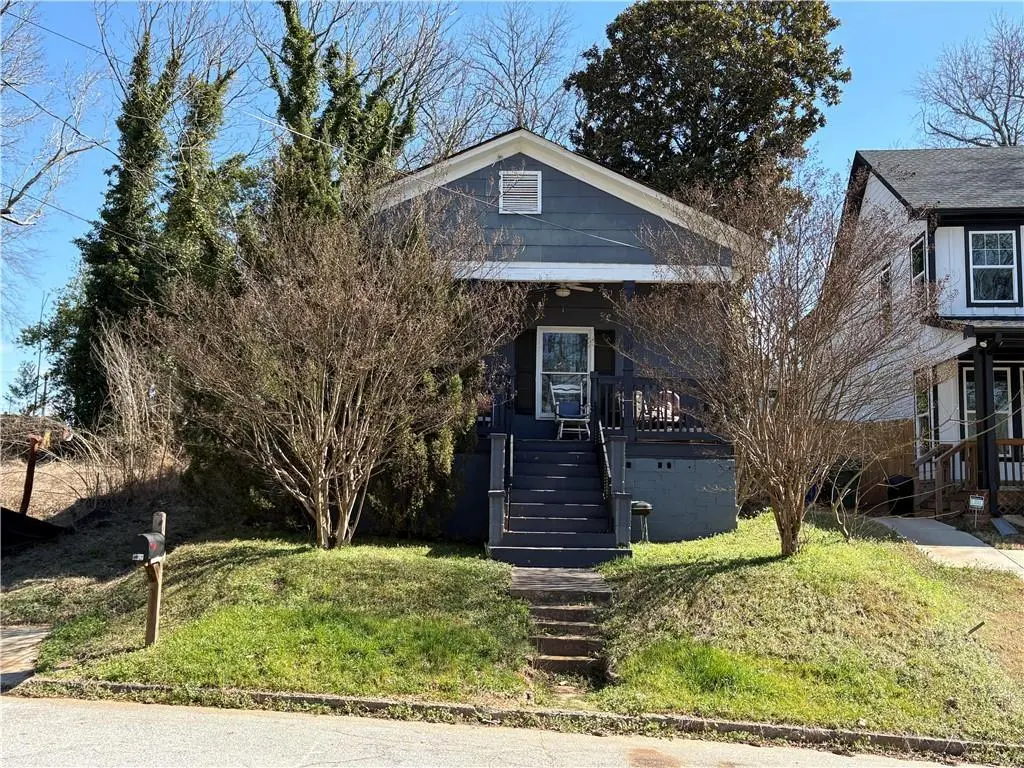
1154 Welch St SW · Atlanta, GA
Flood risk 1/10 · Minimal
- FEMA flood zone
- X (unshaded)
- Chance of flooding over 30 yrs
- 0.0%
- Est. flood insurance / yr
- $473 – $860
Fire risk 1/10 · Minimal
- Est. fire insurance / yr
- $963 – $1,789
Heat risk 5/10 · Moderate
- Hot days now (above 104°F)
- 7 days/yr
- Hot days in 30 yrs
- 16 days/yr
Wind risk 6/10 · Moderate
- Chance of severe wind over 30 yrs
- 27.0%
Air-quality risk 4/10 · Minor
- Unhealthy air days now
- 4 days/yr
- Unhealthy air days in 30 yrs
- 6 days/yr
Risk factors via First Street. Map © Google.
Why this score? — see what drove the B- grade
The composite is a weighted blend of 9 inputs, each scored 0–100. Each bar is that input's sub-score; the figure is the points it added to the 100-point composite (weight × sub-score).
- Cash flow +23.8/30.0
- ARV discount +15.0/15.0
- DSCR +7.7/10.0
- 1% rule +7.0/10.0
- Livability +4.2/5.0
- Rent growth +3.2/5.0
- Schools +2.7/10.0
- Condition / age +2.5/5.0
- Appreciation +0.0/10.0
$149,900
🖨 Deal sheet (PDF) 📄 Offer letter ✓ Due diligence
Listing remarks MLS
This property is a fantastic opportunity for both seasoned investors and first-time home buyers. Located in thriving Pittsburgh district near the newly developed Pittsburgh Yards, it features an open floor plan with high ceilings and abundant natural light. The spacious private fenced backyard provides a perfect spot for entertaining or relaxing. Conveniently situated just minutes from major highways (175/I85/I20), it offers easy access to the airport, downtown Atlanta, Southside Beltline trail, Georgia State University, Georgia Aquarium, the new Georgia stadium, Mercedes Benz Stadium, State Farm Arena, as well as local parks and restaurants. The Summerhill area nearby delivers additional conveniences such as Publix, coffee shops, and dining options, making daily living effortless. The future of this neighborhood is promising, with west end revitalization projects and Murphy Crossing underway. Being sold AS IS.
Key facts
- Nearby local parks
- 3,998 sq ft lot
- Built 1920
Tags
Neighborhood map
What this means for you Summary
Snapshot
- This is a 2-bed/1.0-bath single-family listed at $150k.
Deal economics
- At list price, monthly cash flow is $287 ($3k/yr) — positive.
- The deal already cash-flows at list — no discount required.
- Meets the 1% rule at list price ($2k rent vs $150k).
- Recommended offer: $136k (9.0% below list) — sets the bar for market timing.
- Cap rate 8.6% vs local median 3.1% in Atlanta — top-decile yield for the area; either an underpriced asset or a hidden risk that comps aren't pricing in. Stress-test before assuming the spread holds.
Location & tenants
- Location reads 83/100 on livability (#6 in GA, #919 nationally) — a professional / high-income tenant draw. Strengths: amenities A+, commute A+, housing A+; Watch: cost of living C-.
- Atlanta Public Schools (urban): math 28% / reading 35% proficiency, ranked #80 of 174 in GA (top 46%) — families likely to look elsewhere, expect single-tenant / working-renter base with shorter leases; 71% free/reduced lunch — lower-income household profile, screen leases tightly.
- Zoned schools: Kipp Ways Primary Charter School (math 5% / reading 5%, grade F, #1,160 of 1,228 statewide, top 98%, 477 students, 100% FRL, charter); Sylvan Hills Middle School (math 5% / reading 12%, grade F, #439 of 470 statewide, top 94%, 445 students, 100% FRL); Carver High School Early College (math 10% / reading 24%, grade F, #269 of 424 statewide, top 65%, 575 students, 100% FRL) — zoned schools average 100% FRL vs 71% district-wide (29 pts higher); higher-poverty schools than district average — tighter screening recommended.
- Zoned-school proficiency averages 10% at this address vs 32% district-wide (-21 pts) — the specific schools serving this property underperform the Atlanta Public Schools average; the district grade overstates school quality for this exact location.
- Market conditions: Rents rising (+2.8%/yr); 459 active listings in the ZIP; 40 comparable units currently listed for rent nearby; rentals at typical pace (median 26d on market — plan ~3-4 weeks tenant-placement turnaround); 11,565 units permitted in Fulton County in 2024 (8,159 in 5+ unit buildings).
Forward outlook
- Local home prices are declining (-3.0%/yr); year-one equity from $1k of loan paydown is wiped out by about $4k of value loss. Plan a longer hold.
- Fulton County population projected at +38% by 2050 — long-run rental-demand tailwind backs the buy-and-hold thesis.
Negotiation context
- It's been on market 110 days — a 9% lower offer ($136k) is reasonable based on typical stale-listing flexibility.
- 4 sale attempts since 17y ago; this cycle's ask has dropped $20k (12%) from the opening price — seller is motivated, your offer sets the floor, not the list.
- Current owner paid $85k; list at $150k implies a 76% gain — meaningful room to come down on a strong offer.
Risks & watch-outs
- Watch-outs: built in 1920 — expect roof / HVAC / electrical / plumbing capex.
- Climate carrying-cost: major wind risk, 27% chance of damaging wind over 30y; extreme-heat days projected 7→16/yr by 2055 (HVAC capex compounding) — expect insurance premiums to compound above CPI over the hold.
Questions for the listing agent
- It's been on market 110 days. Have you received any prior offers? Is the seller open to a 9% concession, seller financing, or rate buy-down credit?
- Built in 1920 — when were the roof, HVAC, electrical panel, plumbing, and water heater last replaced?
- Why hasn't it sold? Are there any deal-killer items the seller is aware of (foundation, flood, title, zoning, code violations)?
- Is there a deadline driving the sale (1031 exchange, divorce, estate, relocation)? That informs how much negotiation room exists.
- What's the average days-on-market for RENTAL listings here right now (not sales)? A rising rental-DOM trend means longer vacancies and softer asking-rent achievability than the comps imply.
- What's the recent tenant-quality profile in this submarket — average credit score on applications, eviction rate, late-payment / NSF rate, and stable-employment percentage? A property-management company in the area should have these aggregated.
- How much new for-sale + rental construction is in the pipeline within 1–3 miles? Heavy new supply typically softens prices + rents 12–24 months out; constrained supply supports both.
Investment metrics
- 1% rule
- 1.20% ✓
- Cap rate
- 8.59%
- Cash-on-cash
- 8.22%
- DSCR
- 1.37
- GRM
- 6.9
CMA / ARV
- ARV (median comp)
- $250,104
- List price
- $149,900
- Delta
- -40.06%
- Verdict
- UNDERPRICED
- Comps
- 20 within 1.0 mi
Show comp detail 12 sales within ~0.75 mi
| Address | Dist | Beds/Ba | Sqft | Sold | Price | $/sf | Match |
|---|---|---|---|---|---|---|---|
| 490 Rockwell St SW | 0.57mi | 2/2.0 | 936 (-0%) | 2mo | $179,900 | $192 | 68 |
| 1090 Ira St SW | 0.30mi | 2/1.0 | 1,008 (+8%) | 8mo | $99,999 | $99 | 67 |
| 531 Roy St SW | 0.07mi | 3/2.0 (+1) | 1,003 (+7%) | 12mo | $275,000 | $274 | 66 |
| 1143 Windsor St SW | 0.34mi | 3/1.0 (+1) | 1,008 (+8%) | 2mo | $99,000 | $98 | 65 |
| 505 Dunbar St SW | 0.04mi | 3/2.0 (+1) | 1,055 (+12%) | 8mo | $208,000 | $197 | 61 |
| 530 Erin Ave SW | 0.27mi | 3/2.0 (+1) | 1,010 (+8%) | 7mo | $299,900 | $297 | 60 |
| 997 Ira St SW | 0.39mi | 3/2.0 (+1) | 1,014 (+8%) | 4mo | $109,000 | $107 | 56 |
| 461 Deckner Ave SW | 0.59mi | 2/1.0 | 975 (+4%) | 13mo | $270,000 | $277 | 55 |
| 453 Mary St SW | 0.43mi | 2/2.0 | 1,000 (+7%) | 13mo | $295,000 | $295 | 54 |
| 953 Garibaldi St SW | 0.48mi | 3/2.0 (+1) | 1,003 (+7%) | 8mo | $265,000 | $264 | 50 |
| 913 Smith St SW | 0.50mi | 2/2.5 | 806 (-14%) | 1mo | $75,000 | $93 | 47 |
| 900 Oakhill Ave SW | 0.54mi | 3/1.0 (+1) | 1,040 (+11%) | 13mo | $257,500 | $248 | 41 |
Match score weights: distance 35% · size 25% · config 20% · recency 20%. Top-matched comps best support the ARV.
Projected returns pro-forma
-3.0% appreciation · 2.77% rent growth · sell at horizon
- IRR
- -4.0%
- Equity multiple
- 0.85×
- Total profit
- $-6,309
- Equity at exit
- $22,351
- IRR
- 5.4%
- Equity multiple
- 1.40×
- Total profit
- $16,744
- Equity at exit
- $12,961
Cash invested: $41,972 (down + closing). Projections, not guarantees.
Landlord ↔ Tenant lean methodology
- Overall (STATE)
- 90 Strongly Landlord-Friendly
- State Georgia
- 90 Strongly Landlord-Friendly · R+3
- County
- — inherits STATE
- City
- — inherits STATE
ZIP-level market 30310
- Home prices YoY
- -32.8%
- Rents YoY
- 2.8%
- Active inventory
- 459
- Price-to-rent
- 6.9×
Monthly cashflow live
- Estimated rent
- $1,803 high interval (Pro) →
- Mortgage (P&I)
- −$786
- Tax from tax record
- −$288 /mo · $3,461/yr
- Insurance
- −$62
- HOA
- −$0
- Vacancy / Maint / Mgmt
- −$379
- Net cashflow
- $287
Break-even live
Sensitivity live
| Price | -10% $372 | -5% $330 | +0% $287 | +5% $245 | +10% $203 |
|---|---|---|---|---|---|
| Rent | -10% $145 | -5% $216 | +0% $287 | +5% $359 | +10% $430 |
| Rate | -1.0pp $363 | -0.5pp $326 | base $287 | +0.5pp $249 | +1.0pp $209 |
UW: 25.0% down · 7.5% · 30yr · 1.5% tax · 5.0% vac · 8.0% maint · 8.0% mgmt
Financing live
Cash to close
- Down payment
- $37,475
- Closing costs
- $4,497
- Reserves months
- —
- Total cash needed
- —
Loan-product check · same deal, 3 products live
Conventional
25% down · 7.5% · 30yr
- Down + closing
- —
- Monthly P&I
- —
- Monthly cashflow
- —
- DSCR
- —
- Eligible?
- —
Personal DTI + credit; lowest rate.
DSCR
20% down · 8.5% · 30yr
- Down + closing
- —
- Monthly P&I
- —
- Monthly cashflow
- —
- DSCR
- —
- Eligible?
- —
No personal income docs; deal must DSCR.
Hard money
10% down · 12.0% · 12mo
- Down + closing
- —
- Monthly P&I
- —
- Monthly cashflow
- —
- DSCR
- —
- Eligible?
- —
Short-term bridge; refi at stabilization.
Rent comps 40 comps
| Address | Beds | Baths | Sqft | Rent | $/sqft | DOM | Units | Dist |
|---|---|---|---|---|---|---|---|---|
| 1133 Mayland Cir SW Atlanta, GA | 3.0 | 2.0 | 1120 | $3,600 | $3.21 | 26d | 1 | 0.09mi |
| 1180 Sims St SW Atlanta, GA | 2.0 | 1.0 | 772 | $1,100 | $1.42 | 26d | 1 | 0.11mi |
| 600 Mayland Ave SW Atlanta, GA | 3.0 | 2.0 | 1100 | $2,300 | $2.09 | 26d | 1 | 0.17mi |
| 1187 McDaniel St SW Unit B Atlanta, GA | 2.0 | 1.0 | 1038 | $1,025 | $0.99 | 14d | 1 | 0.18mi |
| 518 Erin Ave SW Atlanta, GA | 2.0 | 1.0 | 1075 | $2,500 | $2.33 | 20d | 1 | 0.24mi |
| 1097 Smith St SW Atlanta, GA | 3.0 | 2.0 | 868 | $1,750 | $2.02 | 0d | 1 | 0.27mi |
| 1178 Garibaldi St SW Atlanta, GA | 1.0 | 1.0 | 650 | $950 | $1.46 | 26d | 1 | 0.34mi |
| 1246 Allene Ave SW Atlanta, GA | 2.0 | 1.0–2.0 | 896 | $2,110 | $2.35 | 1d | 21 | 0.38mi |
| 725 Catherine St SW Unit 1 Atlanta, GA | 1.0 | 1.0 | 651 | $1,400 | $2.15 | 17d | 1 | 0.42mi |
| 725 Catherine St SW Unit 1 Atlanta, GA | 1.0 | 1.0 | 600 | $1,195 | $1.99 | 26d | 1 | 0.42mi |
| 1148 Booker Ave SW Atlanta, GA | 1.0 | 1.0 | 1012 | $900 | $0.89 | 18d | 1 | 0.44mi |
| 1093 West Ave SW Atlanta, GA | 2.0 | 1.0–2.0 | 770 | $1,414 | $1.84 | 1d | 6 | 0.48mi |
| 825 Erin Ave SW Atlanta, GA | 2.0 | 1.0 | 776 | $3,000 | $3.87 | 26d | 1 | 0.63mi |
| 840 Smith St SW Unit A Atlanta, GA | 2.0 | 1.5 | 910 | $1,550 | $1.70 | 18d | 1 | 0.68mi |
| 1483 Arthur Langford Jr Pl SW Atlanta, GA | 1.0–2.0 | 1.0 | 825 | $900 | $1.09 | 26d | 7 | 0.74mi |
| 1534 Beatie Ave SW Atlanta, GA | 3.0 | 2.0 | 1050 | $2,050 | $1.95 | 26d | 1 | 0.74mi |
| 776 Metropolitan Pkwy SW Atlanta, GA | 2.0 | 2.0 | 1062 | $2,165 | $2.04 | 0d | 2 | 0.76mi |
| 375 Lincoln St SW Atlanta, GA | 1.0 | 1.0 | 1020 | $750 | $0.74 | 26d | 1 | 0.81mi |
| 806 Murphy Ave SW Atlanta, GA | 1.0 | 1.0 | 731 | $1,254 | $1.72 | 9d | 3 | 0.83mi |
| 806 Murphy Ave SW Atlanta, GA | 1.0–2.0 | 1.0 | 825 | $1,254 | $1.52 | 26d | 8 | 0.83mi |
| 710 McDaniel St SW Unit 1 Atlanta, GA | 1.0 | 1.0 | 600 | $1,100 | $1.83 | 26d | 1 | 0.89mi |
| 404 Bass St SW Atlanta, GA | 3.0 | 2.0 | 1080 | $1,850 | $1.71 | 18d | 1 | 0.89mi |
| 235 Dodd Ave SW Atlanta, GA | 2.0 | 2.0 | 1120 | $1,595 | $1.42 | 1d | 1 | 0.90mi |
| 1645 Metropolitan Pkwy SW Unit A Atlanta, GA | 3.0 | 1.0 | 1073 | $1,795 | $1.67 | 0d | 1 | 0.93mi |
| 174 Moury Ave SW Atlanta, GA | 1.0–3.0 | 1.0–2.0 | 926 | $1,604 | $1.73 | 5d | 6 | 0.95mi |
| 717 Lee St SW Atlanta, GA | 1.0–2.0 | 1.0 | 768 | $1,374 | $1.79 | 1d | 4 | 1.01mi |
| 1056 Hank Aaron Dr SW Atlanta, GA | 1.0–2.0 | 1.0 | 753 | $1,139 | $1.51 | 9d | 6 | 1.02mi |
| 801 Joseph E Lowery Blvd SW #2 Atlanta, GA | 1.0 | 1.0 | 560 | $1,450 | $2.59 | 26d | 1 | 1.02mi |
| 1734 Cahoon St SW Atlanta, GA | 3.0 | 1.0 | 950 | $1,800 | $1.89 | 26d | 1 | 1.04mi |
| 825 Hank Aaron Dr SW Atlanta, GA | 2.0 | 2.0 | 861 | $1,470 | $1.71 | 26d | 1 | 1.06mi |
| 1293 Marcy St SE Unit 8 Atlanta, GA | 1.0 | 1.0 | 600 | $950 | $1.58 | 26d | 1 | 1.08mi |
| 1295 Marcy St SE Atlanta, GA | 1.0 | 1.0 | 650 | $950 | $1.46 | 26d | 1 | 1.09mi |
| 1293-1295 Marcy St SE Unit 7 Atlanta, GA | 1.0 | 1.0 | 650 | $950 | $1.46 | 26d | 1 | 1.09mi |
| 818 Peeples St SW Atlanta, GA | 2.0 | 1.0 | 936 | $1,500 | $1.60 | 26d | 1 | 1.10mi |
| 875 Hank Aaron Dr SW Atlanta, GA | 1.0–3.0 | 1.0–2.0 | 916 | $1,460 | $1.59 | 26d | 1 | 1.10mi |
| 72 Milton Ave SE Atlanta, GA | 2.0 | 1.0–2.0 | 818 | $2,041 | $2.49 | 0d | 19 | 1.11mi |
| 865 Hank Aaron Dr SE Unit 103 Atlanta, GA | 2.0 | 1.0 | 650 | $1,250 | $1.92 | 26d | 1 | 1.11mi |
| 2159 M L King Jr DR SW Atlanta, GA | 1.0 | 1.0 | 1050 | $800 | $0.76 | 5d | 1 | 1.11mi |
| 973 Lawton St SW Atlanta, GA | 3.0 | 1.0 | 912 | $1,575 | $1.73 | 9d | 1 | 1.14mi |
| 125 Milton Ave SE Atlanta, GA | 2.0 | 1.0–2.0 | 965 | $2,494 | $2.58 | 0d | 30 | 1.16mi |
Listing history 22 events
-
2026-06-15days on market $149,900 Active 110 DOM
-
2026-06-13days on market $149,900 Active 108 DOM
-
2026-06-13days on market $149,900 Active 107 DOM
-
2026-06-09days on market $149,900 Active 104 DOM
-
2026-06-08days on market $149,900 Active 103 DOM
-
2026-06-07days on market $149,900 Active 102 DOM
-
2026-06-04days on market $149,900 Active 99 DOM
-
2026-06-03days on market $149,900 Active 98 DOM
-
2026-06-02days on market $149,900 Active 97 DOM
-
2026-06-01days on market $149,900 Active 96 DOM
-
2026-05-31days on market $149,900 Active 95 DOM
-
2026-02-25$169,900 New 925-char remark
Show marketing remark (925 chars)
This property is a fantastic opportunity for both seasoned investors and first-time home buyers. Located in thriving Pittsburgh district near the newly developed Pittsburgh Yards, it features an open floor plan with high ceilings and abundant natural light. The spacious private fenced backyard provides a perfect spot for entertaining or relaxing. Conveniently situated just minutes from major highways (175/I85/I20), it offers easy access to the airport, downtown Atlanta, Southside Beltline trail, Georgia State University, Georgia Aquarium, the new Georgia stadium, Mercedes Benz Stadium, State Farm Arena, as well as local parks and restaurants. The Summerhill area nearby delivers additional conveniences such as Publix, coffee shops, and dining options, making daily living effortless. The future of this neighborhood is promising, with west end revitalization projects and Murphy Crossing underway. Being sold AS IS.
-
2026-02-25$169,900 Active 925-char remark
Show marketing remark (925 chars)
This property is a fantastic opportunity for both seasoned investors and first-time home buyers. Located in thriving Pittsburgh district near the newly developed Pittsburgh Yards, it features an open floor plan with high ceilings and abundant natural light. The spacious private fenced backyard provides a perfect spot for entertaining or relaxing. Conveniently situated just minutes from major highways (175/I85/I20), it offers easy access to the airport, downtown Atlanta, Southside Beltline trail, Georgia State University, Georgia Aquarium, the new Georgia stadium, Mercedes Benz Stadium, State Farm Arena, as well as local parks and restaurants. The Summerhill area nearby delivers additional conveniences such as Publix, coffee shops, and dining options, making daily living effortless. The future of this neighborhood is promising, with west end revitalization projects and Murphy Crossing underway. Being sold AS IS.
-
2019-04-04soldstatus $85,000
-
2019-03-20soldstatus $85,000 Sold
-
2019-03-05status Under Contract
-
2019-03-04$90,000 New
-
2009-10-02soldstatus $13,000
-
2009-08-24$12,900
-
2007-01-02soldstatus $62,000
-
2005-05-26soldstatus $155,000
-
2004-04-23soldstatus $38,000
ⓘ Source: listings_history table (triggers on properties + properties_extension) + one-shot
backfill from property_details.listing_events for pre-trigger history.
Tax reassessment forecast GA · Resets to sale price
- Current annual tax
- $3,461 · $288/mo
- Projected year-2 tax
- $3,461 · $288/mo
- Expected delta
- $0/yr ($0/mo · -0.0%)
ⓘ Screening estimate from a state-policy table — verify with the county assessor before closing.
Climate risk First Street
- Flood 1/10 Low FEMA zone X (unshaded) · 0% chance over 30 yrs
- Wildfire 1/10 Low
- Heat 5/10 Major 7 d/yr ≥104°F today · 16 d/yr by 30 yrs out
- Wind 6/10 Major 27% chance of damaging wind over 30 yrs
- Air quality 4/10 Moderate 4 unhealthy d/yr today · 6 by 30 yrs out
Nearby sold comps map
Loading sold comps map…
Walkable amenities ~0.75 mi
Loading nearby amenities…
Taxation est. · year 1
- Rental income
- $21,637
- − Mortgage interest
- −$8,397
- − Property taxes
- −$3,461
- − Insurance
- −$750
- − Repairs & maintenance
- −$1,731
- − Management
- −$1,731
- − Depreciation
- −$4,361
- Taxable income
- $1,207
- Est. tax owed @ 24.0%
- −$290
- After-tax cash flow
- $3,160/yr
For passive investors: Depreciation is non-cash, so a rental often shows a tax loss while cash-flowing — sheltering income. Rental losses are passive: they offset passive income freely, and up to $25,000/yr can offset ordinary (W-2) income if you actively participate and your MAGI is under $100k (phasing out to $0 by $150k); unused losses carry forward. On sale, claimed depreciation is recaptured at up to 25%, and gains may owe capital-gains tax (a 1031 exchange can defer both). Figures are a year-1 estimate at your 24.0% rate — not tax advice; consult a CPA.
Schools (NCES district)
- District
- Atlanta Public Schools
- NCES district ID
- 1300120
- Math proficiency
- 28% ▼ -6.00%
- Reading proficiency
- 35% ▼ -2.00%
- Median HH income
- $48,306
- Composite
- 27.27/100
- National rank
- #7006
- State rank
- #80 of 174 in GA
Livability — Atlanta
- Score
- 83/100
- State rank
- #6
- US rank
- #919
Category grades
Schools grade is shown separately in the Schools card above.
Census & demographics
- Census place
- Atlanta, GA
- County
- Fulton County · 1,094,430 people
- City population
- 629,525
- Metro
- Atlanta-Sandy Springs-Alpharetta, GA
- Population (ZIP)
- 27,186
- Household income
- $53,037
- Rent vs Own
- Severe rent burden
- 1676.0
Population outlook (Fulton County) Hauer SSP2
- Today (2025)
- 1,203,707 people
- By 2030
- 1,299,706 · +8.0%
- By 2040
- 1,488,256 · +23.6%
- By 2050
- 1,664,580 · +38.3%
- By 2075
- 2,036,072 · +69.2%
- By 2100
- 2,222,402 · +84.6%
Race, ethnicity, and origin ACS 2023
- Neighborhood character
- Predominantly Black (76%)
- Race & ethnicity
- Black 76% White 14% Two or more races 4% Hispanic / Latino 4% Asian 2%
- Common ancestry
- Lithuanian 1% Slovak 1% Serbian 0%
- Foreign-born
- 5% · Canada, South Korea, Vietnam
- Languages at home
- 92% English-only · Spanish 4% French/Haitian/Cajun 1% Other Indo-European 1%
Political lean MEDSL · Fulton
- 2024 margin
- Solid D (+44.9) · D 71.9% · R 27.0% · Other 1.1%
- 2008→2024 swing
- +9.8pp toward D · 2008: 35.0pp · 2024: 44.9pp
- All cycles
- 2024: D+44.9 2020: D+46.4 2016: D+42.1 2012: D+29.6 2008: D+35.0
Not yet ingested
- Civics
- —
Market trends
- HPI YoY
- ▼ -204.00%
- Current HPI
- 418.7297
- Rent YoY
- ▲ 2.77%
- Metro
- Atlanta-Sandy Springs-Alpharetta, GA
- State GDP YoY
- ▲ 2.66%
- F500 in state
- 28
Industry mix (Fortune 500 HQ in GA)
| Industry | F500 HQs | Revenue |
|---|---|---|
| Paper / Packaging | 2 | $29B |
|
||
| Retail | 1 | $160B |
|
||
| Transportation / Logistics | 1 | $91B |
|
||
| Airlines | 1 | $62B |
|
||
| Consumer Goods | 1 | $47B |
|
||
| Utilities | 1 | $25B |
|
||
Price history
+347.1% since first listed11 events — show timeline
- 2026-02-25 Listed $169,900 FMLS
- 2026-02-25 Listed $169,900 GAMLS
- 2019-04-04 Sold (Public Records) $85,000 Public Records
- 2019-03-20 Sold (MLS) $85,000 GAMLS
- 2019-03-05 Pending — GAMLS
- 2019-03-04 Listed $90,000 GAMLS
- 2009-10-02 Sold (MLS) $13,000 FMLS
- 2009-08-24 Listed $12,900 FMLS
- 2007-01-02 Sold (Public Records) $62,000 Public Records
- 2005-05-26 Sold (Public Records) $155,000 Public Records
- 2004-04-23 Sold (Public Records) $38,000 Public Records
Property tax history
+7.9%/yrLatest (2025): $3,461 · -4.1% YoY. Source: county tax records.
Cash-flow waterfall
monthlySold comps — $/sqft
last 12 mo · ≤1 miLoading sold comps…