 Duplex
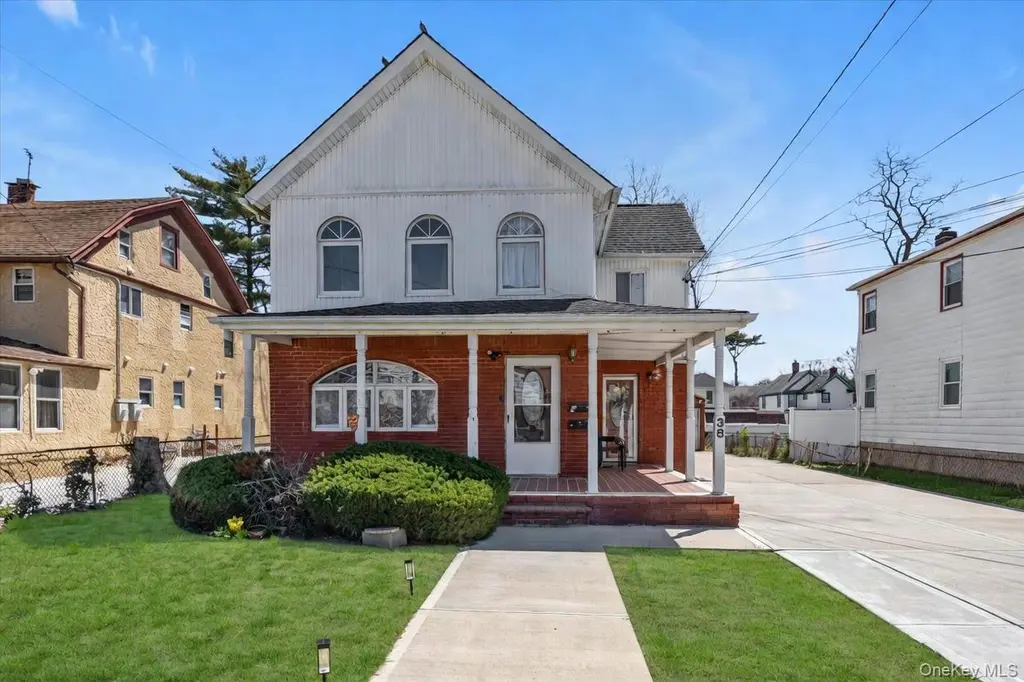
38 5th St · Valley Stream, NY
Flood risk 1/10 · Minimal
- FEMA flood zone
- X (unshaded)
- Chance of flooding over 30 yrs
- 0.0%
- Est. flood insurance / yr
- $473 – $860
Fire risk 1/10 · Minimal
- Est. fire insurance / yr
- $691 – $1,283
Heat risk 6/10 · Moderate
- Hot days now (above 97°F)
- 7 days/yr
- Hot days in 30 yrs
- 16 days/yr
Wind risk 6/10 · Moderate
- Chance of severe wind over 30 yrs
- 70.0%
Air-quality risk 3/10 · Minor
- Unhealthy air days now
- 4 days/yr
- Unhealthy air days in 30 yrs
- 4 days/yr
Risk factors via First Street. Map © Google.
Why this score? — see what drove the D grade
The composite is a weighted blend of 9 inputs, each scored 0–100. Each bar is that input's sub-score; the figure is the points it added to the 100-point composite (weight × sub-score).
- Cash flow +11.5/30.0
- ARV discount +9.4/15.0
- Schools +6.7/10.0
- Livability +4.4/5.0
- DSCR +3.4/10.0
- 1% rule +3.1/10.0
- Rent growth +2.5/5.0
- Condition / age +2.5/5.0
- Appreciation +0.0/10.0
$899,000
🖨 Deal sheet (PDF) 📄 Offer letter ✓ Due diligence
Multi-family units
County records classify this as Multi-Family (2-4 Unit). Listing-text estimate: 2 units. confirmed
Listing remarks
This Beautifully Updated 2-Family Home In Valley Stream Presents An Incredible Opportunity For Both Homeowners And Investors. Featuring Five Bedrooms And Two Full Bathrooms, The Home Offers Spacious Living With Thoughtful Upgrades Throughout. The Roof Was Recently Refinished In 2023, Adding To The Home’s Overall Value And Appeal. The Second-Floor Kitchen Is Highlighted By A Skylight That Fills The Space With Natural Light, Along Updated Bathrooms With Modern Finishes, Creating A Fresh And Inviting Feel. A Full Basement With An Outside Separate Entrance Provides Additional Space And Flexibility, Perfect For Storage, Recreation, Or Extended Living Needs. A Private Driveway Leads To A De
Key facts
- Private driveway
- Refinished roof
- Full basement
Tags
Property features AI
Exterior
- Parking: Driveway; 2-car garage
- Utilities: Public sewer; Electricity connected; Natural gas connected; Sewer connected; Water connected
- Home design: Duplex
- Exterior features: Frame construction; Not waterfront
Interior
- Heating & cooling: Baseboard heating; Steam heating; No cooling
- Interior features: Eat-in kitchen; Full walk-out basement
Neighborhood map
What this means for you Summary
Snapshot
- This is a 1×2bd/1ba + 1×3bd/1ba units multifamily listed at $899k.
Deal economics
- At list price, monthly cash flow is $-288 ($-3k/yr) — negative. Per door: $-144/mo.
- To cash-flow at today's rent, offer at most $848k (5.7% below list).
- To meet the 1% rule (rent ≥ 1% of price), the offer needs to be $726k (19.2% below list).
- Recommended offer: $726k (19.2% below list) — sets the bar for 1% rule.
- Cap rate 5.9% vs local median 3.3% in Valley Stream — top-decile yield for the area; either an underpriced asset or a hidden risk that comps aren't pricing in. Stress-test before assuming the spread holds.
Location & tenants
- Location reads 87/100 on livability (#13 in NY, #301 nationally) — a professional / high-income tenant draw. Strengths: amenities A+, commute A+, employment A+; Watch: cost of living F.
- Valley Stream Central High School District (suburban): math 71% / reading 76% proficiency, ranked #78 of 590 in NY (top 13%) — strong family-tenant draw, lease renewals of 3-5y typical; only 17% free/reduced lunch — higher-income household profile.
- Zoned schools: Brooklyn Avenue School (math 57% / reading 62%, grade B-, #745 of 2,108 statewide, top 39%, 342 students, 51% FRL); Valley Stream Memorial Junior High School (math 29% / reading 66%, grade C-, #306 of 729 statewide, top 43%, 1,038 students, 40% FRL) — zoned schools average 46% FRL vs 17% district-wide (29 pts higher); higher-poverty schools than district average — tighter screening recommended.
- Zoned-school proficiency averages 54% at this address vs 74% district-wide (-20 pts) — the specific schools serving this property underperform the Valley Stream Central High School District average; the district grade overstates school quality for this exact location.
- Market conditions: 102 active listings in the ZIP; 21 comparable units currently listed for rent nearby; rentals at typical pace (median 24d on market — plan ~3-4 weeks tenant-placement turnaround); high-income renter base; 824 units permitted in Nassau County in 2024 (153 in 5+ unit buildings).
- At $7,263/mo this rent would consume 61% of the median local household income ($142k/yr) (locally 346% of renters already pay >50% of income on rent) — very limited rent-growth headroom before tenants either downsize or default.
Forward outlook
- Local home prices are declining (-3.0%/yr); year-one equity from $6k of loan paydown is wiped out by about $27k of value loss. Plan a longer hold.
- Nassau County population projected at +7% by 2050 — modest demand growth; plan on rents tracking national, not racing it.
Negotiation context
- It's been on market 23 days — a 2% lower offer ($886k) is reasonable based on typical stale-listing flexibility.
- 5 sale attempts since 3y ago with the ask held roughly flat each time — persistent listings suggest the price (not the market) is what's stuck; bring a comps-based counter.
Risks & watch-outs
- Watch-outs: built in 1898 — expect roof / HVAC / electrical / plumbing capex.
- Climate carrying-cost: major wind risk, 70% chance of damaging wind over 30y; extreme-heat days projected 7→16/yr by 2055 (HVAC capex compounding) — expect insurance premiums to compound above CPI over the hold.
Questions for the listing agent
- What do current leases actually rent for vs. the listed asking? Can we see a recent rent roll and the last 12 months of T-12 income?
- Can we see the unit-by-unit rent roll, current vacancy, and any below-market leases? What's the average tenancy length?
- What capital expenditures (roof, boiler, parking lot, exteriors) have been made in the last 5 years, and what's planned in the next 2?
- Built in 1898 — when were the roof, HVAC, electrical panel, plumbing, and water heater last replaced?
- Is there a deadline driving the sale (1031 exchange, divorce, estate, relocation)? That informs how much negotiation room exists.
- Schools are A-rated — typically a magnet for longer-tenancy family renters. What's the average tenant stay here, and is there a school-zone premium baked into asking?
- The area grade is low — what's the realistic commute time and amenity access for the typical tenant pool here? Any planned neighborhood developments (good or bad) we should know about?
- What's the average days-on-market for RENTAL listings here right now (not sales)? A rising rental-DOM trend means longer vacancies and softer asking-rent achievability than the comps imply.
- What's the recent tenant-quality profile in this submarket — average credit score on applications, eviction rate, late-payment / NSF rate, and stable-employment percentage? A property-management company in the area should have these aggregated.
- How much new apartment / multifamily construction is in the pipeline within 1–3 miles? Heavy new supply (>2% of stock underway) typically softens rents 12–24 months out; light construction supports rent growth.
Investment metrics
- 1% rule
- 0.81% ✗
- Cap rate
- 5.91%
- Cash-on-cash
- -1.37%
- DSCR
- 0.94
- GRM
- 10.3
CMA / ARV
- ARV (on-the-fly)
- $939,176
- Comps found
- 4
Show comp detail 4 sales within ~0.75 mi
| Address | Dist | Beds/Ba | Sqft | Sold | Price | $/sf | Match |
|---|---|---|---|---|---|---|---|
| 32 Fifth St | 0.02mi | 4/2.0 | 1,756 (+1%) | 4mo | $990,000 | $564 | 94 |
| 33 Cleveland St | 0.56mi | 3/2.0 | 1,698 (-2%) | 3mo | $800,000 | $471 | 68 |
| 66 Kenmore Rd | 0.39mi | 3/2.0 | 1,525 (-12%) | 6mo | $825,000 | $541 | 57 |
| 115 N Corona Ave | 0.71mi | 3/2.0 | 1,560 (-10%) | 11mo | $725,000 | $465 | 41 |
Match score weights: distance 35% · size 25% · config 20% · recency 20%. Top-matched comps best support the ARV.
Projected returns pro-forma
-3.0% appreciation · 3.0% rent growth · sell at horizon
- IRR
- -18.6%
- Equity multiple
- 0.35×
- Total profit
- $-164,017
- Equity at exit
- $134,044
- IRR
- -11.0%
- Equity multiple
- 0.34×
- Total profit
- $-166,453
- Equity at exit
- $77,729
Cash invested: $251,720 (down + closing). Projections, not guarantees.
Landlord ↔ Tenant lean methodology
- Overall (STATE)
- 15 Strongly Tenant-Friendly
- State New York
- 15 Strongly Tenant-Friendly · D+10
- County
- — inherits STATE
- City
- — inherits STATE
ZIP-level market 11581
- Active inventory
- 102
- Price-to-rent
- 21.6×
Monthly cashflow live
- Estimated rent
- $7,263 high interval (Pro) →
- Mortgage (P&I)
- −$4,714
- Tax from tax record
- −$937 /mo · $11,239/yr
- Insurance
- −$375
- HOA
- −$0
- Vacancy / Maint / Mgmt
- −$1,525
- Net cashflow
- $-288
Break-even live
Sensitivity live
| Price | -10% $221 | -5% $-33 | +0% $-288 | +5% $-542 | +10% $-797 |
|---|---|---|---|---|---|
| Rent | -10% $-862 | -5% $-575 | +0% $-288 | +5% $-1 | +10% $286 |
| Rate | -1.0pp $165 | -0.5pp $-59 | base $-288 | +0.5pp $-521 | +1.0pp $-758 |
2-unit breakdown (identical units grouped — click to expand)
| Units | Beds | Baths | Est. rent |
|---|---|---|---|
| 1× unit | 2 | 1 | $3,466 |
| 1× unit | 3 | 1 | $3,797 |
| Total (2 units) | $7,263 | ||
UW: 25.0% down · 7.5% · 30yr · 1.5% tax · 5.0% vac · 8.0% maint · 8.0% mgmt
Financing live
Cash to close
- Down payment
- $224,750
- Closing costs
- $26,970
- Reserves months
- —
- Total cash needed
- —
Loan-product check · same deal, 3 products live
Conventional
25% down · 7.5% · 30yr
- Down + closing
- —
- Monthly P&I
- —
- Monthly cashflow
- —
- DSCR
- —
- Eligible?
- —
Personal DTI + credit; lowest rate.
DSCR
20% down · 8.5% · 30yr
- Down + closing
- —
- Monthly P&I
- —
- Monthly cashflow
- —
- DSCR
- —
- Eligible?
- —
No personal income docs; deal must DSCR.
Hard money
10% down · 12.0% · 12mo
- Down + closing
- —
- Monthly P&I
- —
- Monthly cashflow
- —
- DSCR
- —
- Eligible?
- —
Short-term bridge; refi at stabilization.
Rent comps 21 comps
| Address | Beds | Baths | Sqft | Rent | $/sqft | DOM | Units | Dist |
|---|---|---|---|---|---|---|---|---|
| 125 S Cottage St Valley Stream, NY | 1.0–2.0 | 1.0–2.0 | 1143 | $4,285 | $3.75 | 0d | 7 | 0.23mi |
| 35 Gibson Blvd Unit 2 Valley Stream, NY | 2.0 | 1.0 | 1150 | $3,900 | $3.39 | 0d | 1 | 0.27mi |
| 70 S Cottage St Valley Stream, NY | 2.0 | 1.5 | 1290 | $4,000 | $3.10 | 0d | 1 | 0.29mi |
| 66 Kenmore Rd Valley Stream, NY | 2.0 | 1.0 | 1525 | $2,950 | $1.93 | 20d | 1 | 0.41mi |
| 35 S Franklin Ave Valley Stream, NY | 3.0 | 1.5 | 1692 | $5,500 | $3.25 | 24d | 1 | 0.44mi |
| 92 Wavecrest St Valley Stream, NY | 2.0 | 1.0 | 1200 | $2,800 | $2.33 | 26d | 1 | 0.52mi |
| 510 Dubois Ave Apt 3C Valley Stream, NY | 2.0 | 1.5 | 1050 | $3,400 | $3.24 | 45d | 1 | 0.59mi |
| 19 Dartmouth St Valley Stream, NY | 3.0 | 3.5 | 1439 | $4,600 | $3.20 | 0d | 1 | 0.66mi |
| 127 Gordon Rd Valley Stream, NY | 3.0 | 1.0 | 1200 | $3,350 | $2.79 | 45d | 1 | 0.66mi |
| 103 E Saint Marks Pl Valley Stream, NY | 3.0 | 1.0 | 1758 | $3,700 | $2.10 | 0d | 1 | 0.68mi |
| 61 Hollywood Ave Lynbrook, NY | 2.0 | 1.0 | 1825 | $3,000 | $1.64 | 45d | 1 | 0.81mi |
| 78 Wood St Lynbrook, NY | 1.0 | 1.0 | 1293 | $2,800 | $2.17 | 19d | 1 | 0.92mi |
| 2 Leach St Lynbrook, NY | 3.0 | 1.0 | 1710 | $3,300 | $1.93 | 45d | 1 | 1.05mi |
| 69 Sunset Ave Lynbrook, NY | 3.0 | 2.5 | 2200 | $3,950 | $1.80 | 3d | 1 | 1.05mi |
| 26 Starks Pl Lynbrook, NY | 3.0 | 1.5 | 1822 | $3,850 | $2.11 | 3d | 1 | 1.09mi |
| 65 Prospect Ave Apt 15W Lynbrook, NY | 2.0 | 2.0 | 1060 | $3,680 | $3.47 | 24d | 1 | 1.10mi |
| 14 Endview Ave Lynbrook, NY | 2.0 | 2.0 | 1210 | $3,650 | $3.02 | 45d | 1 | 1.18mi |
| 363 Hewlett Pkwy Hewlett, NY | 3.0 | 1.5 | 1205 | $4,200 | $3.49 | 26d | 1 | 1.20mi |
| 58 Cohill Rd Unit 1F Valley Stream, NY | 3.0 | 1.0 | 1100 | $3,200 | $2.91 | 12d | 1 | 1.22mi |
| 2 Fowler Ave Unit 211 Lynbrook, NY | 3.0 | 2.0 | 1300 | $3,750 | $2.88 | 26d | 1 | 1.28mi |
| 576 Scranton Ave Unit 576-4 Lynbrook, NY | 2.0 | 1.0 | 1212 | $3,750 | $3.09 | 46d | 1 | 1.44mi |
Listing history 21 events
-
2026-05-08status Pending
-
2026-04-15$899,000 Active
-
2025-08-27historical
-
2025-08-06price $959,900
-
2025-07-08price $969,000
-
2025-05-30price $979,900
-
2025-04-29price $988,888
-
2025-04-13$998,700 Active
-
2024-12-14status Pending
-
2024-11-15status Active
-
2024-11-14historical
-
2024-10-18status Pending
-
2024-09-16$999,000 Active
-
2024-09-06historical
-
2023-11-29soldstatus $800,000 Closed
-
2023-07-24soldstatus $800,000
-
2023-05-20status Pending
-
2023-04-25$824,900 Active
-
2005-11-03soldstatus $500,000
-
1999-06-07soldstatus $175,000
-
1978-04-01soldstatus $26,000
ⓘ Source: listings_history table (triggers on properties + properties_extension) + one-shot
backfill from property_details.listing_events for pre-trigger history.
Tax reassessment forecast NY · Partial reset (capped growth)
- Current annual tax
- $11,239 · $937/mo
- Projected year-2 tax
- $13,216 · $1,101/mo
- Expected delta
- +$1,977/yr (+$165/mo · 17.6%)
ⓘ Screening estimate from a state-policy table — verify with the county assessor before closing.
Climate risk First Street
- Flood 1/10 Low FEMA zone X (unshaded) · 0% chance over 30 yrs
- Wildfire 1/10 Low
- Heat 6/10 Major 7 d/yr ≥97°F today · 16 d/yr by 30 yrs out
- Wind 6/10 Major 70% chance of damaging wind over 30 yrs
- Air quality 3/10 Moderate 4 unhealthy d/yr today · 4 by 30 yrs out
Nearby sold comps map
Loading sold comps map…
Walkable amenities ~0.75 mi
Loading nearby amenities…
Taxation est. · year 1
- Rental income
- $87,156
- − Mortgage interest
- −$50,358
- − Property taxes
- −$11,239
- − Insurance
- −$4,495
- − Repairs & maintenance
- −$6,972
- − Management
- −$6,972
- − Depreciation
- −$26,153
- Taxable loss
- −$19,034
- Est. tax savings @ 24.0%
- +$4,568
- After-tax cash flow
- $1,114/yr
For passive investors: Depreciation is non-cash, so a rental often shows a tax loss while cash-flowing — sheltering income. Rental losses are passive: they offset passive income freely, and up to $25,000/yr can offset ordinary (W-2) income if you actively participate and your MAGI is under $100k (phasing out to $0 by $150k); unused losses carry forward. On sale, claimed depreciation is recaptured at up to 25%, and gains may owe capital-gains tax (a 1031 exchange can defer both). Figures are a year-1 estimate at your 24.0% rate — not tax advice; consult a CPA.
Schools (NCES district)
- District
- Valley Stream Central High School District
- NCES district ID
- 3629520
- Math proficiency
- 71% ▼ -7.00%
- Reading proficiency
- 76% ▬ 0.00%
- Median HH income
- $94,844
- Composite
- 66.54/100
- National rank
- #418
- State rank
- #78 of 590 in NY
Livability — Valley Stream
- Score
- 87/100
- State rank
- #13
- US rank
- #301
Category grades
Schools grade is shown separately in the Schools card above.
Census & demographics
- Census place
- Valley Stream, NY
- County
- Nassau County · 653,051 people
- City population
- 65,910
- Metro
- New York-Newark-Jersey City, NY-NJ-PA
- Population (ZIP)
- 22,818
- Household income
- $142,233
- Rent vs Own
- Severe rent burden
- 346.0
Population outlook (Nassau County) Hauer SSP2
- Today (2025)
- 1,409,302 people
- By 2030
- 1,431,482 · +1.6%
- By 2040
- 1,471,607 · +4.4%
- By 2050
- 1,502,845 · +6.6%
- By 2075
- 1,575,403 · +11.8%
- By 2100
- 1,554,356 · +10.3%
Race, ethnicity, and origin ACS 2023
- Neighborhood character
- Highly diverse neighborhood (Simpson 0.75)
- Race & ethnicity
- White 39% Hispanic / Latino 19% Black 18% Asian 17% Two or more races 10%
- Hispanic origin (detail)
- Puerto Rican 5% Dominican 2%
- Common ancestry
- Scotch-Irish 4% Romanian 3% Hispanic 2%
- Foreign-born
- 32% · Canada, China, Jamaica
- Languages at home
- 64% English-only · Spanish 13% Other Indo-European 8% Russian/Polish/Slavic 4%
Political lean MEDSL · Nassau
- 2024 margin
- Toss-up / Even · D 47.9% · R 52.1%
- 2008→2024 swing
- -12.6pp toward R · 2008: 8.4pp · 2024: -4.2pp
- All cycles
- 2024: R+4.2 2020: D+9.5 2016: D+5.3 2012: D+6.7 2008: D+8.4
Not yet ingested
- Civics
- —
Market trends
- HPI YoY
- ▼ -602.04%
- Current HPI
- 285.7096
- Rent YoY
- —
- Metro
- New York-Newark-Jersey City, NY-NJ-PA
- State GDP YoY
- ▲ 2.60%
- F500 in state
- 92
Industry mix (Fortune 500 HQ in NY)
| Industry | F500 HQs | Revenue |
|---|---|---|
| Financial Services | 10 | $950B |
|
||
| Consumer Goods | 9 | $162B |
|
||
| Insurance | 4 | $225B |
|
||
| Telecommunications | 2 | $144B |
|
||
| Pharmaceuticals | 2 | $112B |
|
||
| Media / Entertainment | 2 | $69B |
|
||
Price history
+3357.7% since first listed21 events — show timeline
- 2026-05-08 Pending — OneKey® MLS as Distributed by MLS Grid
- 2026-04-15 Listed $899,000 OneKey® MLS as Distributed by MLS Grid
- 2025-08-27 Listing Removed — OneKey® MLS as Distributed by MLS Grid
- 2025-08-06 Price Changed $959,900 OneKey® MLS as Distributed by MLS Grid
- 2025-07-08 Price Changed $969,000 OneKey® MLS as Distributed by MLS Grid
- 2025-05-30 Price Changed $979,900 OneKey® MLS as Distributed by MLS Grid
- 2025-04-29 Price Changed $988,888 OneKey® MLS as Distributed by MLS Grid
- 2025-04-13 Listed $998,700 OneKey® MLS as Distributed by MLS Grid
- 2024-12-14 Pending — OneKey® MLS as Distributed by MLS Grid
- 2024-11-15 Relisted — OneKey® MLS as Distributed by MLS Grid
- 2024-11-14 Listing Removed — OneKey® MLS as Distributed by MLS Grid
- 2024-10-18 Pending — OneKey® MLS as Distributed by MLS Grid
- 2024-09-16 Listed $999,000 OneKey® MLS as Distributed by MLS Grid
- 2024-09-06 Coming Soon — OneKey® MLS as Distributed by MLS Grid
- 2023-11-29 Sold (MLS) $800,000 OneKey® MLS as Distributed by MLS Grid
- 2023-07-24 Sold (Public Records) $800,000 Public Records
- 2023-05-20 Pending — OneKey® MLS as Distributed by MLS Grid
- 2023-04-25 Listed $824,900 OneKey® MLS as Distributed by MLS Grid
- 2005-11-03 Sold (Public Records) $500,000 Public Records
- 1999-06-07 Sold (Public Records) $175,000 Public Records
- 1978-04-01 Sold (Public Records) $26,000 Public Records
Property tax history
+2.8%/yrLatest (2024): $11,239 · +3.8% YoY. Source: county tax records.
Cash-flow waterfall
monthlySold comps — $/sqft
last 12 mo · ≤1 miLoading sold comps…