 🏷️ Likely Rental
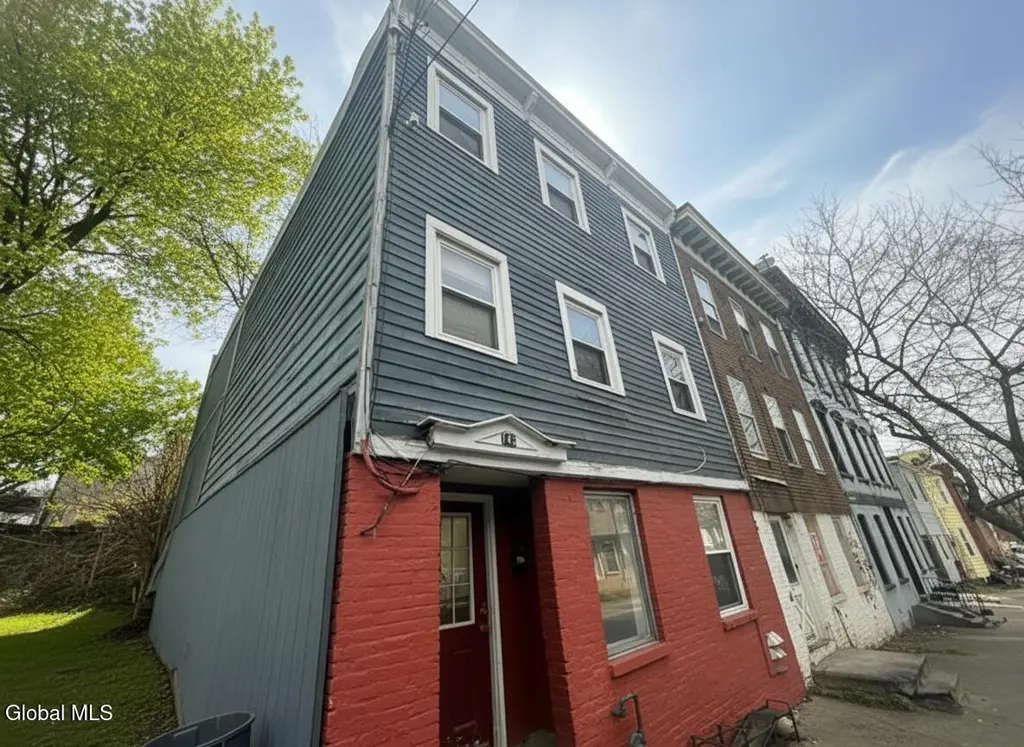
143 Clinton St · Albany, NY
Flood risk No data
- FEMA flood zone
- —
- Chance of flooding over 30 yrs
- —
- Est. flood insurance / yr
- —
Fire risk No data
- Est. fire insurance / yr
- —
Heat risk No data
- Hot days now (above threshold)
- —
- Hot days in 30 yrs
- —
Wind risk No data
- Chance of severe wind over 30 yrs
- —
Air-quality risk No data
- Unhealthy air days now
- —
- Unhealthy air days in 30 yrs
- —
Risk factors via First Street. Map © Google.
Why this score? — see what drove the A grade
The composite is a weighted blend of 9 inputs, each scored 0–100. Each bar is that input's sub-score; the figure is the points it added to the 100-point composite (weight × sub-score).
- Cash flow +30.0/30.0
- ARV discount +15.0/15.0
- 1% rule +10.0/10.0
- DSCR +10.0/10.0
- Appreciation +10.0/10.0
- Rent growth +4.7/5.0
- Livability +4.0/5.0
- Schools +3.2/10.0
- Condition / age +2.8/5.0
$179,900
🖨 Deal sheet 📄 Offer letter ✓ Due diligence
Multi-family units
County records classify this as Multi-Family (2-4 Unit). Listing-text estimate: 2 units. confirmed
Listing remarks MLS
Financing can be conventional residential for this building (does not have to be commercial). Fantastic upside potential in this well maintained 2 family property featuring long term tenants and an on site income producing laundry operation. The lower level includes four coin operated washers and four coin operated dryers, currently offered exclusively to the owner's tenants, including his tenants from his surrounding properties. The laundry fluctuates anywhere from $250-$500 per month in additional income. The two residential units currently rent for $850 and $900 per month, providing immediate cash flow with significant room for growth. Both units are spacious, offering large bedrooms, generous closet space, hardwood flooring, and ceramic tiled bathrooms. The property is located in an area undergoing active redevelopment, with nearby lots being developed into brand new 2- & 3-unit buildings. This presents a strong opportunity to capitalize on the ongoing revitalization of the neighborhood. Fair market rents in ZIP code 12202 is $1,420 per unit, making this an excellent value add investment.
Key facts
- 1,306 sq ft lot
- Built 1890
- Listed 94 days
Neighborhood map
What this means for you Summary
Snapshot
- This is a 2 × 2-bed/1.0-bath units multifamily listed at $180k. Condition is rated average.
Deal economics
- At list price, monthly cash flow is $1k ($14k/yr) — positive. Per door: $578/mo.
- The deal already cash-flows at list — no discount required.
- Meets the 1% rule at list price ($3k rent vs $180k).
- Recommended offer: $164k (9.0% below list) — sets the bar for market timing.
- Cap rate 14.0% vs local median 5.7% in Albany — top-decile yield for the area; either an underpriced asset or a hidden risk that comps aren't pricing in. Stress-test before assuming the spread holds.
Location & tenants
- Location reads 79/100 on livability (#129 in NY, #2,083 nationally) — a middle-class / working-renter tenant base. Strengths: amenities A+, commute A+, housing A+; Watch: employment C-, crime F.
- Albany City School District (urban): math 37% / reading 40% proficiency, ranked #543 of 590 in NY (top 92%) — families likely to look elsewhere, expect single-tenant / working-renter base with shorter leases; 66% free/reduced lunch — lower-income household profile, screen leases tightly.
- Market conditions: Rents rising fast (+8.7%/yr); 58 active listings in the ZIP; 15 comparable units currently listed for rent nearby; rentals at typical pace (median 22d on market — plan ~3-4 weeks tenant-placement turnaround); 675 units permitted in Albany County in 2024 (451 in 5+ unit buildings).
- At $3,153/mo this rent would consume 72% of the median local household income ($53k/yr) (locally 935% of renters already pay >50% of income on rent) — very limited rent-growth headroom before tenants either downsize or default.
Forward outlook
- In year one you build about $19k of equity ($1k loan paydown + $18k appreciation (10.0% local appreciation)).
- Albany County population projected at +9% by 2050 — modest demand growth; plan on rents tracking national, not racing it.
- At projected returns (10.0% appreciation + 8.0% rent growth), your $50k cash investment doubles in ~2 years — after that, you're playing with house money.
- By year 2, paydown + projected appreciation supports a ~$31k cash-out refi (75% LTV) — recoverable capital for the next deal without selling this one.
Negotiation context
- It's been on market 94 days — a 9% lower offer ($164k) is reasonable based on typical stale-listing flexibility.
Risks & watch-outs
- Watch-outs: built in 1890 — expect roof / HVAC / electrical / plumbing capex.
Questions for the listing agent
- It's been on market 94 days. Have you received any prior offers? Is the seller open to a 9% concession, seller financing, or rate buy-down credit?
- Can we see the unit-by-unit rent roll, current vacancy, and any below-market leases? What's the average tenancy length?
- What capital expenditures (roof, boiler, parking lot, exteriors) have been made in the last 5 years, and what's planned in the next 2?
- Built in 1890 — when were the roof, HVAC, electrical panel, plumbing, and water heater last replaced?
- Why hasn't it sold? Are there any deal-killer items the seller is aware of (foundation, flood, title, zoning, code violations)?
- Is there a deadline driving the sale (1031 exchange, divorce, estate, relocation)? That informs how much negotiation room exists.
- Crime grade is F in this area — have there been break-ins, vandalism, or insurance claims at this property in the last 3 years? What carrier currently insures it and at what premium?
- What's the average days-on-market for RENTAL listings here right now (not sales)? A rising rental-DOM trend means longer vacancies and softer asking-rent achievability than the comps imply.
- What's the recent tenant-quality profile in this submarket — average credit score on applications, eviction rate, late-payment / NSF rate, and stable-employment percentage? A property-management company in the area should have these aggregated.
- How much new apartment / multifamily construction is in the pipeline within 1–3 miles? Heavy new supply (>2% of stock underway) typically softens rents 12–24 months out; light construction supports rent growth.
Investment metrics
- 1% rule
- 1.75% ✓
- Cap rate
- 14.00%
- Cash-on-cash
- 27.54%
- DSCR
- 2.23
- GRM
- 4.8
CMA / ARV
- ARV (median comp)
- $305,230
- List price
- $179,900
- Delta
- -41.06%
- Verdict
- UNDERPRICED
- Comps
- 20 within 1.0 mi
Show comp detail 7 sales within ~0.75 mi
| Address | Dist | Beds/Ba | Sqft | Sold | Price | $/sf | Match |
|---|---|---|---|---|---|---|---|
| 31 3rd Ave | 0.09mi | 4/2.0 (+1) | 1,800 (-5%) | 1mo | $155,000 | $86 | 81 |
| 126 4th Ave | 0.12mi | 3/3.0 | 1,782 (-6%) | 3mo | $210,000 | $118 | 78 |
| 101 3rd Ave | 0.21mi | 4/3.0 (+1) | 1,750 (-8%) | 3mo | $180,000 | $103 | 66 |
| 21-23 Liebel St | 0.26mi | 4/2.0 (+1) | 1,800 (-5%) | 10mo | $220,000 | $122 | 66 |
| 248 Catherine St | 0.68mi | 4/2.0 (+1) | 1,816 (-4%) | 3mo | $185,000 | $102 | 53 |
| 233 S Swan St | 0.52mi | 4/2.0 (+1) | 2,015 (+6%) | 16mo | $225,000 | $112 | 47 |
| 59 Philip St | 0.57mi | 4/3.0 (+1) | 2,178 (+14%) | 20mo | $272,000 | $125 | 24 |
Match score weights: distance 35% · size 25% · config 20% · recency 20%. Top-matched comps best support the ARV.
Projected returns pro-forma
10.0% appreciation · 8.0% rent growth · sell at horizon
- IRR
- 48.3%
- Equity multiple
- 4.74×
- Total profit
- $188,374
- Equity at exit
- $162,068
- IRR
- 44.2%
- Equity multiple
- 11.69×
- Total profit
- $538,315
- Equity at exit
- $349,506
Cash invested: $50,372 (down + closing). Projections, not guarantees.
Landlord ↔ Tenant lean methodology
- Overall (STATE)
- 15 Strongly Tenant-Friendly
- State New York
- 15 Strongly Tenant-Friendly · D+10
- County
- — inherits STATE
- City
- — inherits STATE
ZIP-level market 12202
- Home prices YoY
- 14.3%
- Rents YoY
- 8.7%
- Active inventory
- 58
- Price-to-rent
- 9.5×
Monthly cashflow live
- Estimated rent
- $3,153 high interval (Pro) →
- Mortgage (P&I)
- −$943
- Tax from tax record
- −$316 /mo · $3,798/yr
- Insurance
- −$75
- HOA
- −$0
- Vacancy / Maint / Mgmt
- −$662
- Net cashflow
- $1,156
Break-even live
2-unit breakdown (identical units grouped — click to expand)
| Units | Beds | Baths | Est. rent |
|---|---|---|---|
| 2× units | 2 | 1 | $3,154 |
| #1 | 2 | 1 | $1,577 |
| #2 | 2 | 1 | $1,577 |
| Total (2 units) | $3,153 | ||
UW: 25.0% down · 7.5% · 30yr · 1.5% tax · 5.0% vac · 8.0% maint · 8.0% mgmt
Financing live
Cash to close
- Down payment
- $44,975
- Closing costs
- $5,397
- Reserves months
- —
- Total cash needed
- —
Loan-product check · same deal, 3 products live
Conventional
25% down · 7.5% · 30yr
- Down + closing
- —
- Monthly P&I
- —
- Monthly cashflow
- —
- DSCR
- —
- Eligible?
- —
Personal DTI + credit; lowest rate.
DSCR
20% down · 8.5% · 30yr
- Down + closing
- —
- Monthly P&I
- —
- Monthly cashflow
- —
- DSCR
- —
- Eligible?
- —
No personal income docs; deal must DSCR.
Hard money
10% down · 12.0% · 12mo
- Down + closing
- —
- Monthly P&I
- —
- Monthly cashflow
- —
- DSCR
- —
- Eligible?
- —
Short-term bridge; refi at stabilization.
Rent comps 15 comps
| Address | Beds | Baths | Sqft | Rent | $/sqft | DOM | Units | Dist |
|---|---|---|---|---|---|---|---|---|
| 119 Grand St Albany, NY | 3.0 | 1.0 | 1600 | $1,300 | $0.81 | 44d | 1 | 0.48mi |
| 201 Park Ave Unit 10 Albany, NY | 3.0 | 2.0 | 1600 | $2,100 | $1.31 | 44d | 1 | 0.75mi |
| 346 Madison Ave Albany, NY | 3.0 | 2.0 | 1500 | $2,495 | $1.66 | 23d | 1 | 0.88mi |
| 99 New Broadway Rensselaer, NY | 2.0 | 1.0–2.0 | 946 | $2,495 | $2.64 | 14d | 5 | 1.02mi |
| 48 N Pearl St Albany, NY | 2.0 | 1.0–2.5 | 1251 | $3,500 | $2.80 | 14d | 17 | 1.04mi |
| 15 Stanwix St Albany, NY | 4.0 | 1.5 | 1660 | $2,500 | $1.51 | 14d | 1 | 1.05mi |
| 154 Lancaster St Unit 1 Albany, NY | 2.0 | 1.5 | 1500 | $2,200 | $1.47 | 23d | 1 | 1.06mi |
| 100 New Broadway Rensselaer, NY | 2.0 | 2.0 | 1248 | $2,212 | $1.77 | 14d | 2 | 1.09mi |
| 41 Dove St Albany, NY | 2.0 | 2.5 | 2400 | $2,350 | $0.98 | 14d | 1 | 1.13mi |
| 88 Willett St Albany, NY | 3.0 | 1.0 | 825 | $2,080 | $2.52 | 14d | 10 | 1.13mi |
| 227 Jay St Albany, NY | 2.0 | 2.0 | 1710 | $2,150 | $1.26 | 44d | 1 | 1.15mi |
| 15 Ten Broeck St Albany, NY | 2.0 | 1.5 | 1900 | $1,750 | $0.92 | 21d | 1 | 1.32mi |
| 25 Harrison Ave Rensselaer, NY | 2.0 | 1.0 | 1400 | $1,745 | $1.25 | 19d | 1 | 1.34mi |
| 240 Washington Ave Albany, NY | 2.0 | 2.0 | 1560 | $2,450 | $1.57 | 44d | 1 | 1.35mi |
| 32 1st St Albany, NY | 4.0 | 1.5 | 1773 | $1,850 | $1.04 | 44d | 1 | 1.36mi |
Listing history 6 events
-
2026-06-02status $179,900 Pending 94 DOM
-
2026-06-01days on market $179,900 Active 94 DOM
-
2026-05-31days on market $179,900 Active 93 DOM
-
2026-05-31days on market $179,900 Active 92 DOM
-
2026-04-24price $179,900 1116-char remark
Show marketing remark (1116 chars)
Financing can be conventional residential for this building (does not have to be commercial). Fantastic upside potential in this well maintained 2 family property featuring long term tenants and an on site income producing laundry operation. The lower level includes four coin operated washers and four coin operated dryers, currently offered exclusively to the owner's tenants, including his tenants from his surrounding properties. The laundry fluctuates anywhere from $250-$500 per month in additional income. The two residential units currently rent for $850 and $900 per month, providing immediate cash flow with significant room for growth. Both units are spacious, offering large bedrooms, generous closet space, hardwood flooring, and ceramic tiled bathrooms. The property is located in an area undergoing active redevelopment, with nearby lots being developed into brand new 2- & 3-unit buildings. This presents a strong opportunity to capitalize on the ongoing revitalization of the neighborhood. Fair market rents in ZIP code 12202 is $1,420 per unit, making this an excellent value add investment.
-
2026-02-27$189,900 Active 1116-char remark
Show marketing remark (1116 chars)
Financing can be conventional residential for this building (does not have to be commercial). Fantastic upside potential in this well maintained 2 family property featuring long term tenants and an on site income producing laundry operation. The lower level includes four coin operated washers and four coin operated dryers, currently offered exclusively to the owner's tenants, including his tenants from his surrounding properties. The laundry fluctuates anywhere from $250-$500 per month in additional income. The two residential units currently rent for $850 and $900 per month, providing immediate cash flow with significant room for growth. Both units are spacious, offering large bedrooms, generous closet space, hardwood flooring, and ceramic tiled bathrooms. The property is located in an area undergoing active redevelopment, with nearby lots being developed into brand new 2- & 3-unit buildings. This presents a strong opportunity to capitalize on the ongoing revitalization of the neighborhood. Fair market rents in ZIP code 12202 is $1,420 per unit, making this an excellent value add investment.
ⓘ Source: listings_history table (triggers on properties + properties_extension) + one-shot
backfill from property_details.listing_events for pre-trigger history.
Tax reassessment forecast NY · Partial reset (capped growth)
- Current annual tax
- $3,798 · $316/mo
- Projected year-2 tax
- $3,798 · $316/mo
- Expected delta
- $0/yr ($0/mo · 0.0%)
ⓘ Screening estimate from a state-policy table — verify with the county assessor before closing.
Nearby sold comps map
Loading sold comps map…
Walkable amenities ~0.75 mi
Loading nearby amenities…
Taxation est. · year 1
- Rental income
- $37,836
- − Mortgage interest
- −$10,077
- − Property taxes
- −$3,798
- − Insurance
- −$900
- − Repairs & maintenance
- −$3,027
- − Management
- −$3,027
- − Depreciation
- −$5,233
- Taxable income
- $11,775
- Est. tax owed @ 24.0%
- −$2,826
- After-tax cash flow
- $11,047/yr
For passive investors: Depreciation is non-cash, so a rental often shows a tax loss while cash-flowing — sheltering income. Rental losses are passive: they offset passive income freely, and up to $25,000/yr can offset ordinary (W-2) income if you actively participate and your MAGI is under $100k (phasing out to $0 by $150k); unused losses carry forward. On sale, claimed depreciation is recaptured at up to 25%, and gains may owe capital-gains tax (a 1031 exchange can defer both). Figures are a year-1 estimate at your 24.0% rate — not tax advice; consult a CPA.
Condition & rehab AI · 6 photos
This 2-family property has average condition with moderate rehab needs. Upgrades to the kitchen and exterior can significantly boost its value.
Repairs flagged
- Moderate kitchen cabinets — dated and in need of replacement
- Minor kitchen backsplash — tile in good condition
- Minor interior walls — paint needs touch-up
Value-add opportunities
- Both kitchen renovation — modernizing the kitchen can increase both resale and rental value
- Both exterior paint — fresh paint can improve curb appeal and property value
- Both landscaping — improved landscaping can enhance curb appeal and attract potential buyers
Renovation cost estimate screening
| Repair item | Severity | Est. cost |
|---|---|---|
| kitchen cabinets · dated and in need of replacement | Moderate | $3,000–15,000 |
| kitchen backsplash · tile in good condition | Minor | $500–3,000 |
| interior walls · paint needs touch-up | Minor | $500–3,000 |
| Total estimated repair cost · 3 items | $4,000–21,000 |
Value-add ROI direction
- Both kitchen renovation — modernizing the kitchen can increase both resale and rental value ↑
- Both exterior paint — fresh paint can improve curb appeal and property value ↑
- Both landscaping — improved landscaping can enhance curb appeal and attract potential buyers ↑
ⓘ Cost ranges are severity-bucket heuristics (US national rule-of-thumb). Get contractor quotes + a written scope before underwriting a rehab budget.
Schools (NCES district)
- District
- Albany City School District
- NCES district ID
- 3602460
- Math proficiency
- 37% ▲ 6.00%
- Reading proficiency
- 40% ▲ 7.00%
- Median HH income
- $40,568
- Composite
- 32.34/100
- National rank
- #5744
- State rank
- #543 of 590 in NY
Livability — Albany
- Score
- 79/100
- State rank
- #129
- US rank
- #2083
Category grades
Schools grade is shown separately in the Schools card above.
Census & demographics
- Census place
- Albany, NY
- County
- Albany County · 196,626 people
- City population
- 116,921
- Metro
- Albany-Schenectady-Troy, NY
- Population (ZIP)
- 10,166
- Household income
- $52,868
- Rent vs Own
- Severe rent burden
- 935.0
Population outlook (Albany County) Hauer SSP2
- Today (2025)
- 320,794 people
- By 2030
- 327,401 · +2.1%
- By 2040
- 338,218 · +5.4%
- By 2050
- 348,467 · +8.6%
- By 2075
- 381,693 · +19.0%
- By 2100
- 393,809 · +22.8%
Race, ethnicity, and origin ACS 2023
- Neighborhood character
- Highly diverse neighborhood (Simpson 0.73)
- Race & ethnicity
- Black 40% White 28% Hispanic / Latino 15% Two or more races 14% Asian 7%
- Hispanic origin (detail)
- Mexican 3% Puerto Rican 5% Dominican 5%
- Common ancestry
- Iranian 2% Romanian 1% Serbian 1%
- Foreign-born
- 14% · Canada, Philippines, China
- Languages at home
- 80% English-only · Spanish 10% Other Asian/Pacific 4% Arabic 1%
Political lean MEDSL · Albany
- 2024 margin
- Strong D (+25.8) · D 62.9% · R 37.1%
- 2008→2024 swing
- -3.6pp toward R · 2008: 29.4pp · 2024: 25.8pp
- All cycles
- 2024: D+25.8 2020: D+31.4 2016: D+24.3 2012: D+31.0 2008: D+29.4
Not yet ingested
- Civics
- —
Market trends
- HPI YoY
- ▲ 38.05%
- Current HPI
- 303.8939
- Rent YoY
- ▲ 8.70%
- Metro
- Albany-Schenectady-Troy, NY
- State GDP YoY
- ▲ 2.60%
- F500 in state
- 92
Industry mix (Fortune 500 HQ in NY)
| Industry | F500 HQs | Revenue |
|---|---|---|
| Financial Services | 10 | $950B |
|
||
| Consumer Goods | 9 | $162B |
|
||
| Insurance | 4 | $225B |
|
||
| Telecommunications | 2 | $144B |
|
||
| Pharmaceuticals | 2 | $112B |
|
||
| Media / Entertainment | 2 | $69B |
|
||
Price history
-5.3% since first listed2 events — show timeline
- 2026-04-24 Price Changed $179,900 Global MLS
- 2026-02-27 Listed $189,900 Global MLS
Cash-flow waterfall
monthlySold comps — $/sqft
last 12 mo · ≤1 miLoading sold comps…