 Duplex
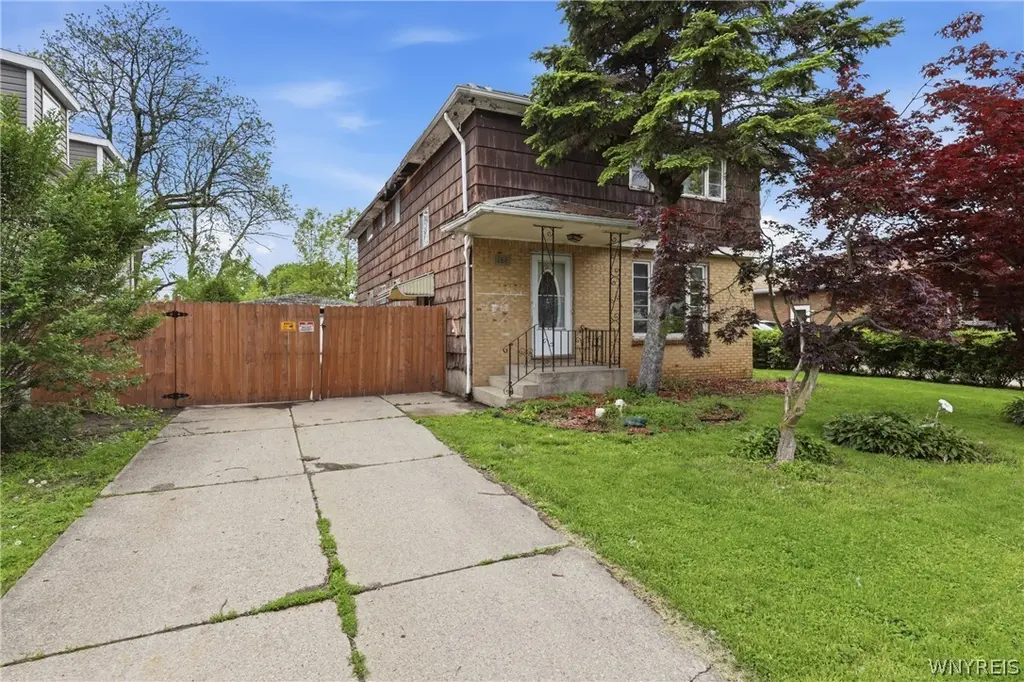
168 Hawthorne Ave · Tonawanda Town, NY
Flood risk 1/10 · Minimal
- FEMA flood zone
- X (unshaded)
- Chance of flooding over 30 yrs
- 0.0%
- Est. flood insurance / yr
- $473 – $860
Fire risk 1/10 · Minimal
- Est. fire insurance / yr
- $691 – $1,283
Heat risk 3/10 · Minor
- Hot days now (above 92°F)
- 7 days/yr
- Hot days in 30 yrs
- 15 days/yr
Wind risk 1/10 · Minimal
- Chance of severe wind over 30 yrs
- —
Air-quality risk 3/10 · Minor
- Unhealthy air days now
- 2 days/yr
- Unhealthy air days in 30 yrs
- 3 days/yr
Risk factors via First Street. Map © Google.
Why this score? — see what drove the B- grade
The composite is a weighted blend of 9 inputs, each scored 0–100. Each bar is that input's sub-score; the figure is the points it added to the 100-point composite (weight × sub-score).
- Cash flow +30.0/30.0
- 1% rule +10.0/10.0
- DSCR +10.0/10.0
- ARV discount +7.5/15.0
- Schools +3.9/10.0
- Rent growth +2.5/5.0
- Livability +2.5/5.0
- Condition / age +2.5/5.0
- Appreciation +0.0/10.0
$139,900
🖨 Deal sheet (PDF) 📄 Offer letter ✓ Due diligence
Multi-family units
County records classify this as Multi-Family (2-4 Unit). Listing-text estimate: 2 units. confirmed
Listing remarks
Opportunity awaits at 168 Hawthorne! This 2-unit property is in need of a complete rehab and is ready for your vision. Ideal for investors, contractors, or anyone looking to restore and add value. Great potential for rental income or owner-occupant use once renovated. Conveniently located near local amenities and major routes. Bring your ideas and unlock the possibilities!
Key facts
- 7,405 sq ft lot
- 2 garage spots
- Built 1956
Property features AI
Finance
- Other: Assessed value provided
- Financial info: Multifamily (2 total units); 2 separate gas meters; 2 separate electric meters; Operating expenses: see remarks; Owner pays: see remarks; Rent includes: see remarks
Exterior
- Parking: Garage with approximately 2.5 spaces; Concrete parking surfaces
- Utilities: Public water connected; Sewer connected
- Home design: 2-story property; Resale condition
- Construction: Asphalt roof; Poured foundation; Construction details: see remarks; Existing structure (year built: existing)
- Exterior features: Rectangular lot (59 x 122)
Interior
- Bathrooms: 2 full bathrooms
- Heating & cooling: Gas forced-air heating
- Interior features: Other features (see remarks); Full basement
- Laundry & utility: Gas water heater
Neighborhood map
What this means for you Summary
Snapshot
- This is a 2 × 3-bed/1.0-bath units multifamily listed at $140k.
Deal economics
- At list price, monthly cash flow is $2k ($20k/yr) — positive. Per door: $834/mo.
- The deal already cash-flows at list — no discount required.
- Meets the 1% rule at list price ($3k rent vs $140k).
- Cap rate 20.6% vs local median 4.1% in Tonawanda Town — top-decile yield for the area; either an underpriced asset or a hidden risk that comps aren't pricing in. Stress-test before assuming the spread holds.
Location & tenants
- Location reads: area grade B — affects rentability + tenant quality, not the cash-flow math above.
- Kenmore-Tonawanda Union Free School District (suburban): math 44% / reading 47% proficiency, ranked #453 of 590 in NY (top 77%) — families likely to look elsewhere, expect single-tenant / working-renter base with shorter leases.
- Zoned schools: Ben Franklin Elementary School (math 27% / reading 47%, grade F, #1,519 of 2,108 statewide, top 74%, 459 students, 58% FRL); Ben Franklin Middle School (math 26% / reading 37%, grade F, #522 of 729 statewide, top 73%, 626 students, 47% FRL); Kenmore East Senior High School (math 73% / reading 47%, grade C+, #850 of 1,100 statewide, top 77%, 1,127 students, 48% FRL) — zoned schools average 51% FRL vs 33% district-wide (17 pts higher); higher-poverty schools than district average — tighter screening recommended.
- Market conditions: 122 active listings in the ZIP; 11 comparable units currently listed for rent nearby; rentals at typical pace (median 17d on market — plan ~3-4 weeks tenant-placement turnaround); solid renter incomes; 1,244 units permitted in Erie County in 2024 (563 in 5+ unit buildings).
- At $3,335/mo this rent would consume 48% of the median local household income ($84k/yr) (locally 368% of renters already pay >50% of income on rent) — very limited rent-growth headroom before tenants either downsize or default.
Forward outlook
- Local home prices are declining (-3.0%/yr); year-one equity from $967 of loan paydown is wiped out by about $4k of value loss. Plan a longer hold.
- At projected returns (-3.0% appreciation + 3.0% rent growth), your $39k cash investment doubles in ~3 years — after that, you're playing with house money.
Negotiation context
- Only 5 days on market — expect competitive offers; lowballing is unlikely to land.
Risks & watch-outs
- Watch-outs: built in 1956 — expect roof / HVAC / electrical / plumbing capex.
Questions for the listing agent
- Can we see the unit-by-unit rent roll, current vacancy, and any below-market leases? What's the average tenancy length?
- What capital expenditures (roof, boiler, parking lot, exteriors) have been made in the last 5 years, and what's planned in the next 2?
- Built in 1956 — when were the roof, HVAC, electrical panel, plumbing, and water heater last replaced?
- Is there a deadline driving the sale (1031 exchange, divorce, estate, relocation)? That informs how much negotiation room exists.
- What's the average days-on-market for RENTAL listings here right now (not sales)? A rising rental-DOM trend means longer vacancies and softer asking-rent achievability than the comps imply.
- What's the recent tenant-quality profile in this submarket — average credit score on applications, eviction rate, late-payment / NSF rate, and stable-employment percentage? A property-management company in the area should have these aggregated.
- How much new apartment / multifamily construction is in the pipeline within 1–3 miles? Heavy new supply (>2% of stock underway) typically softens rents 12–24 months out; light construction supports rent growth.
Investment metrics
- 1% rule
- 2.38% ✓
- Cap rate
- 20.60%
- Cash-on-cash
- 51.09%
- DSCR
- 3.27
- GRM
- 3.5
CMA / ARV
- ARV (on-the-fly)
- $311,328
- Comps found
- 8
Show comp detail 8 sales within ~0.75 mi
| Address | Dist | Beds/Ba | Sqft | Sold | Price | $/sf | Match |
|---|---|---|---|---|---|---|---|
| 20 Hawthorne Ave | 0.28mi | 6/2.0 | 2,208 (0%) | 11mo | $312,000 | $141 | 78 |
| 300 Windermere Blvd | 0.36mi | 6/2.0 | 2,325 (+5%) | 2mo | $355,000 | $153 | 73 |
| 150 Englewood Ave | 0.56mi | 6/2.0 | 2,239 (+1%) | 6mo | $338,000 | $151 | 67 |
| 345 Niagara Falls Blvd | 0.16mi | 6/2.0 | 1,893 (-14%) | 19mo | $255,000 | $135 | 53 |
| 157 Springville Ave | 0.53mi | 5/2.0 (-1) | 2,292 (+4%) | 13mo | $300,000 | $131 | 53 |
| 235 Heath St | 0.61mi | 6/2.0 | 2,058 (-7%) | 10mo | $303,000 | $147 | 52 |
| 1 Emsworth Ave | 0.22mi | 5/3.0 (-1) | 2,482 (+12%) | 17mo | $250,000 | $101 | 46 |
| 116 Nicholson St | 0.62mi | 6/2.0 | 2,464 (+12%) | 13mo | $151,000 | $61 | 41 |
Match score weights: distance 35% · size 25% · config 20% · recency 20%. Top-matched comps best support the ARV.
Projected returns pro-forma
-3.0% appreciation · 3.0% rent growth · sell at horizon
- IRR
- 48.9%
- Equity multiple
- 3.13×
- Total profit
- $83,606
- Equity at exit
- $20,860
- IRR
- 54.5%
- Equity multiple
- 6.36×
- Total profit
- $209,789
- Equity at exit
- $12,096
Cash invested: $39,172 (down + closing). Projections, not guarantees.
Landlord ↔ Tenant lean methodology
- Overall (STATE)
- 15 Strongly Tenant-Friendly
- State New York
- 15 Strongly Tenant-Friendly · D+10
- County
- — inherits STATE
- City
- — inherits STATE
ZIP-level market 14223
- Active inventory
- 122
- Price-to-rent
- 7.0×
Monthly cashflow live
- Estimated rent
- $3,335 high interval (Pro) →
- Mortgage (P&I)
- −$734
- Tax est. 1.5%
- −$175 /mo · $2,098/yr
- Insurance
- −$58
- HOA
- −$0
- Vacancy / Maint / Mgmt
- −$700
- Net cashflow
- $1,668
Break-even live
Sensitivity live
| Price | -10% $1,765 | -5% $1,716 | +0% $1,668 | +5% $1,619 | +10% $1,571 |
|---|---|---|---|---|---|
| Rent | -10% $1,404 | -5% $1,536 | +0% $1,668 | +5% $1,800 | +10% $1,931 |
| Rate | -1.0pp $1,738 | -0.5pp $1,703 | base $1,668 | +0.5pp $1,632 | +1.0pp $1,595 |
2-unit breakdown (identical units grouped — click to expand)
| Units | Beds | Baths | Est. rent |
|---|---|---|---|
| 2× units | 3 | 1 | $3,336 |
| #1 | 3 | 1 | $1,668 |
| #2 | 3 | 1 | $1,668 |
| Total (2 units) | $3,335 | ||
UW: 25.0% down · 7.5% · 30yr · 1.5% tax · 5.0% vac · 8.0% maint · 8.0% mgmt
Financing live
Cash to close
- Down payment
- $34,975
- Closing costs
- $4,197
- Reserves months
- —
- Total cash needed
- —
Loan-product check · same deal, 3 products live
Conventional
25% down · 7.5% · 30yr
- Down + closing
- —
- Monthly P&I
- —
- Monthly cashflow
- —
- DSCR
- —
- Eligible?
- —
Personal DTI + credit; lowest rate.
DSCR
20% down · 8.5% · 30yr
- Down + closing
- —
- Monthly P&I
- —
- Monthly cashflow
- —
- DSCR
- —
- Eligible?
- —
No personal income docs; deal must DSCR.
Hard money
10% down · 12.0% · 12mo
- Down + closing
- —
- Monthly P&I
- —
- Monthly cashflow
- —
- DSCR
- —
- Eligible?
- —
Short-term bridge; refi at stabilization.
Rent comps 11 comps
| Address | Beds | Baths | Sqft | Rent | $/sqft | DOM | Units | Dist |
|---|---|---|---|---|---|---|---|---|
| 80 Capen Blvd Buffalo, NY | 5.0 | 2.5 | 2591 | $2,800 | $1.08 | 3d | 1 | 0.39mi |
| 64 Montrose Ave Buffalo, NY | 7.0 | 1.5 | 1512 | $2,700 | $1.79 | 45d | 1 | 0.51mi |
| 64 Montrose Ave Buffalo, NY | 7.0 | 1.5 | 1512 | $2,500 | $1.65 | 3d | 1 | 0.51mi |
| 196 Englewood Ave Buffalo, NY | 5.0 | 1.5 | 2560 | $2,000 | $0.78 | 3d | 1 | 0.54mi |
| 133 Merrimac St Buffalo, NY | 7.0 | 2.0 | 2327 | $4,450 | $1.91 | 16d | 1 | 0.65mi |
| 4098 Bailey Ave Buffalo, NY | 5.0 | 2.5 | 2108 | $2,200 | $1.04 | 45d | 1 | 0.65mi |
| 24 Custer St Buffalo, NY | 5.0 | 2.0 | 2500 | $3,000 | $1.20 | 16d | 1 | 0.91mi |
| 65 Northrup Pl Buffalo, NY | 5.0 | 2.0 | 1467 | $2,500 | $1.70 | 16d | 1 | 0.92mi |
| 85 Highgate Ave Buffalo, NY | 5.0 | 2.0 | 2193 | $3,750 | $1.71 | 16d | 1 | 0.99mi |
| 175 Lisbon Ave Buffalo, NY | 5.0 | 2.0 | 2000 | $2,500 | $1.25 | 16d | 1 | 1.09mi |
| 145 Minnesota Ave Buffalo, NY | 7.0 | 2.0 | 2551 | $4,900 | $1.92 | 16d | 1 | 1.14mi |
Listing history 3 events
-
2026-06-01statusdays on market $139,900 Pending 5 DOM
-
2026-05-31days on market $139,900 Active 4 DOM
-
2026-05-27$139,900 Active
ⓘ Source: listings_history table (triggers on properties + properties_extension) + one-shot
backfill from property_details.listing_events for pre-trigger history.
Climate risk First Street
- Flood 1/10 Low FEMA zone X (unshaded) · 0% chance over 30 yrs
- Wildfire 1/10 Low
- Heat 3/10 Moderate 7 d/yr ≥92°F today · 15 d/yr by 30 yrs out
- Wind 1/10 Low
- Air quality 3/10 Moderate 2 unhealthy d/yr today · 3 by 30 yrs out
Nearby sold comps map
Loading sold comps map…
Walkable amenities ~0.75 mi
Loading nearby amenities…
Taxation est. · year 1
- Rental income
- $40,020
- − Mortgage interest
- −$7,837
- − Property taxes
- −$2,098
- − Insurance
- −$700
- − Repairs & maintenance
- −$3,202
- − Management
- −$3,202
- − Depreciation
- −$4,070
- Taxable income
- $18,912
- Est. tax owed @ 24.0%
- −$4,539
- After-tax cash flow
- $15,475/yr
For passive investors: Depreciation is non-cash, so a rental often shows a tax loss while cash-flowing — sheltering income. Rental losses are passive: they offset passive income freely, and up to $25,000/yr can offset ordinary (W-2) income if you actively participate and your MAGI is under $100k (phasing out to $0 by $150k); unused losses carry forward. On sale, claimed depreciation is recaptured at up to 25%, and gains may owe capital-gains tax (a 1031 exchange can defer both). Figures are a year-1 estimate at your 24.0% rate — not tax advice; consult a CPA.
Schools (NCES district)
- District
- Kenmore-Tonawanda Union Free School District
- NCES district ID
- 3616230
- Math proficiency
- 44% ▼ -12.00%
- Reading proficiency
- 47% ▼ -1.00%
- Median HH income
- $51,433
- Composite
- 39.18/100
- National rank
- #4024
- State rank
- #453 of 590 in NY
Livability — Tonawanda Town
No livability data for this city. (Only ~50 U.S. cities are tracked.)
Census & demographics
- Census place
- Tonawanda Town, NY
- County
- Erie County · 714,559 people
- City population
- 63,948
- Metro
- Buffalo-Cheektowaga, NY
- Population (ZIP)
- 22,611
- Household income
- $84,161
- Rent vs Own
- Severe rent burden
- 368.0
Population outlook (Erie County) Hauer SSP2
- Today (2025)
- 933,037 people
- By 2030
- 935,181 · +0.2%
- By 2040
- 928,531 · -0.5%
- By 2050
- 905,725 · -2.9%
- By 2075
- 834,037 · -10.6%
- By 2100
- 708,033 · -24.1%
Race, ethnicity, and origin ACS 2023
- Neighborhood character
- Predominantly White (84%)
- Race & ethnicity
- White 84% Asian 5% Two or more races 4% Black 4% Hispanic / Latino 3%
- Common ancestry
- Romanian 12% Slovak 2% Lithuanian 2%
- Foreign-born
- 7% · Canada, Vietnam, India
- Languages at home
- 92% English-only · Other Indo-European 3% French/Haitian/Cajun 1% Arabic 1%
Political lean MEDSL · Erie
- 2024 margin
- Lean D (+9.7) · D 54.8% · R 45.2%
- 2008→2024 swing
- -7.9pp toward R · 2008: 17.5pp · 2024: 9.7pp
- All cycles
- 2024: D+9.7 2020: D+14.7 2016: D+4.8 2012: D+15.6 2008: D+17.5
Not yet ingested
- Civics
- —
Market trends
- HPI YoY
- ▼ -245.18%
- Current HPI
- 320.9379
- Rent YoY
- —
- Metro
- Buffalo-Cheektowaga, NY
- State GDP YoY
- ▲ 2.60%
- F500 in state
- 92
Industry mix (Fortune 500 HQ in NY)
| Industry | F500 HQs | Revenue |
|---|---|---|
| Financial Services | 10 | $950B |
|
||
| Consumer Goods | 9 | $162B |
|
||
| Insurance | 4 | $225B |
|
||
| Telecommunications | 2 | $144B |
|
||
| Pharmaceuticals | 2 | $112B |
|
||
| Media / Entertainment | 2 | $69B |
|
||
Price history
1 event — show timeline
- 2026-05-27 Listed $139,900 WNYREIS
Property tax history
+8.6%/yrLatest (2025): $8,105 · +3.6% YoY. Source: county tax records.
Cash-flow waterfall
monthlySold comps — $/sqft
last 12 mo · ≤1 miLoading sold comps…