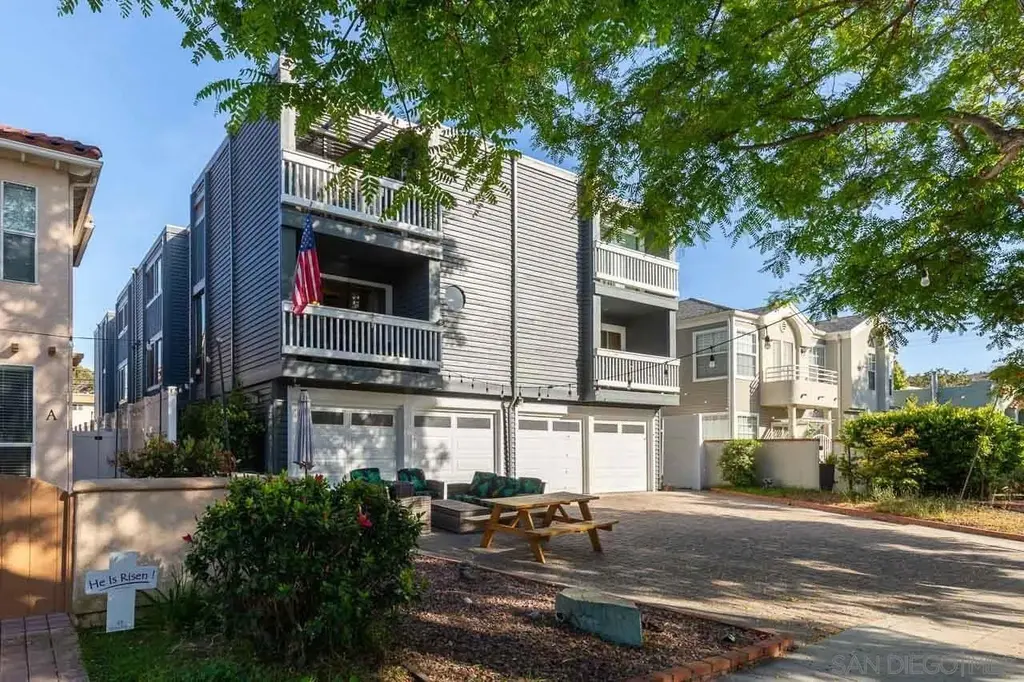
449 G · Coronado, CA
Flood risk 1/10 · Minimal
- FEMA flood zone
- X (unshaded)
- Chance of flooding over 30 yrs
- 0.0%
- Est. flood insurance / yr
- $507 – $1,088
Fire risk 1/10 · Minimal
- Est. fire insurance / yr
- $659 – $1,223
Heat risk 4/10 · Minor
- Hot days now (above 84°F)
- 7 days/yr
- Hot days in 30 yrs
- 19 days/yr
Wind risk 1/10 · Minimal
- Chance of severe wind over 30 yrs
- —
Air-quality risk 4/10 · Minor
- Unhealthy air days now
- 4 days/yr
- Unhealthy air days in 30 yrs
- 4 days/yr
Risk factors via First Street. Map © Google.
Why this score? — see what drove the D grade
The composite is a weighted blend of 9 inputs, each scored 0–100. Each bar is that input's sub-score; the figure is the points it added to the 100-point composite (weight × sub-score).
- ARV discount +15.0/15.0
- Schools +6.2/10.0
- Appreciation +5.7/10.0
- Cash flow +3.8/30.0
- Rent growth +3.6/5.0
- Livability +3.5/5.0
- Condition / age +2.5/5.0
- 1% rule +0.0/10.0
- DSCR +0.0/10.0
$1,750,000
🖨 Deal sheet 📄 Offer letter ✓ Due diligence
Listing remarks MLS
Prime Coronado Village townhome! Spacious and light-filled, this three-story home offers an ideal layout with a large kitchen, open dining area, and inviting family room—perfect for everyday living and entertaining. Multiple outdoor spaces create seamless indoor-outdoor flow and provide room to relax or host. All three bedrooms are generously sized with en-suite baths, offering comfort and privacy. The attached private two-car garage adds convenience and extra storage. Located in the heart of the Village, just moments from top-rated schools, shops, dining, and the beach—this is an exceptional opportunity to enjoy the best of Coronado living. LOW HOA at $375.
Key facts
- Inviting family room
- Open dining area
- Large kitchen
Tags
Neighborhood map
What this means for you Summary
Snapshot
- This is a 2-bed/3.0-bath townhouse listed at $1.75M.
Deal economics
- At list price, monthly cash flow is $-5k ($-61k/yr) — negative.
- To cash-flow at today's rent, offer at most $854k (51.2% below list).
- To meet the 1% rule (rent ≥ 1% of price), the offer needs to be $804k (54.0% below list).
- Recommended offer: $804k (54.0% below list) — sets the bar for 1% rule.
- Cap rate 2.8% vs local median 0.8% in Coronado — top-decile yield for the area; either an underpriced asset or a hidden risk that comps aren't pricing in. Stress-test before assuming the spread holds.
Location & tenants
- Location reads 69/100 on livability (#249 in CA) — a middle-class / working-renter tenant base. Strengths: schools A+, commute A+, employment A+; Watch: cost of living F, health & safety F.
- Coronado Unified (suburban): math 61% / reading 77% proficiency, ranked #47 of 517 in CA (top 9%) — acceptable for families but not a draw, mixed tenant base, ~2y average lease; only 5% free/reduced lunch — higher-income household profile.
- Market conditions: Rents rising fast (+4.4%/yr); 159 active listings in the ZIP; 40 comparable units currently listed for rent nearby; rentals lingering (median 44d on market — plan ~5-8 weeks vacancy on turnover, expect pricing pressure); 72% of comp listings sitting > 30 days — soft ceiling on asking rent; high-income renter base; 11,759 units permitted in San Diego County in 2024 (7,244 in 5+ unit buildings).
- At $8,042/mo this rent would consume 72% of the median local household income ($135k/yr) (locally 1052% of renters already pay >50% of income on rent) — very limited rent-growth headroom before tenants either downsize or default.
Forward outlook
- In year one you build about $37k of equity ($12k loan paydown + $25k appreciation (1.4% local appreciation)).
- San Diego County population projected at +20% by 2050 — long-run rental-demand tailwind backs the buy-and-hold thesis.
- By year 4, paydown + projected appreciation supports a ~$130k cash-out refi (75% LTV) — recoverable capital for the next deal without selling this one.
Negotiation context
- It's been on market 39 days — a 3% lower offer ($1.70M) is reasonable based on typical stale-listing flexibility.
- 5 sale attempts since 12y ago with the ask held roughly flat each time — persistent listings suggest the price (not the market) is what's stuck; bring a comps-based counter.
- Current owner paid $1.08M; list at $1.75M implies a 61% gain — meaningful room to come down on a strong offer.
Questions for the listing agent
- What do current leases actually rent for vs. the listed asking? Can we see a recent rent roll and the last 12 months of T-12 income?
- It's been on market 39 days. Have you received any prior offers? Is the seller open to a 54% concession, seller financing, or rate buy-down credit?
- What does the HOA fee cover, when was the last increase, and are there any pending special assessments or reserve-fund shortfalls?
- Is there a deadline driving the sale (1031 exchange, divorce, estate, relocation)? That informs how much negotiation room exists.
- Schools are A-rated — typically a magnet for longer-tenancy family renters. What's the average tenant stay here, and is there a school-zone premium baked into asking?
- The area grade is low — what's the realistic commute time and amenity access for the typical tenant pool here? Any planned neighborhood developments (good or bad) we should know about?
- What's the average days-on-market for RENTAL listings here right now (not sales)? A rising rental-DOM trend means longer vacancies and softer asking-rent achievability than the comps imply.
- What's the recent tenant-quality profile in this submarket — average credit score on applications, eviction rate, late-payment / NSF rate, and stable-employment percentage? A property-management company in the area should have these aggregated.
- How much new for-sale + rental construction is in the pipeline within 1–3 miles? Heavy new supply typically softens prices + rents 12–24 months out; constrained supply supports both.
Investment metrics
- 1% rule
- 0.46% ✗
- Cap rate
- 2.82%
- Cash-on-cash
- -12.42%
- DSCR
- 0.45
- GRM
- 18.1
CMA / ARV
- ARV (median comp)
- $2,414,524
- List price
- $1,750,000
- Delta
- -27.52%
- Verdict
- UNDERPRICED
- Comps
- 20 within 1.0 mi
Show comp detail 12 sales within ~0.75 mi
| Address | Dist | Beds/Ba | Sqft | Sold | Price | $/sf | Match |
|---|---|---|---|---|---|---|---|
| 1099 1st St #211 | 0.48mi | 2/2.5 | 2,234 (+4%) | 1mo | $2,925,000 | $1,309 | 68 |
| 1016 1st St | 0.45mi | 3/2.5 (+1) | 2,200 (+2%) | 8mo | $2,750,000 | $1,250 | 61 |
| 535 F Ave #4 | 0.12mi | 3/2.0 (+1) | 1,838 (-14%) | 3mo | $1,950,000 | $1,061 | 59 |
| 120 C Ave #208 | 0.49mi | 2/2.0 | 2,325 (+8%) | 2mo | $1,925,000 | $828 | 58 |
| 1004 10th St | 0.65mi | 3/3.0 (+1) | 2,050 (-5%) | 3mo | $3,850,000 | $1,878 | 54 |
| 120 C Ave #308 | 0.49mi | 2/2.0 | 2,325 (+8%) | 6mo | $2,425,000 | $1,043 | 54 |
| 1099 1st St #223 | 0.48mi | 2/2.5 | 1,884 (-12%) | 1mo | $1,775,000 | $942 | 54 |
| 120 C Ave #205 | 0.49mi | 2/2.0 | 1,850 (-14%) | 1mo | $1,860,000 | $1,005 | 49 |
| 1101 1st St #101 | 0.53mi | 2/2.5 | 1,849 (-14%) | 2mo | $1,850,000 | $1,001 | 48 |
| 1099 1st St #217 | 0.48mi | 2/2.5 | 1,841 (-14%) | 7mo | $1,600,000 | $869 | 46 |
| 120 C Ave #304 | 0.49mi | 2/2.0 | 1,850 (-14%) | 7mo | $1,885,000 | $1,019 | 44 |
| 1099 1st St #317 | 0.48mi | 2/2.0 | 1,841 (-14%) | 8mo | $1,900,000 | $1,032 | 44 |
Match score weights: distance 35% · size 25% · config 20% · recency 20%. Top-matched comps best support the ARV.
Projected returns pro-forma
1.41% appreciation · 4.44% rent growth · sell at horizon
- IRR
- -9.5%
- Equity multiple
- 0.50×
- Total profit
- $-243,331
- Equity at exit
- $635,068
- IRR
- -3.2%
- Equity multiple
- 0.58×
- Total profit
- $-206,043
- Equity at exit
- $873,865
Cash invested: $490,000 (down + closing). Projections, not guarantees.
Landlord ↔ Tenant lean methodology
- Overall (STATE)
- 18 Strongly Tenant-Friendly
- State California
- 18 Strongly Tenant-Friendly · D+13
- County
- — inherits STATE
- City
- — inherits STATE
ZIP-level market 92118
- Home prices YoY
- 0.4%
- Rents YoY
- 4.4%
- Active inventory
- 159
- Price-to-rent
- 18.1×
Monthly cashflow live
- Estimated rent
- $8,042 high interval (Pro) →
- Mortgage (P&I)
- −$9,177
- Tax from tax record
- −$1,143 /mo · $13,715/yr
- Insurance
- −$729
- HOA
- −$375
- Vacancy / Maint / Mgmt
- −$1,689
- Net cashflow
- $-5,071
Break-even live
UW: 25.0% down · 7.5% · 30yr · 1.5% tax · 5.0% vac · 8.0% maint · 8.0% mgmt
Financing live
Cash to close
- Down payment
- $437,500
- Closing costs
- $52,500
- Reserves months
- —
- Total cash needed
- —
Loan-product check · same deal, 3 products live
Conventional
25% down · 7.5% · 30yr
- Down + closing
- —
- Monthly P&I
- —
- Monthly cashflow
- —
- DSCR
- —
- Eligible?
- —
Personal DTI + credit; lowest rate.
DSCR
20% down · 8.5% · 30yr
- Down + closing
- —
- Monthly P&I
- —
- Monthly cashflow
- —
- DSCR
- —
- Eligible?
- —
No personal income docs; deal must DSCR.
Hard money
10% down · 12.0% · 12mo
- Down + closing
- —
- Monthly P&I
- —
- Monthly cashflow
- —
- DSCR
- —
- Eligible?
- —
Short-term bridge; refi at stabilization.
Rent comps 40 comps
| Address | Beds | Baths | Sqft | Rent | $/sqft | DOM | Units | Dist |
|---|---|---|---|---|---|---|---|---|
| 573 H Ave Coronado, CA | 3.0 | 3.0 | 1800 | $9,000 | $5.00 | 44d | 1 | 0.12mi |
| 625 4th St Coronado, CA | 3.0 | 2.0 | 1892 | $10,500 | $5.55 | 44d | 1 | 0.12mi |
| 569 E Ave Unit C Coronado, CA | 3.0 | 2.0 | 1923 | $7,449 | $3.87 | 14d | 1 | 0.18mi |
| 455 J Ave Coronado, CA | 3.0 | 3.0 | 1704 | $25,000 | $14.67 | 18d | 1 | 0.21mi |
| 664 I Ave Coronado, CA | 3.0 | 3.0 | 1600 | $7,500 | $4.69 | 5d | 1 | 0.27mi |
| 733 H Ave Coronado, CA | 3.0 | 2.5 | 2477 | $8,750 | $3.53 | 24d | 1 | 0.28mi |
| 748 Olive Ave Unit 748 Coronado, CA | 3.0 | 3.0 | 1500 | $6,000 | $4.00 | 44d | 1 | 0.32mi |
| 501 8th St Coronado, CA | 3.0 | 2.5 | 1702 | $20,000 | $11.75 | 44d | 1 | 0.35mi |
| 640 Alameda Blvd Coronado, CA | 3.0 | 2.0 | 1700 | $8,700 | $5.12 | 5d | 1 | 0.37mi |
| 741 D Ave Coronado, CA | 3.0 | 3.0 | 1402 | $7,500 | $5.35 | 44d | 1 | 0.37mi |
| 218 J Ave Coronado, CA | 3.0 | 2.5 | 2000 | $22,500 | $11.25 | 24d | 1 | 0.38mi |
| 540 Country Club Ln Coronado, CA | 3.0 | 3.0 | 2076 | $24,000 | $11.56 | 44d | 1 | 0.39mi |
| 610 Country Club Ln Coronado, CA | 3.0 | 2.5 | 2335 | $13,500 | $5.78 | 18d | 1 | 0.40mi |
| 229 Orange Ave #3 Coronado, CA | 2.0 | 2.0 | 1800 | $6,000 | $3.33 | 44d | 1 | 0.42mi |
| 828 D Ave Coronado, CA | 3.0 | 2.0 | 1805 | $6,500 | $3.60 | 44d | 1 | 0.42mi |
| 845 E Ave Unit Vacation or Long Term Rental Coronado, CA | 3.0 | 3.0 | 1444 | $6,500 | $4.50 | 18d | 1 | 0.43mi |
| 1210 7th St Coronado, CA | 3.0 | 3.0 | 1540 | $9,000 | $5.84 | 44d | 1 | 0.45mi |
| 911 E Ave #301 Coronado, CA | 3.0 | 2.5 | 2956 | $9,000 | $3.04 | 44d | 1 | 0.50mi |
| 937 F Ave Coronado, CA | 3.0 | 3.5 | 2400 | $25,000 | $10.42 | 44d | 1 | 0.51mi |
| 120 C Ave Coronado, CA | 2.0–3.0 | 2.0 | 2483 | $8,500 | $3.42 | 44d | 1 | 0.51mi |
| 120 C Ave Coronado, CA | 2.0–3.0 | 2.0 | 2246 | $8,000 | $3.56 | 15d | 2 | 0.51mi |
| 850 C Ave #4 Coronado, CA | 2.0 | 2.0 | 1410 | $5,500 | $3.90 | 44d | 1 | 0.53mi |
| 1099 1st St Coronado, CA | 2.0–4.0 | 2.5–4.0 | 3092 | $6,700 | $2.17 | 44d | 4 | 0.54mi |
| 942 D Ave Unit B Coronado, CA | 2.0 | 2.5 | 1529 | $6,000 | $3.92 | 44d | 1 | 0.54mi |
| 942 D Ave Unit A Coronado, CA | 3.0 | 2.5 | 2358 | $9,500 | $4.03 | 44d | 1 | 0.54mi |
| 1220 1st St #303 Coronado, CA | 3.0 | 3.0 | 2520 | $12,500 | $4.96 | 24d | 1 | 0.56mi |
| 1101 1st St #209 Coronado, CA | 2.0 | 2.5 | 1800 | $14,500 | $8.06 | 44d | 1 | 0.57mi |
| 1008 E Ave Coronado, CA | 3.0 | 2.0 | 1775 | $20,000 | $11.27 | 44d | 1 | 0.59mi |
| 837 B Ave Coronado, CA | 3.0 | 2.5 | 2380 | $9,900 | $4.16 | 44d | 1 | 0.60mi |
| 1033 Encino Row Coronado, CA | 3.0 | 2.5 | 1800 | $8,500 | $4.72 | 44d | 1 | 0.61mi |
| 1068 Isabella Ave Coronado, CA | 3.0 | 2.5 | 1532 | $5,500 | $3.59 | 44d | 1 | 0.65mi |
| 1415 1st St Coronado, CA | 2.0 | 3.0 | 1472 | $5,500 | $3.74 | 44d | 1 | 0.69mi |
| 901 A Ave Coronado, CA | 3.0 | 2.0 | 1778 | $6,500 | $3.66 | 44d | 1 | 0.70mi |
| 1104 Isabella Ave Coronado, CA | 2.0 | 2.0 | 1871 | $12,000 | $6.41 | 18d | 1 | 0.70mi |
| 958 A Ave Coronado, CA | 3.0 | 3.0 | 2200 | $7,000 | $3.18 | 44d | 1 | 0.71mi |
| 1524 Ynez Pl Coronado, CA | 2.0 | 2.0 | 1545 | $6,200 | $4.01 | 44d | 1 | 0.90mi |
| 1612 Cajon Pl Coronado, CA | 3.0 | 3.0 | 2732 | $12,000 | $4.39 | 44d | 1 | 0.92mi |
| 817 Margarita Ave Coronado, CA | 3.0 | 2.0 | 2000 | $9,000 | $4.50 | 44d | 1 | 0.98mi |
| 1710 Avenida del Mundo #803 Coronado, CA | 3.0 | 3.0 | 1603 | $30,000 | $18.71 | 44d | 1 | 1.15mi |
| 1730 Avenida Del Mundo Unit Vacation Rental Coronado, CA | 3.0 | 3.0 | 1668 | $12,000 | $7.19 | 44d | 1 | 1.23mi |
HOA detail
- Monthly dues
- $375 · $4,500/yr
Listing history 13 events
-
2026-04-17$1,800,000 Active 678-char remark
Show marketing remark (678 chars)
Prime Coronado Village townhome! Spacious and light-filled, this three-story home offers an ideal layout with a large kitchen, open dining area, and inviting family room—perfect for everyday living and entertaining. Multiple outdoor spaces create seamless indoor-outdoor flow and provide room to relax or host. All three bedrooms are generously sized with en-suite baths, offering comfort and privacy. The attached private two-car garage adds convenience and extra storage. Located in the heart of the Village, just moments from top-rated schools, shops, dining, and the beach—this is an exceptional opportunity to enjoy the best of Coronado living. LOW HOA at $375.
-
2022-10-17historical
-
2022-10-17historical
-
2022-08-23$2,095,000 Active
-
2022-08-17$2,095,000
-
2017-02-14soldstatus $1,085,000 Sold
-
2017-02-14soldstatus $1,085,000
-
2017-01-16status Pending
-
2016-10-27$1,180,000 Active
-
2014-01-31historical
-
2014-01-26$925,000 Active
-
2012-05-17soldstatus $740,000
-
1987-09-15soldstatus $230,000
ⓘ Source: listings_history table (triggers on properties + properties_extension) + one-shot
backfill from property_details.listing_events for pre-trigger history.
Tax reassessment forecast CA · Resets to sale price
- Current annual tax
- $13,715 · $1,143/mo
- Projected year-2 tax
- $13,715 · $1,143/mo
- Expected delta
- $0/yr ($0/mo · 0.0%)
ⓘ Screening estimate from a state-policy table — verify with the county assessor before closing.
Climate risk First Street
- Flood 1/10 Low FEMA zone X (unshaded) · 0% chance over 30 yrs
- Wildfire 1/10 Low
- Heat 4/10 Moderate 7 d/yr ≥84°F today · 19 d/yr by 30 yrs out
- Wind 1/10 Low
- Air quality 4/10 Moderate 4 unhealthy d/yr today · 4 by 30 yrs out
Nearby sold comps map
Loading sold comps map…
Walkable amenities ~0.75 mi
Loading nearby amenities…
Taxation est. · year 1
- Rental income
- $96,506
- − Mortgage interest
- −$98,027
- − Property taxes
- −$13,715
- − Insurance
- −$8,750
- − Repairs & maintenance
- −$7,720
- − Management
- −$7,720
- − HOA
- −$4,500
- − Depreciation
- −$50,909
- Taxable loss
- −$94,836
- Est. tax savings @ 24.0%
- +$22,761
- After-tax cash flow
- $-38,091/yr
For passive investors: Depreciation is non-cash, so a rental often shows a tax loss while cash-flowing — sheltering income. Rental losses are passive: they offset passive income freely, and up to $25,000/yr can offset ordinary (W-2) income if you actively participate and your MAGI is under $100k (phasing out to $0 by $150k); unused losses carry forward. On sale, claimed depreciation is recaptured at up to 25%, and gains may owe capital-gains tax (a 1031 exchange can defer both). Figures are a year-1 estimate at your 24.0% rate — not tax advice; consult a CPA.
Schools (NCES district)
- District
- Coronado Unified
- NCES district ID
- 0609870
- Math proficiency
- 61% ▼ -7.00%
- Reading proficiency
- 77% ▼ -1.00%
- Median HH income
- $91,550
- Composite
- 62.45/100
- National rank
- #691
- State rank
- #47 of 517 in CA
Livability — Coronado
- Score
- 69/100
- State rank
- #249
- US rank
- #8296
Category grades
Schools grade is shown separately in the Schools card above.
Census & demographics
- Census place
- Coronado, CA
- County
- San Diego County · 3,178,799 people
- City population
- 18,929
- Metro
- San Diego-Chula Vista-Carlsbad, CA
- Population (ZIP)
- 18,929
- Household income
- $134,534
- Rent vs Own
- Severe rent burden
- 1052.0
Population outlook (San Diego County) Hauer SSP2
- Today (2025)
- 3,678,185 people
- By 2030
- 3,856,546 · +4.8%
- By 2040
- 4,171,407 · +13.4%
- By 2050
- 4,421,607 · +20.2%
- By 2075
- 4,831,599 · +31.4%
- By 2100
- 4,832,502 · +31.4%
Race, ethnicity, and origin ACS 2023
- Neighborhood character
- Predominantly White (70%)
- Race & ethnicity
- White 70% Hispanic / Latino 19% Two or more races 11% Asian 4% Black 2%
- Hispanic origin (detail)
- Mexican 12% Puerto Rican 3%
- Common ancestry
- Italian 4% Lithuanian 4% Slovak 2%
- Foreign-born
- 10% · Canada, Jamaica
- Languages at home
- 84% English-only · Spanish 12% Tagalog/Filipino 1% Other Indo-European 1%
Political lean MEDSL · San Diego
- 2024 margin
- D (+16.8) · D 56.9% · R 40.1% · Other 2.9%
- 2008→2024 swing
- +6.6pp toward D · 2008: 10.2pp · 2024: 16.8pp
- All cycles
- 2024: D+16.8 2020: D+22.8 2016: D+17.8 2012: D+5.1 2008: D+10.2
Not yet ingested
- Civics
- —
Market trends
- HPI YoY
- ▲ 1.41%
- Current HPI
- 360.7979
- Rent YoY
- ▲ 4.44%
- Metro
- San Diego-Chula Vista-Carlsbad, CA
- State GDP YoY
- ▲ 3.21%
- F500 in state
- 116
Industry mix (Fortune 500 HQ in CA)
| Industry | F500 HQs | Revenue |
|---|---|---|
| Technology | 27 | $1,492B |
|
||
| Financial Services | 3 | $174B |
|
||
| Retail | 3 | $44B |
|
||
| Insurance | 3 | $26B |
|
||
| Media / Entertainment | 2 | $115B |
|
||
| Pharmaceuticals / Biotech | 2 | $62B |
|
||
Price history
+682.6% since first listed13 events — show timeline
- 2026-04-17 Listed $1,800,000 SDMLS
- 2022-10-17 Listing Removed — SDMLS
- 2022-10-17 Listing Removed — CRMLS
- 2022-08-23 Listed $2,095,000 CRMLS
- 2022-08-17 Listed $2,095,000 SDMLS
- 2017-02-14 Sold (Public Records) $1,085,000 Public Records
- 2017-02-14 Sold (MLS) $1,085,000 SDMLS
- 2017-01-16 Pending — SDMLS
- 2016-10-27 Listed $1,180,000 SDMLS
- 2014-01-31 Listing Removed — SDMLS
- 2014-01-26 Listed $925,000 SDMLS
- 2012-05-17 Sold (Public Records) $740,000 Public Records
- 1987-09-15 Sold (Public Records) $230,000 Public Records
Property tax history
+8.0%/yrLatest (2025): $13,715 · +2.4% YoY. Source: county tax records.
Cash-flow waterfall
monthlySold comps — $/sqft
last 12 mo · ≤1 miLoading sold comps…