 Duplex
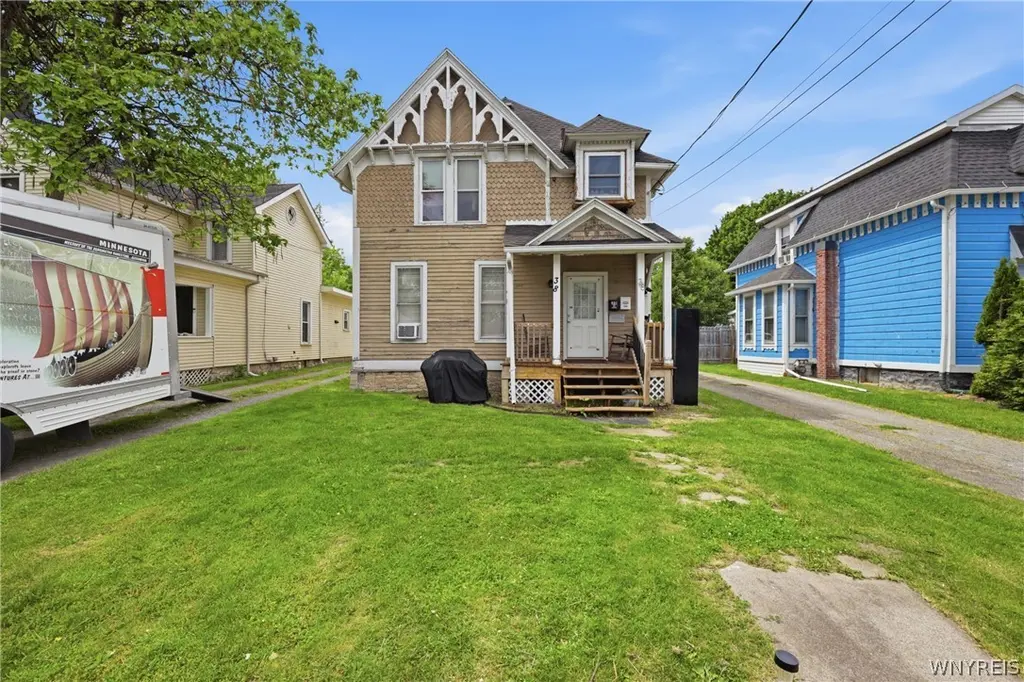
38 Walnut St · Batavia, NY
Flood risk 1/10 · Minimal
- FEMA flood zone
- X
- Chance of flooding over 30 yrs
- 0.0%
- Est. flood insurance / yr
- $473 – $860
Fire risk 2/10 · Minimal
- Est. fire insurance / yr
- $691 – $1,283
Heat risk 2/10 · Minimal
- Hot days now (above 96°F)
- 7 days/yr
- Hot days in 30 yrs
- 16 days/yr
Wind risk 1/10 · Minimal
- Chance of severe wind over 30 yrs
- —
Air-quality risk 2/10 · Minimal
- Unhealthy air days now
- 1 days/yr
- Unhealthy air days in 30 yrs
- 2 days/yr
Risk factors via First Street. Map © Google.
Why this score? — see what drove the C+ grade
The composite is a weighted blend of 9 inputs, each scored 0–100. Each bar is that input's sub-score; the figure is the points it added to the 100-point composite (weight × sub-score).
- Cash flow +30.0/30.0
- 1% rule +10.0/10.0
- DSCR +10.0/10.0
- Schools +3.7/10.0
- Livability +3.4/5.0
- Rent growth +2.5/5.0
- Condition / age +2.5/5.0
- ARV discount +0.0/15.0
- Appreciation +0.0/10.0
$174,900
🖨 Deal sheet (PDF) 📄 Offer letter ✓ Due diligence
Multi-family units
County records classify this as Multi-Family (2-4 Unit). Listing-text estimate: 2 units. confirmed
Listing remarks
Investment Opportunity in the Heart of Batavia! Turnkey income-producing property with strong rental history! This well-maintained 2-unit property offers investors an excellent opportunity to add a fully occupied asset to their portfolio. Both units are currently rented, providing immediate cash flow from day one. Featuring separate living spaces, this duplex appeals to tenants seeking affordability and convenience while offering investors the benefits of diversified rental income under one roof. Located close to downtown Batavia, shopping, restaurants, schools, and major commuter routes, the property enjoys a desirable location that supports long-term rental demand. Whether you're a sea
Key facts
- 0.35 acre lot
- 2 parking spots
- Built 1800
Property features AI
Finance
- Financial info: Two-unit property with two separate gas meters and two separate electric meters; Gross income reported at $23,400; Operating expenses reported at $7,615; Operating expenses include professional management; Tenants pay all utilities
Exterior
- Parking: Two or more parking spaces
- Utilities: Public water connected; Sewer connected
- Home design: Two-story building; Resale property; Faces a main thoroughfare
- Construction: Wood siding with blown-in insulation; Asphalt and metal roofing; Stone foundation; Built previously (existing)
- Exterior features: Covered porch
Interior
- Flooring: Vinyl and varying floor types
- Bathrooms: Two full bathrooms
- Heating & cooling: Gas forced-air heating
- Interior features: Varied flooring with vinyl in areas; Full basement
- Laundry & utility: Washer hookup; Gas water heater
Neighborhood map
What this means for you Summary
Snapshot
- This is a 2 × 2-bed/1.0-bath units multifamily listed at $175k.
Deal economics
- At list price, monthly cash flow is $1k ($14k/yr) — positive. Per door: $600/mo.
- The deal already cash-flows at list — no discount required.
- Meets the 1% rule at list price ($3k rent vs $175k).
- Cap rate 14.5% vs local median 5.5% in Batavia — top-decile yield for the area; either an underpriced asset or a hidden risk that comps aren't pricing in. Stress-test before assuming the spread holds.
Location & tenants
- Location reads 68/100 on livability (#536 in NY) — a middle-class / working-renter tenant base. Strengths: cost of living A+, housing A+, health & safety A; Watch: employment C-, crime D+, amenities F.
- Batavia City School District (town): math 38% / reading 50% proficiency, ranked #477 of 590 in NY (top 81%) — families likely to look elsewhere, expect single-tenant / working-renter base with shorter leases.
- Zoned schools: John Kennedy School (math 35% / reading 50%, grade F, #1,356 of 2,108 statewide, top 64%, 481 students, 56% FRL); Batavia Middle School (math 23% / reading 50%, grade F, #464 of 729 statewide, top 64%, 595 students, 54% FRL); Batavia High School (math 87% / reading 75%, grade A, #485 of 1,100 statewide, top 45%, 645 students, 45% FRL) — zoned schools at 52% FRL track the district average.
- Market conditions: 90 active listings in the ZIP; 1 comparable units currently listed for rent nearby; 55 units permitted in Genesee County in 2024 (0 in 5+ unit buildings).
- At $2,943/mo this rent would consume 56% of the median local household income ($63k/yr) (locally 817% of renters already pay >50% of income on rent) — very limited rent-growth headroom before tenants either downsize or default.
Forward outlook
- Local home prices are declining (-3.0%/yr); year-one equity from $1k of loan paydown is wiped out by about $5k of value loss. Plan a longer hold.
- Genesee County population projected at -22% by 2050 — secular population decline; favor cash flow + early exit over multi-decade hold.
- At projected returns (-3.0% appreciation + 3.0% rent growth), your $49k cash investment doubles in ~5 years — after that, you're playing with house money.
Negotiation context
- Only 9 days on market — expect competitive offers; lowballing is unlikely to land.
- 2 sale attempts since 14y ago with the ask held roughly flat each time — persistent listings suggest the price (not the market) is what's stuck; bring a comps-based counter.
- Current owner paid $40k; list at $175k implies a 336% gain — meaningful room to come down on a strong offer.
Risks & watch-outs
- Watch-outs: built in 1800 — expect roof / HVAC / electrical / plumbing capex.
Questions for the listing agent
- Can we see the unit-by-unit rent roll, current vacancy, and any below-market leases? What's the average tenancy length?
- What capital expenditures (roof, boiler, parking lot, exteriors) have been made in the last 5 years, and what's planned in the next 2?
- Built in 1800 — when were the roof, HVAC, electrical panel, plumbing, and water heater last replaced?
- Is there a deadline driving the sale (1031 exchange, divorce, estate, relocation)? That informs how much negotiation room exists.
- Schools are B-rated — typically a magnet for longer-tenancy family renters. What's the average tenant stay here, and is there a school-zone premium baked into asking?
- Crime grade is D in this area — have there been break-ins, vandalism, or insurance claims at this property in the last 3 years? What carrier currently insures it and at what premium?
- What's the average days-on-market for RENTAL listings here right now (not sales)? A rising rental-DOM trend means longer vacancies and softer asking-rent achievability than the comps imply.
- What's the recent tenant-quality profile in this submarket — average credit score on applications, eviction rate, late-payment / NSF rate, and stable-employment percentage? A property-management company in the area should have these aggregated.
- How much new apartment / multifamily construction is in the pipeline within 1–3 miles? Heavy new supply (>2% of stock underway) typically softens rents 12–24 months out; light construction supports rent growth.
Investment metrics
- 1% rule
- 1.68% ✓
- Cap rate
- 14.52%
- Cash-on-cash
- 29.40%
- DSCR
- 2.31
- GRM
- 5.0
CMA / ARV
- ARV (on-the-fly)
- $148,452
- Comps found
- 4
Show comp detail 4 sales within ~0.75 mi
| Address | Dist | Beds/Ba | Sqft | Sold | Price | $/sf | Match |
|---|---|---|---|---|---|---|---|
| 107 Watson St | 0.33mi | 4/2.0 (+1) | 1,720 (+3%) | 16mo | $55,000 | $32 | 61 |
| 49 Prospect Ave | 0.63mi | 3/2.0 | 1,540 (-8%) | 4mo | $167,500 | $109 | 54 |
| 1 Cone St | 0.58mi | 3/2.0 | 1,521 (-9%) | 20mo | $110,000 | $72 | 42 |
| 9 Pringle Ave | 0.58mi | 4/2.0 (+1) | 1,900 (+14%) | 10mo | $169,000 | $89 | 36 |
Match score weights: distance 35% · size 25% · config 20% · recency 20%. Top-matched comps best support the ARV.
Projected returns pro-forma
-3.0% appreciation · 3.0% rent growth · sell at horizon
- IRR
- 23.8%
- Equity multiple
- 1.98×
- Total profit
- $48,061
- Equity at exit
- $26,078
- IRR
- 31.7%
- Equity multiple
- 3.86×
- Total profit
- $140,213
- Equity at exit
- $15,122
Cash invested: $48,972 (down + closing). Projections, not guarantees.
Landlord ↔ Tenant lean methodology
- Overall (STATE)
- 15 Strongly Tenant-Friendly
- State New York
- 15 Strongly Tenant-Friendly · D+10
- County
- — inherits STATE
- City
- — inherits STATE
ZIP-level market 14020
- Home prices YoY
- -10.4%
- Active inventory
- 90
- Price-to-rent
- 9.9×
Monthly cashflow live
- Estimated rent
- $2,943 high interval (Pro) →
- Mortgage (P&I)
- −$917
- Tax from tax record
- −$135 /mo · $1,622/yr
- Insurance
- −$73
- HOA
- −$0
- Vacancy / Maint / Mgmt
- −$618
- Net cashflow
- $1,200
Break-even live
Sensitivity live
| Price | -10% $1,299 | -5% $1,249 | +0% $1,200 | +5% $1,150 | +10% $1,101 |
|---|---|---|---|---|---|
| Rent | -10% $967 | -5% $1,083 | +0% $1,200 | +5% $1,316 | +10% $1,432 |
| Rate | -1.0pp $1,288 | -0.5pp $1,244 | base $1,200 | +0.5pp $1,154 | +1.0pp $1,108 |
2-unit breakdown (identical units grouped — click to expand)
| Units | Beds | Baths | Est. rent |
|---|---|---|---|
| 2× units | 2 | 1 | $2,944 |
| #1 | 2 | 1 | $1,472 |
| #2 | 2 | 1 | $1,472 |
| Total (2 units) | $2,943 | ||
UW: 25.0% down · 7.5% · 30yr · 1.5% tax · 5.0% vac · 8.0% maint · 8.0% mgmt
Financing live
Cash to close
- Down payment
- $43,725
- Closing costs
- $5,247
- Reserves months
- —
- Total cash needed
- —
Loan-product check · same deal, 3 products live
Conventional
25% down · 7.5% · 30yr
- Down + closing
- —
- Monthly P&I
- —
- Monthly cashflow
- —
- DSCR
- —
- Eligible?
- —
Personal DTI + credit; lowest rate.
DSCR
20% down · 8.5% · 30yr
- Down + closing
- —
- Monthly P&I
- —
- Monthly cashflow
- —
- DSCR
- —
- Eligible?
- —
No personal income docs; deal must DSCR.
Hard money
10% down · 12.0% · 12mo
- Down + closing
- —
- Monthly P&I
- —
- Monthly cashflow
- —
- DSCR
- —
- Eligible?
- —
Short-term bridge; refi at stabilization.
Rent comps 1 comps
| Address | Beds | Baths | Sqft | Rent | $/sqft | DOM | Units | Dist |
|---|---|---|---|---|---|---|---|---|
| 33 Manhattan Ave Batavia, NY | 2.0 | 1.0 | 2162 | $925 | $0.43 | 12d | 1 | 1.01mi |
Listing history 8 events
-
2026-06-19days on market $174,900 Active 9 DOM
-
2026-06-18days on market $174,900 Active 8 DOM
-
2026-06-17days on market $174,900 Active 7 DOM
-
2026-06-16days on market $174,900 Active 6 DOM
-
2026-06-16remarks 699-char remark
-
2026-06-15days on market $174,900 Active 5 DOM
-
2026-06-14days on market $174,900 Active 3 DOM
-
2026-06-12$174,900 Active 2 DOM
ⓘ Source: listings_history table (triggers on properties + properties_extension) + one-shot
backfill from property_details.listing_events for pre-trigger history.
Tax reassessment forecast NY · Partial reset (capped growth)
- Current annual tax
- $1,622 · $135/mo
- Projected year-2 tax
- $2,289 · $191/mo
- Expected delta
- +$667/yr (+$56/mo · 41.1%)
ⓘ Screening estimate from a state-policy table — verify with the county assessor before closing.
Climate risk First Street
- Flood 1/10 Low FEMA zone X · 0% chance over 30 yrs
- Wildfire 2/10 Low
- Heat 2/10 Low 7 d/yr ≥96°F today · 16 d/yr by 30 yrs out
- Wind 1/10 Low
- Air quality 2/10 Low 1 unhealthy d/yr today · 2 by 30 yrs out
Nearby sold comps map
Loading sold comps map…
Walkable amenities ~0.75 mi
Loading nearby amenities…
Taxation est. · year 1
- Rental income
- $35,316
- − Mortgage interest
- −$9,797
- − Property taxes
- −$1,622
- − Insurance
- −$874
- − Repairs & maintenance
- −$2,825
- − Management
- −$2,825
- − Depreciation
- −$5,088
- Taxable income
- $12,283
- Est. tax owed @ 24.0%
- −$2,948
- After-tax cash flow
- $11,448/yr
For passive investors: Depreciation is non-cash, so a rental often shows a tax loss while cash-flowing — sheltering income. Rental losses are passive: they offset passive income freely, and up to $25,000/yr can offset ordinary (W-2) income if you actively participate and your MAGI is under $100k (phasing out to $0 by $150k); unused losses carry forward. On sale, claimed depreciation is recaptured at up to 25%, and gains may owe capital-gains tax (a 1031 exchange can defer both). Figures are a year-1 estimate at your 24.0% rate — not tax advice; consult a CPA.
Schools (NCES district)
- District
- Batavia City School District
- NCES district ID
- 3603990
- Math proficiency
- 38% ▼ -13.00%
- Reading proficiency
- 50% ▲ 4.00%
- Median HH income
- $43,288
- Composite
- 37.13/100
- National rank
- #4490
- State rank
- #477 of 590 in NY
Livability — Batavia
- Score
- 68/100
- State rank
- #536
- US rank
- #9660
Category grades
Schools grade is shown separately in the Schools card above.
Census & demographics
- Census place
- Batavia, NY
- County
- Genesee County · 22,002 people
- City population
- 22,002
- Metro
- Batavia, NY
- Population (ZIP)
- 22,002
- Household income
- $62,655
- Rent vs Own
- Severe rent burden
- 817.0
Population outlook (Genesee County) Hauer SSP2
- Today (2025)
- 56,113 people
- By 2030
- 54,140 · -3.5%
- By 2040
- 49,368 · -12.0%
- By 2050
- 43,911 · -21.7%
- By 2075
- 32,511 · -42.1%
- By 2100
- 21,695 · -61.3%
Race, ethnicity, and origin ACS 2023
- Neighborhood character
- Predominantly White (87%)
- Race & ethnicity
- White 87% Two or more races 6% Hispanic / Latino 4% Black 3% Asian 1%
- Common ancestry
- Romanian 11% Lithuanian 2% Slovak 2%
- Foreign-born
- 4% · Canada, China
- Languages at home
- 95% English-only · Spanish 3% Chinese 1%
Political lean MEDSL · Genesee
- 2024 margin
- Solid R (+34.0) · D 33.0% · R 67.0%
- 2008→2024 swing
- -15.6pp toward R · 2008: -18.4pp · 2024: -34.0pp
- All cycles
- 2024: R+34.0 2020: R+31.7 2016: R+37.0 2012: R+20.9 2008: R+18.4
Not yet ingested
- Civics
- —
Market trends
- HPI YoY
- ▼ -30.58%
- Current HPI
- 263.2147
- Rent YoY
- —
- Metro
- Batavia, NY
- State GDP YoY
- ▲ 2.60%
- F500 in state
- 92
Industry mix (Fortune 500 HQ in NY)
| Industry | F500 HQs | Revenue |
|---|---|---|
| Financial Services | 10 | $950B |
|
||
| Consumer Goods | 9 | $162B |
|
||
| Insurance | 4 | $225B |
|
||
| Telecommunications | 2 | $144B |
|
||
| Pharmaceuticals | 2 | $112B |
|
||
| Media / Entertainment | 2 | $69B |
|
||
Price history
-66.0% since first listed5 events — show timeline
- 2026-06-10 Listed $174,900 WNYREIS
- 2021-04-27 Sold (Public Records) $50,000 Public Records
- 2021-04-27 Sold (Public Records) $40,101 Public Records
- 2012-07-16 Listed $62,000 WNYREIS
- 2008-07-07 Sold (Public Records) $515,000 Public Records
Property tax history
-3.9%/yrLatest (2025): $1,622 · -47.6% YoY. Source: county tax records.
Cash-flow waterfall
monthlySold comps — $/sqft
last 12 mo · ≤1 miLoading sold comps…