 Duplex
6230 Hayes St · Oakland, CA
Flood risk 1/10 · Minimal
- FEMA flood zone
- X (unshaded)
- Chance of flooding over 30 yrs
- 0.0%
- Est. flood insurance / yr
- $507 – $1,088
Fire risk 1/10 · Minimal
- Est. fire insurance / yr
- $659 – $1,223
Heat risk 4/10 · Minor
- Hot days now (above 83°F)
- 7 days/yr
- Hot days in 30 yrs
- 15 days/yr
Wind risk 1/10 · Minimal
- Chance of severe wind over 30 yrs
- —
Air-quality risk 8/10 · Major
- Unhealthy air days now
- 14 days/yr
- Unhealthy air days in 30 yrs
- 14 days/yr
Risk factors via First Street. Map © Google.
Why this score? — see what drove the B- grade
The composite is a weighted blend of 9 inputs, each scored 0–100. Each bar is that input's sub-score; the figure is the points it added to the 100-point composite (weight × sub-score).
- Cash flow +22.7/30.0
- ARV discount +15.0/15.0
- DSCR +7.3/10.0
- 1% rule +7.0/10.0
- Rent growth +4.1/5.0
- Livability +3.6/5.0
- Schools +3.0/10.0
- Condition / age +2.5/5.0
- Appreciation +0.0/10.0
$430,000
🖨 Deal sheet 📄 Offer letter ✓ Due diligence
Multi-family units
County records classify this as Multi-Family (2-4 Unit). Listing-text estimate: 2 units. confirmed
Listing remarks
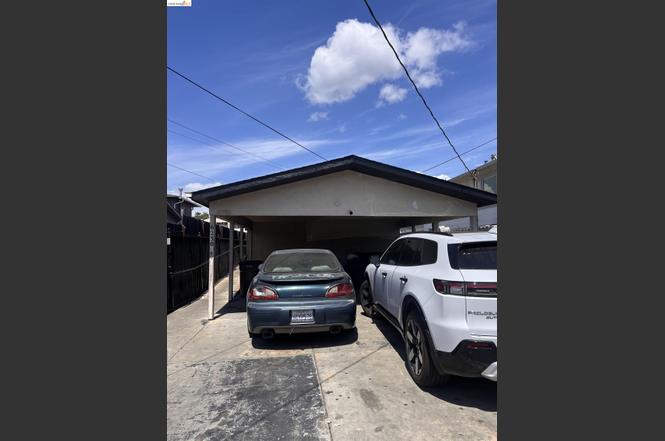
Back on Market! For homeowners and investors alike, this versatile duplex at 6230 Hayes Street presents an exceptional opportunity in Oakland. Featuring two units — one 2-bedroom, 1-bath and one 1-bedroom, 1-bath — this fixer is ready for your vision. Both units can be delivered vacant, offering the flexibility to live in one and rent the other, or maximize rental income potential. Each unit includes carport parking for two cars. Ideal for buyers looking to build equity, generate income, or customize to their taste. Conveniently located near BART, major freeways, shopping, and everyday amenities. Fixer with tremendous upside potential in an established neighborhood. Bring your c
Key facts
- Two units
- Carport parking
- Growing neighborhood
Tags
Property features AI
Finance
- Other: Two total units
Exterior
- Parking: Total of 4 parking spaces; Carport (2+ spaces)
- Utilities: Public water; Public sewer
- Home design: Duplex residential income property; Built in 1959
- Construction: Stucco construction
- Exterior features: Back yard; Level lot
Interior
- Flooring: Laminate flooring
- Bathrooms: Each unit has 1 bathroom (2 total)
- Heating & cooling: Wall furnace heating; No air conditioning
- Interior features: Storage
- Laundry & utility: In-unit laundry
Neighborhood map
What this means for you Summary
Snapshot
- This is a 2 × 3-bed/2.0-bath units multifamily listed at $430k.
Deal economics
- At list price, monthly cash flow is $739 ($9k/yr) — positive. Per door: $369/mo.
- The deal already cash-flows at list — no discount required.
- Meets the 1% rule at list price ($5k rent vs $430k).
- Recommended offer: $404k (6.0% below list) — sets the bar for market timing.
- Cap rate 8.4% vs local median 2.4% in Oakland — top-decile yield for the area; either an underpriced asset or a hidden risk that comps aren't pricing in. Stress-test before assuming the spread holds.
Location & tenants
- Location reads 71/100 on livability (#224 in CA) — a middle-class / working-renter tenant base. Strengths: amenities A+, commute A+, employment A+; Watch: schools C-, crime F, cost of living F.
- Oakland Unified (urban): math 27% / reading 33% proficiency, ranked #1,007 of 1,400 in CA (top 72%) — families likely to look elsewhere, expect single-tenant / working-renter base with shorter leases; 68% free/reduced lunch — lower-income household profile, screen leases tightly.
- Market conditions: Rents rising fast (+6.5%/yr); 83 active listings in the ZIP; 24 comparable units currently listed for rent nearby; rentals lingering (median 44d on market — plan ~5-8 weeks vacancy on turnover, expect pricing pressure); 75% of comp listings sitting > 30 days — soft ceiling on asking rent; 1,742 units permitted in Alameda County in 2024 (856 in 5+ unit buildings).
- At $5,168/mo this rent would consume 119% of the median local household income ($52k/yr) (locally 2404% of renters already pay >50% of income on rent) — very limited rent-growth headroom before tenants either downsize or default.
Forward outlook
- Local home prices are declining (-3.0%/yr); year-one equity from $3k of loan paydown is wiped out by about $13k of value loss. Plan a longer hold.
- Alameda County population projected at +34% by 2050 — long-run rental-demand tailwind backs the buy-and-hold thesis.
- At projected returns (-3.0% appreciation + 6.5% rent growth), your $120k cash investment doubles in ~9 years — after that, you're playing with house money.
Negotiation context
- It's been on market 61 days — a 6% lower offer ($404k) is reasonable based on typical stale-listing flexibility.
- 2 sale attempts; this cycle's ask has dropped $71k (14%) from the opening price — seller is motivated, your offer sets the floor, not the list.
Risks & watch-outs
- Watch-outs: property tax is 2.5% of price; built in 1959 — expect roof / HVAC / electrical / plumbing capex.
Questions for the listing agent
- It's been on market 61 days. Have you received any prior offers? Is the seller open to a 6% concession, seller financing, or rate buy-down credit?
- Can we see the unit-by-unit rent roll, current vacancy, and any below-market leases? What's the average tenancy length?
- What capital expenditures (roof, boiler, parking lot, exteriors) have been made in the last 5 years, and what's planned in the next 2?
- Built in 1959 — when were the roof, HVAC, electrical panel, plumbing, and water heater last replaced?
- Property tax is high relative to price — has the assessment been appealed recently, and will the sale trigger a re-assessment?
- Why hasn't it sold? Are there any deal-killer items the seller is aware of (foundation, flood, title, zoning, code violations)?
- Is there a deadline driving the sale (1031 exchange, divorce, estate, relocation)? That informs how much negotiation room exists.
- Crime grade is F in this area — have there been break-ins, vandalism, or insurance claims at this property in the last 3 years? What carrier currently insures it and at what premium?
- What's the average days-on-market for RENTAL listings here right now (not sales)? A rising rental-DOM trend means longer vacancies and softer asking-rent achievability than the comps imply.
- What's the recent tenant-quality profile in this submarket — average credit score on applications, eviction rate, late-payment / NSF rate, and stable-employment percentage? A property-management company in the area should have these aggregated.
- How much new apartment / multifamily construction is in the pipeline within 1–3 miles? Heavy new supply (>2% of stock underway) typically softens rents 12–24 months out; light construction supports rent growth.
Investment metrics
- 1% rule
- 1.20% ✓
- Cap rate
- 8.36%
- Cash-on-cash
- 7.36%
- DSCR
- 1.33
- GRM
- 6.9
CMA / ARV
- ARV (on-the-fly)
- $546,364
- Comps found
- 5
Show comp detail 5 sales within ~0.75 mi
| Address | Dist | Beds/Ba | Sqft | Sold | Price | $/sf | Match |
|---|---|---|---|---|---|---|---|
| 6921 Flora St | 0.43mi | 4/2.0 (+1) | 1,374 (-8%) | 4mo | $520,000 | $378 | 57 |
| 5435 Bancroft Ave | 0.54mi | 3/2.0 | 1,659 (+10%) | 13mo | $605,000 | $365 | 46 |
| 3137 60th Ave | 0.70mi | 4/2.0 (+1) | 1,513 (+1%) | 18mo | $550,000 | $364 | 46 |
| 5330 Bancroft | 0.68mi | 3/2.0 | 1,407 (-6%) | 19mo | $490,000 | $348 | 42 |
| 2825 67th Ave | 0.64mi | 3/3.0 | 1,717 (+14%) | 23mo | $585,000 | $341 | 23 |
Match score weights: distance 35% · size 25% · config 20% · recency 20%. Top-matched comps best support the ARV.
Projected returns pro-forma
-3.0% appreciation · 6.45% rent growth · sell at horizon
- IRR
- -0.8%
- Equity multiple
- 0.97×
- Total profit
- $-3,750
- Equity at exit
- $64,114
- IRR
- 12.5%
- Equity multiple
- 2.17×
- Total profit
- $140,345
- Equity at exit
- $37,179
Cash invested: $120,400 (down + closing). Projections, not guarantees.
Landlord ↔ Tenant lean methodology
- Overall (CITY)
- 0 Strongly Tenant-Friendly
- State California
- 18 Strongly Tenant-Friendly · D+13
- County
- — inherits STATE
- City Oakland
- 0 Strongly Tenant-Friendly · D+62
ZIP-level market 94621
- Rents YoY
- 6.5%
- Active inventory
- 83
- Price-to-rent
- 13.9×
Monthly cashflow live
- Estimated rent
- $5,168 high interval (Pro) →
- Mortgage (P&I)
- −$2,255
- Tax from tax record
- −$910 /mo · $10,916/yr
- Insurance
- −$179
- HOA
- −$0
- Vacancy / Maint / Mgmt
- −$1,085
- Net cashflow
- $739
Break-even live
2-unit breakdown (identical units grouped — click to expand)
| Units | Beds | Baths | Est. rent |
|---|---|---|---|
| 2× units | 3 | 2 | $5,168 |
| #1 | 3 | 2 | $2,584 |
| #2 | 3 | 2 | $2,584 |
| Total (2 units) | $5,168 | ||
UW: 25.0% down · 7.5% · 30yr · 1.5% tax · 5.0% vac · 8.0% maint · 8.0% mgmt
Financing live
Cash to close
- Down payment
- $107,500
- Closing costs
- $12,900
- Reserves months
- —
- Total cash needed
- —
Loan-product check · same deal, 3 products live
Conventional
25% down · 7.5% · 30yr
- Down + closing
- —
- Monthly P&I
- —
- Monthly cashflow
- —
- DSCR
- —
- Eligible?
- —
Personal DTI + credit; lowest rate.
DSCR
20% down · 8.5% · 30yr
- Down + closing
- —
- Monthly P&I
- —
- Monthly cashflow
- —
- DSCR
- —
- Eligible?
- —
No personal income docs; deal must DSCR.
Hard money
10% down · 12.0% · 12mo
- Down + closing
- —
- Monthly P&I
- —
- Monthly cashflow
- —
- DSCR
- —
- Eligible?
- —
Short-term bridge; refi at stabilization.
Rent comps 24 comps
| Address | Beds | Baths | Sqft | Rent | $/sqft | DOM | Units | Dist |
|---|---|---|---|---|---|---|---|---|
| 5834 Elizabeth St Oakland, CA | 3.0 | 1.0 | 1050 | $3,724 | $3.55 | 43d | 1 | 0.22mi |
| 2442 Havenscourt Blvd Oakland, CA | 2.0 | 1.0 | 1182 | $4,000 | $3.38 | 43d | 1 | 0.26mi |
| 5875 Picardy Dr Oakland, CA | 4.0 | 2.5 | 1906 | $5,200 | $2.73 | 43d | 1 | 0.46mi |
| 6415 Brann St Oakland, CA | 2.0 | 1.0 | 1240 | $3,100 | $2.50 | 43d | 1 | 0.52mi |
| 5633 Picardy Dr S Oakland, CA | 2.0 | 1.0 | 1130 | $3,700 | $3.27 | 43d | 1 | 0.54mi |
| 2837 55th Ave #4 Oakland, CA | 2.0 | 2.0 | 1075 | $2,825 | $2.63 | 43d | 1 | 0.61mi |
| 5307 Hillen Dr Oakland, CA | 3.0 | 2.0 | 1831 | $3,895 | $2.13 | 5d | 1 | 0.64mi |
| 3337 64th Avenue Pl Oakland, CA | 3.0 | 2.0 | 1410 | $3,800 | $2.70 | 11d | 1 | 0.84mi |
| 1924 51st Ave Unit 3 Oakland, CA | 3.0 | 2.0 | 1100 | $6,800 | $6.18 | 43d | 1 | 0.85mi |
| 2169 48th Ave Unit A Oakland, CA | 3.0 | 1.0 | 1145 | $2,995 | $2.62 | 43d | 1 | 1.02mi |
| 1715 82nd Ave Oakland, CA | 3.0 | 2.0 | 1290 | $3,000 | $2.33 | 43d | 1 | 1.06mi |
| 4692 Congress Ave Oakland, CA | 2.0 | 1.0 | 1080 | $2,950 | $2.73 | 20d | 1 | 1.10mi |
| 1218 84th Ave Unit 1546321P Oakland, CA | 2.0 | 1.0 | 1754 | $2,581 | $1.47 | 15d | 1 | 1.15mi |
| 3849 Delmont Ave Oakland, CA | 3.0 | 2.0 | 1496 | $3,950 | $2.64 | 43d | 1 | 1.23mi |
| 8109 Hillside St Oakland, CA | 3.0 | 1.0 | 1182 | $3,300 | $2.79 | 43d | 1 | 1.30mi |
| 4124 Lyon Ave Unit 6 Oakland, CA | 3.0 | 1.5 | 1055 | $2,895 | $2.74 | 43d | 1 | 1.30mi |
| 4124 Lyon Ave Unit 4 Oakland, CA | 4.0 | 1.5 | 1210 | $3,195 | $2.64 | 43d | 1 | 1.30mi |
| 1333 87th Ave Oakland, CA | 2.0 | 1.0 | 1153 | $2,500 | $2.17 | 22d | 1 | 1.31mi |
| 4769 Fair Ave Unit A Oakland, CA | 2.0 | 1.0 | 1100 | $2,850 | $2.59 | 43d | 1 | 1.34mi |
| 2049 41st Ave Oakland, CA | 2.0 | 1.0 | 1200 | $2,850 | $2.38 | 43d | 1 | 1.37mi |
| 1008 88th Ave Oakland, CA | 3.0 | 1.0 | 1464 | $3,400 | $2.32 | 43d | 1 | 1.40mi |
| 4532 Pampas Ave Oakland, CA | 2.0 | 1.5 | 1290 | $4,000 | $3.10 | 43d | 1 | 1.41mi |
| 5400 Mountain Blvd #130 Oakland, CA | 2.0 | 2.0 | 1330 | $3,400 | $2.56 | 43d | 1 | 1.44mi |
| 8027 Ney Ave Unit 1 Oakland, CA | 4.0 | 2.0 | 1300 | $4,413 | $3.39 | 1d | 1 | 1.47mi |
Listing history 14 events
-
2026-06-18days on market $430,000 Active 61 DOM
-
2026-06-17days on market $430,000 Active 60 DOM
-
2026-06-16days on market $430,000 Active 59 DOM
-
2026-06-15days on market $430,000 Active 58 DOM
-
2026-06-13days on market $430,000 Active 56 DOM
-
2026-06-13days on market $430,000 Active 55 DOM
-
2026-06-09days on market $430,000 Active 52 DOM
-
2026-06-08days on market $430,000 Active 51 DOM
-
2026-06-07days on market $430,000 Active 50 DOM
-
2026-06-04days on market $430,000 Active 47 DOM
-
2026-06-03days on market $430,000 Active 46 DOM
-
2026-06-02days on market $430,000 Active 45 DOM
-
2026-06-02remarks 687-char remark
-
2026-06-02$430,000 Active 44 DOM
ⓘ Source: listings_history table (triggers on properties + properties_extension) + one-shot
backfill from property_details.listing_events for pre-trigger history.
Tax reassessment forecast CA · Resets to sale price
- Current annual tax
- $10,916 · $910/mo
- Projected year-2 tax
- $10,916 · $910/mo
- Expected delta
- $0/yr ($0/mo · 0.0%)
ⓘ Screening estimate from a state-policy table — verify with the county assessor before closing.
Climate risk First Street
- Flood 1/10 Low FEMA zone X (unshaded) · 0% chance over 30 yrs
- Wildfire 1/10 Low
- Heat 4/10 Moderate 7 d/yr ≥83°F today · 15 d/yr by 30 yrs out
- Wind 1/10 Low
- Air quality 8/10 Severe 14 unhealthy d/yr today · 14 by 30 yrs out
Nearby sold comps map
Loading sold comps map…
Walkable amenities ~0.75 mi
Loading nearby amenities…
Taxation est. · year 1
- Rental income
- $62,016
- − Mortgage interest
- −$24,087
- − Property taxes
- −$10,916
- − Insurance
- −$2,150
- − Repairs & maintenance
- −$4,961
- − Management
- −$4,961
- − Depreciation
- −$12,509
- Taxable income
- $2,432
- Est. tax owed @ 24.0%
- −$584
- After-tax cash flow
- $8,283/yr
For passive investors: Depreciation is non-cash, so a rental often shows a tax loss while cash-flowing — sheltering income. Rental losses are passive: they offset passive income freely, and up to $25,000/yr can offset ordinary (W-2) income if you actively participate and your MAGI is under $100k (phasing out to $0 by $150k); unused losses carry forward. On sale, claimed depreciation is recaptured at up to 25%, and gains may owe capital-gains tax (a 1031 exchange can defer both). Figures are a year-1 estimate at your 24.0% rate — not tax advice; consult a CPA.
Schools (NCES district)
- District
- Oakland Unified
- NCES district ID
- 0628050
- Math proficiency
- 27% ▬ 0.00%
- Reading proficiency
- 33% ▬ 0.00%
- Median HH income
- $55,194
- Composite
- 29.52/100
- National rank
- #11769
- State rank
- #1007 of 1400 in CA
Livability — Oakland
- Score
- 71/100
- State rank
- #224
- US rank
- #7245
Category grades
Schools grade is shown separately in the Schools card above.
Census & demographics
- Census place
- Oakland, CA
- County
- Alameda County · 1,614,355 people
- City population
- 385,993
- Metro
- San Francisco-Oakland-Berkeley, CA
- Population (ZIP)
- 33,840
- Household income
- $52,049
- Rent vs Own
- Severe rent burden
- 2404.0
Population outlook (Alameda County) Hauer SSP2
- Today (2025)
- 1,928,884 people
- By 2030
- 2,069,146 · +7.3%
- By 2040
- 2,338,405 · +21.2%
- By 2050
- 2,586,608 · +34.1%
- By 2075
- 3,061,911 · +58.7%
- By 2100
- 3,234,133 · +67.7%
Race, ethnicity, and origin ACS 2023
- Neighborhood character
- Majority Hispanic (63%)
- Race & ethnicity
- Hispanic / Latino 63% Black 24% Two or more races 14% White 6% Asian 4% Native American 2%
- Hispanic origin (detail)
- Mexican 41%
- Common ancestry
- Italian 1%
- Foreign-born
- 35% · Canada, China, Vietnam
- Languages at home
- 40% English-only · Spanish 53% Arabic 2% Other Asian/Pacific 2%
Political lean MEDSL · Alameda
- 2024 margin
- Solid D (+53.6) · D 74.6% · R 21.0% · Other 4.4%
- 2008→2024 swing
- -5.9pp toward R · 2008: 59.5pp · 2024: 53.6pp
- All cycles
- 2024: D+53.6 2020: D+62.5 2016: D+64.4 2012: D+59.8 2008: D+59.5
Not yet ingested
- Civics
- —
Market trends
- HPI YoY
- ▼ -346.43%
- Current HPI
- 523.2253
- Rent YoY
- ▲ 6.45%
- Metro
- San Francisco-Oakland-Berkeley, CA
- State GDP YoY
- ▲ 3.21%
- F500 in state
- 116
Industry mix (Fortune 500 HQ in CA)
| Industry | F500 HQs | Revenue |
|---|---|---|
| Technology | 27 | $1,492B |
|
||
| Financial Services | 3 | $174B |
|
||
| Retail | 3 | $44B |
|
||
| Insurance | 3 | $26B |
|
||
| Media / Entertainment | 2 | $115B |
|
||
| Pharmaceuticals / Biotech | 2 | $62B |
|
||
Price history
-14.2% since first listed7 events — show timeline
- 2026-06-01 Relisted — bridgeMLS, Bay East AOR, or Contra Costa AOR
- 2026-04-20 Listing Removed — bridgeMLS, Bay East AOR, or Contra Costa AOR
- 2026-04-20 Pending — bridgeMLS, Bay East AOR, or Contra Costa AOR
- 2026-04-09 Listing Removed — bridgeMLS, Bay East AOR, or Contra Costa AOR
- 2026-04-09 Pending — bridgeMLS, Bay East AOR, or Contra Costa AOR
- 2026-04-01 Price Changed $430,000 bridgeMLS, Bay East AOR, or Contra Costa AOR
- 2026-02-24 Listed $501,000 bridgeMLS, Bay East AOR, or Contra Costa AOR
Property tax history
+12.1%/yrLatest (2025): $10,916 · +72.4% YoY. Source: county tax records.
Cash-flow waterfall
monthlySold comps — $/sqft
last 12 mo · ≤1 miLoading sold comps…