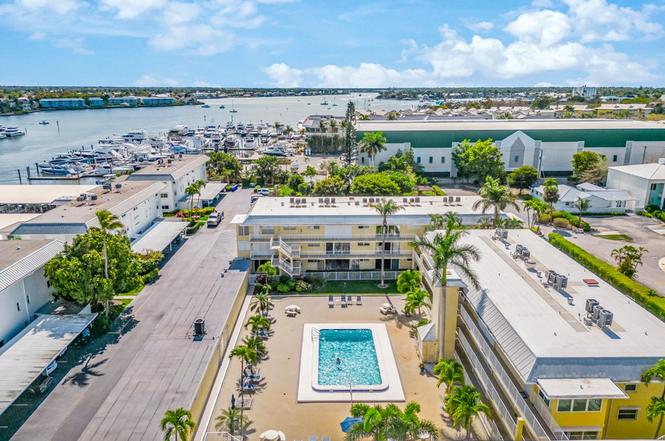
1100 8th Ave S · Naples, FL
Flood risk 9/10 · Severe
- FEMA flood zone
- AE
- Chance of flooding over 30 yrs
- 0.99%
- Est. flood insurance / yr
- $1,737 – $8,500
Fire risk 3/10 · Minor
- Est. fire insurance / yr
- $947 – $1,759
Heat risk 10/10 · Severe
- Hot days now (above 107°F)
- 7 days/yr
- Hot days in 30 yrs
- 26 days/yr
Wind risk 10/10 · Severe
- Chance of severe wind over 30 yrs
- 99.0%
Air-quality risk 3/10 · Minor
- Unhealthy air days now
- 3 days/yr
- Unhealthy air days in 30 yrs
- 3 days/yr
Risk factors via First Street. Map © Google.
Why this score? — see what drove the C+ grade
The composite is a weighted blend of 9 inputs, each scored 0–100. Each bar is that input's sub-score; the figure is the points it added to the 100-point composite (weight × sub-score).
- Cash flow +20.0/30.0
- ARV discount +7.5/15.0
- Appreciation +7.0/10.0
- DSCR +6.3/10.0
- 1% rule +5.3/10.0
- Schools +5.0/10.0
- Rent growth +4.7/5.0
- Livability +4.0/5.0
- Condition / age +2.5/5.0
$495,000
🖨 Deal sheet 📄 Offer letter ✓ Due diligence
Listing remarks
ATTENTION BOATERS & INVESTORS PRICED TO SELL AT JUST $495,000!The owner sold their boat and is highly motivated to sell, making this an exceptional opportunity to own a completely renovated two-bedroom, two-bath condo in the heart of Olde Naples at an incredible value. This coastal retreat on the Bay of Naples has been thoughtfully upgraded from top to bottom, featuring completely updated electrical, plumbing and all new appliances including an in-unit full washer dryer, along with refined coastal finishes throughout. The open, light-filled corner unit creates a true oasis just steps from Naples most iconic destinations3rd Street South, 5th Avenue South, Tin City and the beach offerin
Key facts
- Updated electrical
- New appliances
- Completely renovated
Tags
Neighborhood map
What this means for you Summary
Snapshot
- This is a 2-bed/2.0-bath other listed at $495k.
Deal economics
- At list price, monthly cash flow is $181 ($2k/yr) — positive.
- The deal already cash-flows at list — no discount required.
- Meets the 1% rule at list price ($5k rent vs $495k).
- Recommended offer: $436k (12.0% below list) — sets the bar for market timing.
Location & tenants
- Location reads 80/100 on livability (#126 in FL, #1,903 nationally) — a professional / high-income tenant draw. Strengths: crime A+, amenities A+, employment A+; Watch: commute D+, cost of living F.
- Collier (suburban): math 60% / reading 56% proficiency, ranked #16 of 73 in FL (top 22%) — acceptable for families but not a draw, mixed tenant base, ~2y average lease.
- Market conditions: Rents rising fast (+8.8%/yr); 614 active listings in the ZIP; 40 comparable units currently listed for rent nearby; rentals at typical pace (median 24d on market — plan ~3-4 weeks tenant-placement turnaround); high-income renter base; 3,520 units permitted in Collier County in 2024 (959 in 5+ unit buildings).
- At $5,109/mo this rent would consume 47% of the median local household income ($131k/yr) (locally 333% of renters already pay >50% of income on rent) — very limited rent-growth headroom before tenants either downsize or default.
Forward outlook
- In year one you build about $24k of equity ($3k loan paydown + $20k appreciation (4.1% local appreciation)).
- Collier County population projected at +30% by 2050 — long-run rental-demand tailwind backs the buy-and-hold thesis.
- At projected returns (4.1% appreciation + 8.0% rent growth), your $139k cash investment doubles in ~5 years — after that, you're playing with house money.
- By year 2, paydown + projected appreciation supports a ~$38k cash-out refi (75% LTV) — recoverable capital for the next deal without selling this one.
Negotiation context
- It's been on market 139 days — a 12% lower offer ($436k) is reasonable based on typical stale-listing flexibility.
- 3 sale attempts since 3y ago with the ask held roughly flat each time — persistent listings suggest the price (not the market) is what's stuck; bring a comps-based counter.
Risks & watch-outs
- Watch-outs: flood insurance adds $427/mo.
- Climate carrying-cost: in FEMA flood zone AE (mandatory federal flood insurance); severe wind risk, 99% chance of damaging wind over 30y; extreme-heat days projected 7→26/yr by 2055 (HVAC capex compounding) — expect insurance premiums to compound above CPI over the hold.
Questions for the listing agent
- It's been on market 139 days. Have you received any prior offers? Is the seller open to a 12% concession, seller financing, or rate buy-down credit?
- Built in 1970 — when were the roof, HVAC, electrical panel, plumbing, and water heater last replaced?
- What's the actual annual flood-insurance premium (NFIP or private), and is the property in a SFHA with mandatory coverage?
- Why hasn't it sold? Are there any deal-killer items the seller is aware of (foundation, flood, title, zoning, code violations)?
- Is there a deadline driving the sale (1031 exchange, divorce, estate, relocation)? That informs how much negotiation room exists.
- Schools are B-rated — typically a magnet for longer-tenancy family renters. What's the average tenant stay here, and is there a school-zone premium baked into asking?
- What's the average days-on-market for RENTAL listings here right now (not sales)? A rising rental-DOM trend means longer vacancies and softer asking-rent achievability than the comps imply.
- What's the recent tenant-quality profile in this submarket — average credit score on applications, eviction rate, late-payment / NSF rate, and stable-employment percentage? A property-management company in the area should have these aggregated.
- How much new for-sale + rental construction is in the pipeline within 1–3 miles? Heavy new supply typically softens prices + rents 12–24 months out; constrained supply supports both.
Investment metrics
- 1% rule
- 1.03% ✓
- Cap rate
- 7.76%
- Cash-on-cash
- 5.26%
- DSCR
- 1.23
- GRM
- 8.1
CMA / ARV
No comps found within radius.
Projected returns pro-forma
4.08% appreciation · 8.0% rent growth · sell at horizon
- IRR
- 14.7%
- Equity multiple
- 1.92×
- Total profit
- $127,449
- Equity at exit
- $253,392
- IRR
- 18.3%
- Equity multiple
- 4.28×
- Total profit
- $454,251
- Equity at exit
- $416,385
Cash invested: $138,600 (down + closing). Projections, not guarantees.
Landlord ↔ Tenant lean methodology
- Overall (STATE)
- 87 Strongly Landlord-Friendly
- State Florida
- 87 Strongly Landlord-Friendly · R+3
- County
- — inherits STATE
- City
- — inherits STATE
ZIP-level market 34102
- Home prices YoY
- 1.3%
- Rents YoY
- 8.8%
- Active inventory
- 614
- Price-to-rent
- 8.1×
Monthly cashflow live
- Estimated rent
- $5,109 medium interval (Pro) →
- Mortgage (P&I)
- −$2,596
- Tax from tax record
- −$627 /mo · $7,519/yr
- Insurance
- −$206
- Flood insurance flood zone
- −$427 /mo · $5,118/yr
- HOA
- −$0
- Vacancy / Maint / Mgmt
- −$1,073
- Net cashflow
- $181
Break-even live
UW: 25.0% down · 7.5% · 30yr · 1.5% tax · 5.0% vac · 8.0% maint · 8.0% mgmt
Financing live
Cash to close
- Down payment
- $123,750
- Closing costs
- $14,850
- Reserves months
- —
- Total cash needed
- —
Loan-product check · same deal, 3 products live
Conventional
25% down · 7.5% · 30yr
- Down + closing
- —
- Monthly P&I
- —
- Monthly cashflow
- —
- DSCR
- —
- Eligible?
- —
Personal DTI + credit; lowest rate.
DSCR
20% down · 8.5% · 30yr
- Down + closing
- —
- Monthly P&I
- —
- Monthly cashflow
- —
- DSCR
- —
- Eligible?
- —
No personal income docs; deal must DSCR.
Hard money
10% down · 12.0% · 12mo
- Down + closing
- —
- Monthly P&I
- —
- Monthly cashflow
- —
- DSCR
- —
- Eligible?
- —
Short-term bridge; refi at stabilization.
Rent comps 40 comps
| Address | Beds | Baths | Sqft | Rent | $/sqft | DOM | Units | Dist |
|---|---|---|---|---|---|---|---|---|
| 1100 8th Ave S Naples, FL | 2.0 | 2.0 | 1218 | $9,000 | $7.39 | 13d | 5 | 0.02mi |
| 980 7th Ave S Naples, FL | 1.0 | 1.0 | 540 | $7,500 | $13.89 | 23d | 2 | 0.09mi |
| 950 7th Ave S #23 Naples, FL | 1.0 | 1.0 | 631 | $3,250 | $5.15 | 13d | 1 | 0.10mi |
| 805 River Point Dr Unit 307C Naples, FL | 1.0 | 1.0 | 816 | $2,700 | $3.31 | 23d | 1 | 0.23mi |
| 801 River Point Dr Unit 303A Naples, FL | 1.0 | 1.0 | 815 | $5,000 | $6.13 | 21d | 1 | 0.24mi |
| 803 River Point Dr Unit 201B Naples, FL | 1.0 | 1.0 | 715 | $2,300 | $3.22 | 23d | 1 | 0.24mi |
| 1395 Curlew Ave Unit 4-3 Naples, FL | 2.0 | 2.0 | 975 | $7,000 | $7.18 | 23d | 1 | 0.32mi |
| 450 Bayfront Pl Naples, FL | 1.0–3.0 | 1.0–2.5 | 1324 | $8,750 | $6.61 | 23d | 6 | 0.34mi |
| 1435 Curlew Ave #1 Naples, FL | 2.0 | 2.0 | 975 | $2,850 | $2.92 | 23d | 1 | 0.36mi |
| 1435 Curlew Ave #1 Naples, FL | 2.0 | 2.0 | 975 | $2,850 | $2.92 | 21d | 1 | 0.36mi |
| 960 7th St S #103 Naples, FL | 1.0 | 1.0 | 534 | $5,000 | $9.36 | 23d | 1 | 0.36mi |
| 410 Bayfront Pl Naples, FL | 1.0–3.0 | 1.0–2.0 | 1242 | $7,875 | $6.34 | 23d | 6 | 0.37mi |
| 636 Broad Ave S Unit 1259386P Naples, FL | 2.0 | 2.0 | 882 | $4,307 | $4.88 | 13d | 1 | 0.51mi |
| 540 4th Ave S #13 Naples, FL | 1.0 | 1.0 | 580 | $5,000 | $8.62 | 23d | 1 | 0.54mi |
| 609 12th Ave S #609 Naples, FL | 2.0 | 2.0 | 860 | $8,000 | $9.30 | 23d | 1 | 0.54mi |
| 101 8th St S Naples, FL | 1.0 | 1.0–2.0 | 940 | $12,600 | $13.40 | 13d | 4 | 0.55mi |
| 101 8th St S Naples, FL | 1.0 | 1.0–2.0 | 940 | $12,600 | $13.40 | 23d | 4 | 0.55mi |
| 546 Broad Ave S #546 Naples, FL | 2.0 | 2.0 | 890 | $4,800 | $5.39 | 23d | 1 | 0.57mi |
| 480 5th St S #102 Naples, FL | 1.0 | 1.0 | 600 | $6,500 | $10.83 | 23d | 1 | 0.58mi |
| 1555 Blue Point Ave Unit 3 Naples, FL | 2.0 | 2.0 | 1025 | $1,745 | $1.70 | 13d | 1 | 0.59mi |
| 1360 Chesapeake Ave Unit 1372 Naples, FL | 1.0 | 1.0 | 600 | $1,850 | $3.08 | 23d | 1 | 0.59mi |
| 766 Central Ave Naples, FL | 2.0–3.0 | 2.0 | 855 | $6,300 | $7.37 | 21d | 3 | 0.61mi |
| 766 Central Ave Naples, FL | 2.0–3.0 | 2.0 | 943 | $5,000 | $5.30 | 13d | 4 | 0.61mi |
| 351 8th Ave S #351 Naples, FL | 2.0 | 2.0 | 930 | $4,000 | $4.30 | 23d | 1 | 0.61mi |
| 473 12th Ave S Naples, FL | 1.0–2.0 | 1.0–2.0 | 700 | $7,200 | $10.29 | 23d | 2 | 0.64mi |
| 1535 Chesapeake Ave Unit A2 Naples, FL | 2.0 | 2.0 | 1080 | $2,000 | $1.85 | 23d | 1 | 0.65mi |
| 404 Broad Ave S Unit H404 Naples, FL | 2.0 | 2.0 | 890 | $9,995 | $11.23 | 23d | 1 | 0.65mi |
| 388 4th Ave S #388 Naples, FL | 2.0 | 2.0 | 965 | $13,000 | $13.47 | 23d | 1 | 0.66mi |
| 365 5th Ave S #303 Naples, FL | 2.0 | 2.0 | 1090 | $13,000 | $11.93 | 23d | 1 | 0.66mi |
| 421 12th Ave S Unit A1 Naples, FL | 2.0 | 1.0 | 760 | $6,400 | $8.42 | 13d | 1 | 0.67mi |
| 1155 Sandpiper St Naples, FL | 2.0 | 2.0 | 1062 | $3,950 | $3.72 | 21d | 3 | 0.68mi |
| 1155 Sandpiper St Naples, FL | 2.0 | 2.0 | 1062 | $4,050 | $3.81 | 23d | 2 | 0.68mi |
| 250 7th Ave S #301 Naples, FL | 2.0 | 2.0 | 1000 | $10,000 | $10.00 | 23d | 1 | 0.69mi |
| 1686 Blue Point Ave Naples, FL | 2.0 | 2.0 | 1057 | $5,500 | $5.20 | 13d | 2 | 0.69mi |
| 666 3rd St S Naples, FL | 1.0–2.0 | 1.0–2.0 | 932 | $8,000 | $8.58 | 13d | 2 | 0.69mi |
| 1605 Chesapeake Ave #2 Naples, FL | 2.0 | 1.0 | 850 | $2,300 | $2.71 | 23d | 1 | 0.69mi |
| 940 3rd St S Naples, FL | 1.0–2.0 | 1.0–2.0 | 870 | $3,995 | $4.59 | 23d | 2 | 0.69mi |
| 291 8th Ave S Unit 291A Naples, FL | 1.0 | 1.0 | 550 | $3,900 | $7.09 | 23d | 1 | 0.71mi |
| 282 4th St S Naples, FL | 2.0 | 2.0 | 1058 | $11,000 | $10.40 | 23d | 1 | 0.71mi |
| 290 4th St S #202 Naples, FL | 2.0 | 2.0 | 1058 | $10,000 | $9.45 | 23d | 1 | 0.71mi |
Listing history 17 events
-
2026-06-18days on market $495,000 Active 139 DOM
-
2026-06-17days on market $495,000 Active 138 DOM
-
2026-06-16days on market $495,000 Active 137 DOM
-
2026-06-15days on market $495,000 Active 136 DOM
-
2026-06-10days on market $495,000 Active 131 DOM
-
2026-06-09days on market $495,000 Active 130 DOM
-
2026-06-08days on market $495,000 Active 129 DOM
-
2026-06-07days on market $495,000 Active 128 DOM
-
2026-06-02days on market $495,000 Active 123 DOM
-
2026-06-01days on market $495,000 Active 122 DOM
-
2026-05-31days on market $495,000 Active 121 DOM
-
2026-05-30days on market $495,000 Active 120 DOM
-
2026-01-30$495,000 Active
-
2025-08-07historical $1,500
-
2025-07-17$1,500
-
2023-12-26historical $8,000
-
2023-11-28$8,000
ⓘ Source: listings_history table (triggers on properties + properties_extension) + one-shot
backfill from property_details.listing_events for pre-trigger history.
Tax reassessment forecast FL · Resets to sale price
- Current annual tax
- $7,519 · $627/mo
- Projected year-2 tax
- $7,519 · $627/mo
- Expected delta
- $0/yr ($0/mo · 0.0%)
ⓘ Screening estimate from a state-policy table — verify with the county assessor before closing.
Climate risk First Street
- Flood 9/10 Extreme FEMA zone AE · 99% chance over 30 yrs
- Wildfire 3/10 Moderate
- Heat 10/10 Extreme 7 d/yr ≥107°F today · 26 d/yr by 30 yrs out
- Wind 10/10 Extreme 99% chance of damaging wind over 30 yrs
- Air quality 3/10 Moderate 3 unhealthy d/yr today · 3 by 30 yrs out
Nearby sold comps map
Loading sold comps map…
Walkable amenities ~0.75 mi
Loading nearby amenities…
Taxation est. · year 1
- Rental income
- $61,305
- − Mortgage interest
- −$27,728
- − Property taxes
- −$7,519
- − Insurance
- −$7,594
- − Repairs & maintenance
- −$4,904
- − Management
- −$4,904
- − Depreciation
- −$14,400
- Taxable loss
- −$5,744
- Est. tax savings @ 24.0%
- +$1,379
- After-tax cash flow
- $3,547/yr
For passive investors: Depreciation is non-cash, so a rental often shows a tax loss while cash-flowing — sheltering income. Rental losses are passive: they offset passive income freely, and up to $25,000/yr can offset ordinary (W-2) income if you actively participate and your MAGI is under $100k (phasing out to $0 by $150k); unused losses carry forward. On sale, claimed depreciation is recaptured at up to 25%, and gains may owe capital-gains tax (a 1031 exchange can defer both). Figures are a year-1 estimate at your 24.0% rate — not tax advice; consult a CPA.
Schools (NCES district)
- District
- Collier
- NCES district ID
- 1200330
- Math proficiency
- 60% ▼ -4.00%
- Reading proficiency
- 56% ▼ -2.00%
- Median HH income
- $58,275
- Composite
- 50.23/100
- National rank
- #1892
- State rank
- #16 of 73 in FL
Livability — Naples
- Score
- 80/100
- State rank
- #126
- US rank
- #1903
Category grades
Schools grade is shown separately in the Schools card above.
Census & demographics
- Census place
- Naples, FL
- County
- Collier County · 396,295 people
- City population
- 344,941
- Metro
- Naples-Marco Island, FL
- Population (ZIP)
- 11,179
- Household income
- $130,929
- Rent vs Own
- Severe rent burden
- 333.0
Population outlook (Collier County) Hauer SSP2
- Today (2025)
- 420,858 people
- By 2030
- 450,054 · +6.9%
- By 2040
- 502,232 · +19.3%
- By 2050
- 544,932 · +29.5%
- By 2075
- 627,203 · +49.0%
- By 2100
- 659,015 · +56.6%
Race, ethnicity, and origin ACS 2023
- Neighborhood character
- Predominantly White (79%)
- Race & ethnicity
- White 79% Hispanic / Latino 9% Two or more races 8% Black 8% Asian 1%
- Hispanic origin (detail)
- Cuban 6%
- Common ancestry
- Hispanic 4% Lithuanian 4% Romanian 4%
- Foreign-born
- 17% · Canada, China
- Languages at home
- 87% English-only · Spanish 7% French/Haitian/Cajun 4% German/W. Germanic 1%
Political lean MEDSL · Collier
- 2024 margin
- Solid R (+33.1) · D 33.1% · R 66.2%
- 2008→2024 swing
- -10.6pp toward R · 2008: -22.5pp · 2024: -33.1pp
- All cycles
- 2024: R+33.1 2020: R+24.7 2016: R+26.0 2012: R+30.1 2008: R+22.5
Not yet ingested
- Civics
- —
Market trends
- HPI YoY
- ▲ 4.08%
- Current HPI
- 328.2755
- Rent YoY
- ▲ 8.75%
- Metro
- Naples-Marco Island, FL
- State GDP YoY
- ▲ 3.28%
- F500 in state
- 36
Industry mix (Fortune 500 HQ in FL)
| Industry | F500 HQs | Revenue |
|---|---|---|
| Industrial Technology | 2 | $29B |
|
||
| Insurance | 2 | $17B |
|
||
| Retail | 1 | $60B |
|
||
| Technology Distribution | 1 | $58B |
|
||
| Homebuilding | 1 | $35B |
|
||
| Technology Manufacturing | 1 | $35B |
|
||
Price history
+6087.5% since first listed5 events — show timeline
- 2026-01-30 Listed $495,000 ForSaleByOwner.com
- 2025-08-07 Rental Removed $1,500 SHOWMOJO
- 2025-07-17 Listed for Rent $1,500 SHOWMOJO
- 2023-12-26 Rental Removed $8,000 APPFOLIO
- 2023-11-28 Listed for Rent $8,000 APPFOLIO
Property tax history
+7.5%/yrLatest (2025): $7,519 · +1.7% YoY. Source: county tax records.
Cash-flow waterfall
monthlySold comps — $/sqft
last 12 mo · ≤1 miLoading sold comps…