 Triplex
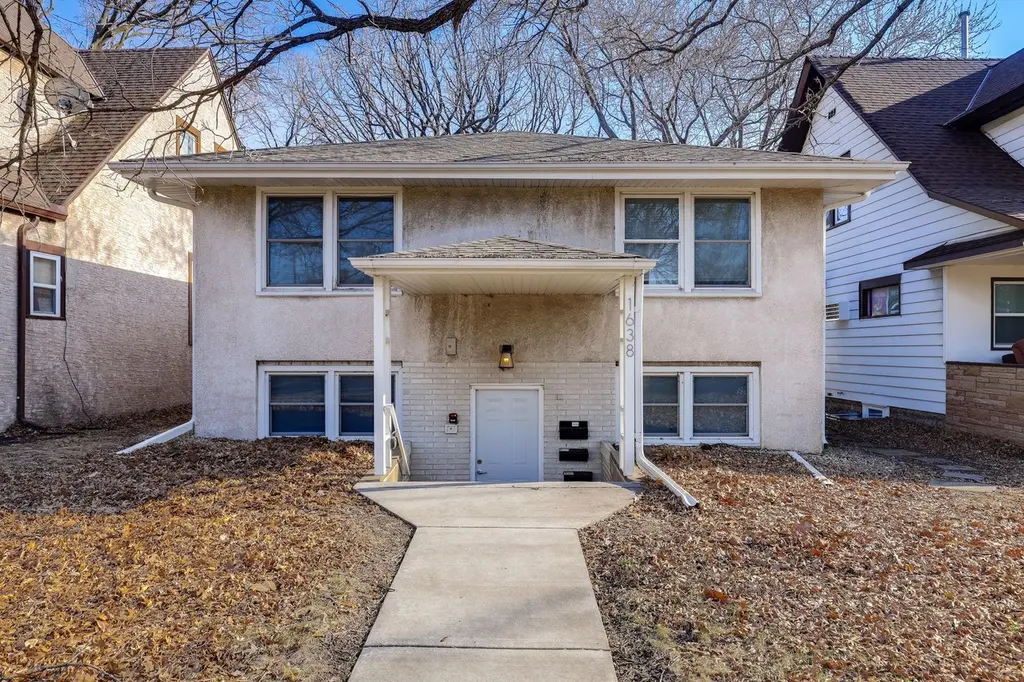
1638 Marshall Ave · St. Paul, MN
Flood risk 1/10 · Minimal
- FEMA flood zone
- X (unshaded)
- Chance of flooding over 30 yrs
- 0.0%
- Est. flood insurance / yr
- $473 – $860
Fire risk 1/10 · Minimal
- Est. fire insurance / yr
- $888 – $1,650
Heat risk 2/10 · Minimal
- Hot days now (above 99°F)
- 7 days/yr
- Hot days in 30 yrs
- 14 days/yr
Wind risk 2/10 · Minimal
- Chance of severe wind over 30 yrs
- —
Air-quality risk 2/10 · Minimal
- Unhealthy air days now
- 1 days/yr
- Unhealthy air days in 30 yrs
- 2 days/yr
Risk factors via First Street. Map © Google.
Why this score? — see what drove the C+ grade
The composite is a weighted blend of 9 inputs, each scored 0–100. Each bar is that input's sub-score; the figure is the points it added to the 100-point composite (weight × sub-score).
- Cash flow +28.1/30.0
- DSCR +10.0/10.0
- 1% rule +8.0/10.0
- ARV discount +7.5/15.0
- Rent growth +3.1/5.0
- Livability +2.5/5.0
- Condition / age +2.5/5.0
- Schools +2.4/10.0
- Appreciation +0.0/10.0
$514,900
🖨 Deal sheet 📄 Offer letter ✓ Due diligence
Multi-family units
County records classify this as Multi-Family (5+ Unit). Listing-text estimate: 3 units. estimate disagrees with records
5+ unit building — per-unit beds/baths from public records are typically unavailable; the breakdown below (if shown) is an estimate from the listing text.
Listing remarks MLS
SUPER INVESTMENT OPPORTUNITY. 3-1BR UNITS & 1 EFFICIENCY. OPEN FLOORPLANS, UPPER UNITS W/HARDWOOD FLOORS, NEW ROOF 10/08, NEWLY PAINTED INSIDE & OUT, NEW GLASS BLOCK WINDOWS, PERFECT OWNER OCCUPIED HOME! CLOSE TO ALL MAJOR ST PAUL SCHOOLS - EASY TO RENT!
Key facts
- 5,532 sq ft lot
- 4 parking spots
- Built 1959
Property features AI
Finance
- Financial info: Property offers residential income as a triplex with 3 total units; Gross income reported at $53,940; Net operating income reported at $44,340; Owner pays exterior maintenance, repairs, sewer, taxes, and water; Tenant pays cable TV, electricity, and fuel; Estimated annual expenses listed for fuel, water/sewer, trash, electric, insurance, and maintenance
Exterior
- Parking: Assigned parking spaces for units (2 for one unit, 1 for each of the other two units)
- Utilities: City water (connected); City sewer (connected); Natural gas; Electric service via Xcel Energy
- Home design: Residential income property (triplex); Two levels; Entry level includes main living areas; Asphalt roof (over 8 years old)
- Construction: Block foundation; Built with stucco exterior; Asphalt roof (age over 8 years)
- Exterior features: Stucco exterior; Public transit within six blocks; City street frontage; Publicly maintained road
Interior
- Kitchen: Dishwasher; Microwave; Range; Refrigerator; Stainless steel appliances
- Bedrooms: 6 total bedrooms (across units)
- Flooring: Hardwood floors
- Bathrooms: Multiple full bathrooms (total across units)
- Heating & cooling: Baseboard heating; Forced air heating; Central air conditioning (in at least one unit)
- Interior features: Finished full basement with block construction; Open floor plan; Granite countertops; Hardwood floors; Kitchen window
- Laundry & utility: Common area laundry on lower level
Neighborhood map
What this means for you Summary
Snapshot
- This is a 3 × 2-bed/1.3-bath units multifamily listed at $515k.
Deal economics
- At list price, monthly cash flow is $2k ($19k/yr) — positive. Per door: $540/mo.
- The deal already cash-flows at list — no discount required.
- Meets the 1% rule at list price ($7k rent vs $515k).
- Recommended offer: $507k (1.5% below list) — sets the bar for market timing.
Location & tenants
- Location reads: area grade C — affects rentability + tenant quality, not the cash-flow math above.
- St. Paul Public School District (urban): math 21% / reading 33% proficiency, ranked #270 of 301 in MN (top 90%) — low school quality limits family demand, transient renter base, plan for 1-2y turnover; 64% free/reduced lunch — lower-income household profile, screen leases tightly.
- Market conditions: Rents rising (+2.5%/yr); 191 active listings in the ZIP; solid renter incomes; 1,202 units permitted in Ramsey County in 2024 (880 in 5+ unit buildings).
- At $6,682/mo this rent would consume 106% of the median local household income ($76k/yr) (locally 2116% of renters already pay >50% of income on rent) — very limited rent-growth headroom before tenants either downsize or default.
Forward outlook
- Local home prices are declining (-3.0%/yr); year-one equity from $4k of loan paydown is wiped out by about $15k of value loss. Plan a longer hold.
- Ramsey County population projected at +27% by 2050 — long-run rental-demand tailwind backs the buy-and-hold thesis.
- At projected returns (-3.0% appreciation + 2.5% rent growth), your $144k cash investment doubles in ~9 years — after that, you're playing with house money.
Negotiation context
- It's been on market 23 days — a 2% lower offer ($507k) is reasonable based on typical stale-listing flexibility.
- 11 sale attempts since 30y ago with the ask held roughly flat each time — persistent listings suggest the price (not the market) is what's stuck; bring a comps-based counter.
- Current owner paid $255k; list at $515k implies a 102% gain — meaningful room to come down on a strong offer.
Risks & watch-outs
- Watch-outs: built in 1959 — expect roof / HVAC / electrical / plumbing capex.
Questions for the listing agent
- Can we see the unit-by-unit rent roll, current vacancy, and any below-market leases? What's the average tenancy length?
- What capital expenditures (roof, boiler, parking lot, exteriors) have been made in the last 5 years, and what's planned in the next 2?
- Built in 1959 — when were the roof, HVAC, electrical panel, plumbing, and water heater last replaced?
- Is there a deadline driving the sale (1031 exchange, divorce, estate, relocation)? That informs how much negotiation room exists.
- What's the average days-on-market for RENTAL listings here right now (not sales)? A rising rental-DOM trend means longer vacancies and softer asking-rent achievability than the comps imply.
- What's the recent tenant-quality profile in this submarket — average credit score on applications, eviction rate, late-payment / NSF rate, and stable-employment percentage? A property-management company in the area should have these aggregated.
- How much new apartment / multifamily construction is in the pipeline within 1–3 miles? Heavy new supply (>2% of stock underway) typically softens rents 12–24 months out; light construction supports rent growth.
Investment metrics
- 1% rule
- 1.30% ✓
- Cap rate
- 10.07%
- Cash-on-cash
- 13.48%
- DSCR
- 1.60
- GRM
- 6.4
CMA / ARV
No comps found within radius.
Projected returns pro-forma
-3.0% appreciation · 2.5% rent growth · sell at horizon
- IRR
- 3.0%
- Equity multiple
- 1.11×
- Total profit
- $16,521
- Equity at exit
- $76,773
- IRR
- 12.1%
- Equity multiple
- 1.93×
- Total profit
- $134,268
- Equity at exit
- $44,519
Cash invested: $144,172 (down + closing). Projections, not guarantees.
Landlord ↔ Tenant lean methodology
- Overall (STATE)
- 46 Balanced
- State Minnesota
- 46 Balanced · D+2
- County
- — inherits STATE
- City
- — inherits STATE
ZIP-level market 55104
- Rents YoY
- 2.5%
- Active inventory
- 191
- Price-to-rent
- 19.3×
Monthly cashflow live
- Estimated rent
- $6,682 medium interval (Pro) →
- Mortgage (P&I)
- −$2,700
- Tax from tax record
- −$745 /mo · $8,936/yr
- Insurance
- −$215
- HOA
- −$0
- Vacancy / Maint / Mgmt
- −$1,403
- Net cashflow
- $1,619
Break-even live
3-unit breakdown (identical units grouped — click to expand)
| Units | Beds | Baths | Est. rent |
|---|---|---|---|
| 3× units | 2 | 1.3 | $6,681 |
| #1 | 2 | 1.3 | $2,227 |
| #2 | 2 | 1.3 | $2,227 |
| #3 | 2 | 1.3 | $2,227 |
| Total (3 units) | $6,682 | ||
UW: 25.0% down · 7.5% · 30yr · 1.5% tax · 5.0% vac · 8.0% maint · 8.0% mgmt
Financing live
Cash to close
- Down payment
- $128,725
- Closing costs
- $15,447
- Reserves months
- —
- Total cash needed
- —
Loan-product check · same deal, 3 products live
Conventional
25% down · 7.5% · 30yr
- Down + closing
- —
- Monthly P&I
- —
- Monthly cashflow
- —
- DSCR
- —
- Eligible?
- —
Personal DTI + credit; lowest rate.
DSCR
20% down · 8.5% · 30yr
- Down + closing
- —
- Monthly P&I
- —
- Monthly cashflow
- —
- DSCR
- —
- Eligible?
- —
No personal income docs; deal must DSCR.
Hard money
10% down · 12.0% · 12mo
- Down + closing
- —
- Monthly P&I
- —
- Monthly cashflow
- —
- DSCR
- —
- Eligible?
- —
Short-term bridge; refi at stabilization.
Listing history 31 events
-
2026-05-14historical Contingent - Inspection 1416-char remark
-
2026-04-29$514,900 Active 1416-char remark
-
2025-07-14historical
-
2025-05-28price $519,900
-
2025-04-28price $539,900
-
2025-04-11$560,000 Active
-
2023-10-09historical $770
-
2023-09-23$770
-
2015-04-22soldstatus $255,000
-
2010-03-22soldstatus $268,500
-
2010-03-16soldstatus $268,500
Show marketing remark (262 chars)
SUPER INVESTMENT OPPORTUNITY. 3-1BR UNITS & 1 EFFICIENCY. OPEN FLOORPLANS, UPPER UNITS W/HARDWOOD FLOORS, NEW ROOF 10/08, NEWLY PAINTED INSIDE & OUT, NEW GLASS BLOCK WINDOWS, PERFECT OWNER OCCUPIED HOME! CLOSE TO ALL MAJOR ST PAUL SCHOOLS - EASY TO RENT!
-
2010-03-04historical
Show marketing remark (262 chars)
SUPER INVESTMENT OPPORTUNITY. 3-1BR UNITS & 1 EFFICIENCY. OPEN FLOORPLANS, UPPER UNITS W/HARDWOOD FLOORS, NEW ROOF 10/08, NEWLY PAINTED INSIDE & OUT, NEW GLASS BLOCK WINDOWS, PERFECT OWNER OCCUPIED HOME! CLOSE TO ALL MAJOR ST PAUL SCHOOLS - EASY TO RENT!
-
2009-10-23$298,750
Show marketing remark (262 chars)
SUPER INVESTMENT OPPORTUNITY. 3-1BR UNITS & 1 EFFICIENCY. OPEN FLOORPLANS, UPPER UNITS W/HARDWOOD FLOORS, NEW ROOF 10/08, NEWLY PAINTED INSIDE & OUT, NEW GLASS BLOCK WINDOWS, PERFECT OWNER OCCUPIED HOME! CLOSE TO ALL MAJOR ST PAUL SCHOOLS - EASY TO RENT!
-
2009-10-02historical
-
2008-11-14$298,750
-
2008-11-14historical
-
2008-10-02$279,900
-
2008-09-20historical
-
2007-09-21$289,900
-
2004-11-17soldstatus $330,000
-
2004-02-27historical
-
2004-02-06$339,900
-
2003-12-17historical
-
2003-11-20$349,000
-
2003-11-20historical
-
2003-10-31soldstatus $290,000
-
2003-10-10$349,900
-
1996-06-05soldstatus $107,500
-
1996-05-30soldstatus $107,500
-
1996-05-13historical
-
1996-04-18$109,500
ⓘ Source: listings_history table (triggers on properties + properties_extension) + one-shot
backfill from property_details.listing_events for pre-trigger history.
Tax reassessment forecast MN · Partial reset (capped growth)
- Current annual tax
- $8,936 · $745/mo
- Projected year-2 tax
- $8,936 · $745/mo
- Expected delta
- $0/yr ($0/mo · 0.0%)
ⓘ Screening estimate from a state-policy table — verify with the county assessor before closing.
Climate risk First Street
- Flood 1/10 Low FEMA zone X (unshaded) · 0% chance over 30 yrs
- Wildfire 1/10 Low
- Heat 2/10 Low 7 d/yr ≥99°F today · 14 d/yr by 30 yrs out
- Wind 2/10 Low
- Air quality 2/10 Low 1 unhealthy d/yr today · 2 by 30 yrs out
Nearby sold comps map
Loading sold comps map…
Walkable amenities ~0.75 mi
Loading nearby amenities…
Taxation est. · year 1
- Rental income
- $80,184
- − Mortgage interest
- −$28,842
- − Property taxes
- −$8,936
- − Insurance
- −$2,574
- − Repairs & maintenance
- −$6,415
- − Management
- −$6,415
- − Depreciation
- −$14,979
- Taxable income
- $12,023
- Est. tax owed @ 24.0%
- −$2,885
- After-tax cash flow
- $16,547/yr
For passive investors: Depreciation is non-cash, so a rental often shows a tax loss while cash-flowing — sheltering income. Rental losses are passive: they offset passive income freely, and up to $25,000/yr can offset ordinary (W-2) income if you actively participate and your MAGI is under $100k (phasing out to $0 by $150k); unused losses carry forward. On sale, claimed depreciation is recaptured at up to 25%, and gains may owe capital-gains tax (a 1031 exchange can defer both). Figures are a year-1 estimate at your 24.0% rate — not tax advice; consult a CPA.
Schools (NCES district)
- District
- St. Paul Public School District
- NCES district ID
- 2733840
- Math proficiency
- 21% ▼ -11.00%
- Reading proficiency
- 33% ▼ -7.00%
- Median HH income
- $48,316
- Composite
- 23.51/100
- National rank
- #7868
- State rank
- #270 of 301 in MN
Livability — St. Paul
No livability data for this city. (Only ~50 U.S. cities are tracked.)
Census & demographics
- Census place
- St. Paul, MN
- County
- Ramsey County · 542,837 people
- City population
- 280,599
- Metro
- Minneapolis-St. Paul-Bloomington, MN-WI
- Population (ZIP)
- 45,762
- Household income
- $75,712
- Rent vs Own
- Severe rent burden
- 2116.0
Population outlook (Ramsey County) Hauer SSP2
- Today (2025)
- 603,431 people
- By 2030
- 636,459 · +5.5%
- By 2040
- 700,596 · +16.1%
- By 2050
- 765,819 · +26.9%
- By 2075
- 929,297 · +54.0%
- By 2100
- 1,053,924 · +74.7%
Race, ethnicity, and origin ACS 2023
- Neighborhood character
- Diverse neighborhood (Simpson 0.60)
- Race & ethnicity
- White 60% Black 19% Two or more races 10% Asian 7% Hispanic / Latino 7%
- Hispanic origin (detail)
- Mexican 4%
- Common ancestry
- Portuguese 8% Romanian 3% Lithuanian 3%
- Foreign-born
- 12% · Canada, Vietnam, China
- Languages at home
- 83% English-only · Spanish 4% Other Asian/Pacific 4% French/Haitian/Cajun 1%
Political lean MEDSL · Ramsey
- 2024 margin
- Solid D (+43.3) · D 70.5% · R 27.2% · Other 2.3%
- 2008→2024 swing
- +9.4pp toward D · 2008: 33.9pp · 2024: 43.3pp
- All cycles
- 2024: D+43.3 2020: D+45.4 2016: D+39.4 2012: D+35.3 2008: D+33.9
Not yet ingested
- Civics
- —
Market trends
- HPI YoY
- ▼ -532.26%
- Current HPI
- 245.6146
- Rent YoY
- ▲ 2.50%
- Metro
- Minneapolis-St. Paul-Bloomington, MN-WI
- State GDP YoY
- ▲ 2.41%
- F500 in state
- 34
Industry mix (Fortune 500 HQ in MN)
| Industry | F500 HQs | Revenue |
|---|---|---|
| Healthcare | 2 | $407B |
|
||
| Retail | 2 | $150B |
|
||
| Consumer Goods | 2 | $32B |
|
||
| Industrial Machinery | 2 | $6B |
|
||
| Agriculture | 1 | $40B |
|
||
| Healthcare / Medical Devices | 1 | $32B |
|
||
Price history
+370.2% since first listed32 events — show timeline
- 2026-05-23 Pending — NORTHSTARMLS as Distributed by MLS Grid
- 2026-05-14 Contingent — NORTHSTARMLS as Distributed by MLS Grid
- 2026-04-29 Listed $514,900 NORTHSTARMLS as Distributed by MLS Grid
- 2025-07-14 Listing Removed — NORTHSTARMLS as Distributed by MLS Grid
- 2025-05-28 Price Changed $519,900 NORTHSTARMLS as Distributed by MLS Grid
- 2025-04-28 Price Changed $539,900 NORTHSTARMLS as Distributed by MLS Grid
- 2025-04-11 Listed $560,000 NORTHSTARMLS as Distributed by MLS Grid
- 2023-10-09 Rental Removed $770 APPFOLIO
- 2023-09-23 Listed for Rent $770 APPFOLIO
- 2015-04-22 Sold (Public Records) $255,000 Public Records
- 2010-03-22 Sold (Public Records) $268,500 Public Records
- 2010-03-16 Sold (MLS) $268,500 NORTHSTARMLS as Distributed by MLS Grid
- 2010-03-04 Listing Removed — NORTHSTARMLS as Distributed by MLS Grid
- 2009-10-23 Listed $298,750 NORTHSTARMLS as Distributed by MLS Grid
- 2009-10-02 Listing Removed — NORTHSTARMLS as Distributed by MLS Grid
- 2008-11-14 Listing Removed — NORTHSTARMLS as Distributed by MLS Grid
- 2008-11-14 Listed $298,750 NORTHSTARMLS as Distributed by MLS Grid
- 2008-10-02 Listed $279,900 NORTHSTARMLS as Distributed by MLS Grid
- 2008-09-20 Listing Removed — NORTHSTARMLS as Distributed by MLS Grid
- 2007-09-21 Listed $289,900 NORTHSTARMLS as Distributed by MLS Grid
- 2004-11-17 Sold (Public Records) $330,000 Public Records
- 2004-02-27 Listing Removed — NORTHSTARMLS as Distributed by MLS Grid
- 2004-02-06 Listed $339,900 NORTHSTARMLS as Distributed by MLS Grid
- 2003-12-17 Listing Removed — NORTHSTARMLS as Distributed by MLS Grid
- 2003-11-20 Listing Removed — NORTHSTARMLS as Distributed by MLS Grid
- 2003-11-20 Listed $349,000 NORTHSTARMLS as Distributed by MLS Grid
- 2003-10-31 Sold (Public Records) $290,000 Public Records
- 2003-10-10 Listed $349,900 NORTHSTARMLS as Distributed by MLS Grid
- 1996-06-05 Sold (Public Records) $107,500 Public Records
- 1996-05-30 Sold (MLS) $107,500 NORTHSTARMLS as Distributed by MLS Grid
- 1996-05-13 Listing Removed — NORTHSTARMLS as Distributed by MLS Grid
- 1996-04-18 Listed $109,500 NORTHSTARMLS as Distributed by MLS Grid
Property tax history
+4.2%/yrLatest (2025): $8,936 · +1.0% YoY. Source: county tax records.
Cash-flow waterfall
monthlySold comps — $/sqft
last 12 mo · ≤1 miLoading sold comps…