18 74TH St Unit D5 · Guttenberg, NJ
Flood risk No data
- FEMA flood zone
- —
- Chance of flooding over 30 yrs
- —
- Est. flood insurance / yr
- —
Fire risk No data
- Est. fire insurance / yr
- —
Heat risk No data
- Hot days now (above threshold)
- —
- Hot days in 30 yrs
- —
Wind risk No data
- Chance of severe wind over 30 yrs
- —
Air-quality risk No data
- Unhealthy air days now
- —
- Unhealthy air days in 30 yrs
- —
Risk factors via First Street. Map © Google.
Why this score? — see what drove the D grade
The composite is a weighted blend of 9 inputs, each scored 0–100. Each bar is that input's sub-score; the figure is the points it added to the 100-point composite (weight × sub-score).
- ARV discount +13.1/15.0
- Cash flow +10.9/30.0
- 1% rule +4.5/10.0
- Livability +4.1/5.0
- Rent growth +3.7/5.0
- DSCR +3.2/10.0
- Condition / age +2.5/5.0
- Schools +2.2/10.0
- Appreciation +0.0/10.0
$249,000
🖨 Deal sheet 📄 Offer letter ✓ Due diligence
Listing remarks MLS
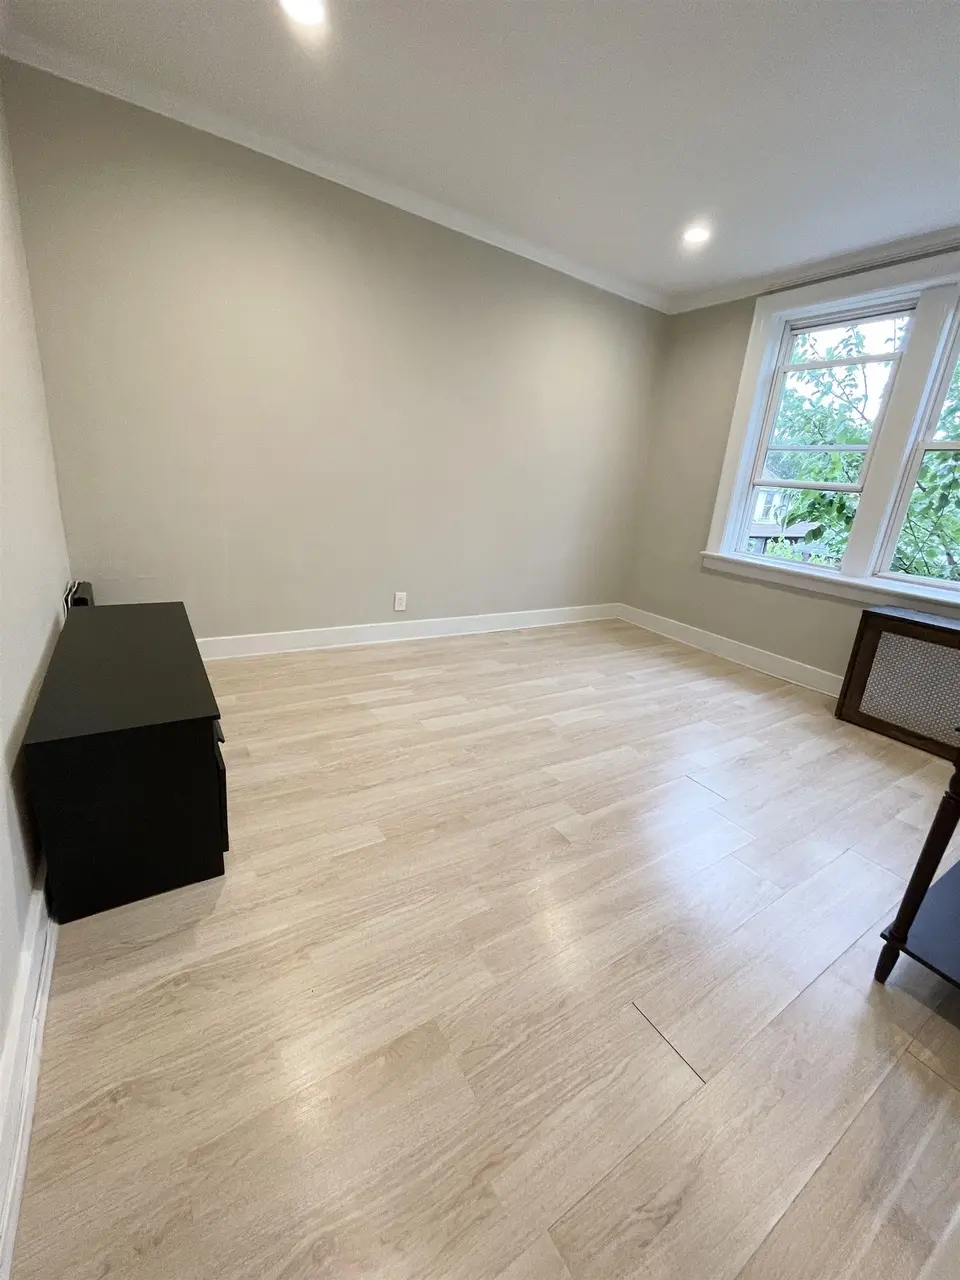
1 bedroom, top-floor apartment in a 4-story walk-up building on Blvd East. Very conveniently located steps away from transportation(NJ Transit, Shuttles to NYC/Ferry/Light Rail), Hudson County Park and Edgewater(Shopping, Dining, Entertainment, Boardwalk, etc. ). No dogs/ reptiles allowed by HOA. Completely renovated few years ago. Street parking. Deeded storage space, laundry, superintendent and computerized security intercom in the building. Heat, water/hot water included.
Key facts
- Top-floor apartment
- Deeded storage space
- Hudson county park
Tags
Neighborhood map
What this means for you Summary
Snapshot
- This is a 1-bed/1.0-bath condo listed at $249k.
Deal economics
- At list price, monthly cash flow is $-109 ($-1k/yr) — negative.
- To cash-flow at today's rent, offer at most $230k (7.7% below list).
- To meet the 1% rule (rent ≥ 1% of price), the offer needs to be $238k (4.6% below list).
- Recommended offer: $230k (7.7% below list) — sets the bar for cash-flow.
- Cap rate 5.8% vs local median 2.3% in Guttenberg — top-decile yield for the area; either an underpriced asset or a hidden risk that comps aren't pricing in. Stress-test before assuming the spread holds.
Location & tenants
- Location reads 82/100 on livability (#51 in NJ, #1,253 nationally) — a professional / high-income tenant draw. Strengths: amenities A+, commute A+, health & safety A; Watch: schools C-, cost of living F.
- North Bergen School District (suburban): math 12% / reading 37% proficiency, ranked #393 of 472 in NJ (top 83%) — low school quality limits family demand, transient renter base, plan for 1-2y turnover.
- Market conditions: Rents rising fast (+5.0%/yr); 209 active listings in the ZIP; 40 comparable units currently listed for rent nearby; rentals at typical pace (median 22d on market — plan ~3-4 weeks tenant-placement turnaround); solid renter incomes; 5,310 units permitted in Hudson County in 2024 (4,154 in 5+ unit buildings).
- This rent runs 36% of the median local income ($79k/yr) — at the standard rent-burdened threshold; future hikes will face affordability resistance.
Forward outlook
- Local home prices are declining (-3.0%/yr); year-one equity from $2k of loan paydown is wiped out by about $7k of value loss. Plan a longer hold.
- Hudson County population projected at +29% by 2050 — long-run rental-demand tailwind backs the buy-and-hold thesis.
Negotiation context
- It's been on market 63 days — a 6% lower offer ($234k) is reasonable based on typical stale-listing flexibility.
- 6 sale attempts since 24y ago with the ask held roughly flat each time — persistent listings suggest the price (not the market) is what's stuck; bring a comps-based counter.
- Current owner paid $155k; list at $249k implies a 61% gain — meaningful room to come down on a strong offer.
Risks & watch-outs
- Watch-outs: built in 1925 — expect roof / HVAC / electrical / plumbing capex.
Questions for the listing agent
- What do current leases actually rent for vs. the listed asking? Can we see a recent rent roll and the last 12 months of T-12 income?
- It's been on market 63 days. Have you received any prior offers? Is the seller open to a 8% concession, seller financing, or rate buy-down credit?
- Built in 1925 — when were the roof, HVAC, electrical panel, plumbing, and water heater last replaced?
- What does the HOA fee cover, when was the last increase, and are there any pending special assessments or reserve-fund shortfalls?
- Any open or pending special assessments — roof, HVAC, plumbing, elevator, façade? What's the per-unit balance and payoff schedule, and is the seller paying it off at close or rolling it to the buyer?
- Why hasn't it sold? Are there any deal-killer items the seller is aware of (foundation, flood, title, zoning, code violations)?
- Is there a deadline driving the sale (1031 exchange, divorce, estate, relocation)? That informs how much negotiation room exists.
- The area grade is low — what's the realistic commute time and amenity access for the typical tenant pool here? Any planned neighborhood developments (good or bad) we should know about?
- What's the average days-on-market for RENTAL listings here right now (not sales)? A rising rental-DOM trend means longer vacancies and softer asking-rent achievability than the comps imply.
- What's the recent tenant-quality profile in this submarket — average credit score on applications, eviction rate, late-payment / NSF rate, and stable-employment percentage? A property-management company in the area should have these aggregated.
- How much new apartment / multifamily construction is in the pipeline within 1–3 miles? Heavy new supply (>2% of stock underway) typically softens rents 12–24 months out; light construction supports rent growth.
Investment metrics
- 1% rule
- 0.95% ✗
- Cap rate
- 5.77%
- Cash-on-cash
- -1.87%
- DSCR
- 0.92
- GRM
- 8.7
CMA / ARV
- ARV (median comp)
- $284,508
- List price
- $249,000
- Delta
- -12.48%
- Verdict
- UNDERPRICED
- Comps
- 20 within 1.0 mi
Projected returns pro-forma
-3.0% appreciation · 4.99% rent growth · sell at horizon
- IRR
- -16.7%
- Equity multiple
- 0.39×
- Total profit
- $-42,219
- Equity at exit
- $37,127
- IRR
- -4.8%
- Equity multiple
- 0.65×
- Total profit
- $-24,131
- Equity at exit
- $21,529
Cash invested: $69,720 (down + closing). Projections, not guarantees.
Landlord ↔ Tenant lean methodology
- Overall (STATE)
- 21 Tenant-Leaning
- State New Jersey
- 21 Tenant-Leaning · D+6
- County
- — inherits STATE
- City
- — inherits STATE
ZIP-level market 07047
- Home prices YoY
- -31.5%
- Rents YoY
- 5.0%
- Active inventory
- 209
- Price-to-rent
- 8.7×
Monthly cashflow live
- Estimated rent
- $2,376 high interval (Pro) →
- Mortgage (P&I)
- −$1,306
- Tax from tax record
- −$207 /mo · $2,488/yr
- Insurance
- −$104
- HOA
- −$369
- Vacancy / Maint / Mgmt
- −$499
- Net cashflow
- $-109
Break-even live
UW: 25.0% down · 7.5% · 30yr · 1.5% tax · 5.0% vac · 8.0% maint · 8.0% mgmt
Financing live
Cash to close
- Down payment
- $62,250
- Closing costs
- $7,470
- Reserves months
- —
- Total cash needed
- —
Loan-product check · same deal, 3 products live
Conventional
25% down · 7.5% · 30yr
- Down + closing
- —
- Monthly P&I
- —
- Monthly cashflow
- —
- DSCR
- —
- Eligible?
- —
Personal DTI + credit; lowest rate.
DSCR
20% down · 8.5% · 30yr
- Down + closing
- —
- Monthly P&I
- —
- Monthly cashflow
- —
- DSCR
- —
- Eligible?
- —
No personal income docs; deal must DSCR.
Hard money
10% down · 12.0% · 12mo
- Down + closing
- —
- Monthly P&I
- —
- Monthly cashflow
- —
- DSCR
- —
- Eligible?
- —
Short-term bridge; refi at stabilization.
Rent comps 40 comps
| Address | Beds | Baths | Sqft | Rent | $/sqft | DOM | Units | Dist |
|---|---|---|---|---|---|---|---|---|
| 7601 River Rd North Bergen, NJ | 3.0 | 1.0–3.0 | 1150 | $4,303 | $3.74 | 3d | 16 | 0.16mi |
| 7606 River Rd Unit 01 North Bergen, NJ | — | 1.0 | 600 | $3,130 | $5.22 | 24d | 1 | 0.17mi |
| 116 71st St #14 Guttenberg, NJ | 2.0 | 1.0 | 700 | $2,500 | $3.57 | 7d | 1 | 0.20mi |
| 140 71st St Unit 5 Guttenberg, NJ | 1.0 | 1.0 | 500 | $1,800 | $3.60 | 7d | 1 | 0.23mi |
| 7650 River Rd Unit 921 North Bergen, NJ | — | 1.0 | 600 | $2,850 | $4.75 | 24d | 1 | 0.24mi |
| 7650 River Rd Unit 935 North Bergen, NJ | — | 1.0 | 600 | $2,800 | $4.67 | 24d | 1 | 0.24mi |
| 74 69th St Unit 3B Guttenberg, NJ | 1.0 | 1.0 | 535 | $2,050 | $3.83 | 24d | 1 | 0.27mi |
| 78 69th St Unit 9A Guttenberg, NJ | 1.0 | 1.0 | 500 | $1,800 | $3.60 | 5d | 1 | 0.28mi |
| 139 70th St Unit 3 Guttenberg, NJ | 1.0 | 1.0 | 525 | $1,775 | $3.38 | 15d | 1 | 0.29mi |
| 7602 River Rd Unit 00 Guttenberg, NJ | — | 1.0 | 600 | $2,995 | $4.99 | 24d | 1 | 0.30mi |
| 7602 River Rd Unit 302 Guttenberg, NJ | — | 1.0 | 600 | $3,100 | $5.17 | 24d | 1 | 0.30mi |
| 60 68th St Unit 406 Guttenberg, NJ | 1.0 | 1.0 | 700 | $2,600 | $3.71 | 13d | 1 | 0.33mi |
| 60 68th St Unit 505 Guttenberg, NJ | 1.0 | 1.0 | 670 | $2,550 | $3.81 | 13d | 1 | 0.33mi |
| 110 68th St Apt 2E Guttenberg, NJ | 1.0 | 1.0 | 700 | $1,800 | $2.57 | 24d | 1 | 0.34mi |
| 7812 Hudson Ave Unit B1 North Bergen, NJ | 2.0 | 1.0 | 750 | $2,100 | $2.80 | 13d | 1 | 0.35mi |
| 6710 Park Ave #205 Guttenberg, NJ | 1.0 | 1.0 | 700 | $2,550 | $3.64 | 24d | 1 | 0.36mi |
| 6710 Park Ave #203 Guttenberg, NJ | 1.0 | 1.0 | 700 | $2,500 | $3.57 | 24d | 1 | 0.36mi |
| 301 79th St Unit A9 North Bergen, NJ | 1.0 | 1.0 | 618 | $1,850 | $2.99 | 24d | 1 | 0.37mi |
| 8200 Boulevard East North Bergen, NJ | 3.0 | 1.0–3.5 | 1486 | $3,400 | $2.29 | 2d | 4 | 0.37mi |
| 311 79th St #9 North Bergen, NJ | 1.0 | 1.0 | 600 | $1,695 | $2.83 | 13d | 1 | 0.38mi |
| 310 70th St Guttenberg, NJ | 1.0 | 1.0 | 600 | $1,850 | $3.08 | 24d | 1 | 0.40mi |
| 331 79th St #15 North Bergen, NJ | 1.0 | 1.0 | 642 | $1,850 | $2.88 | 22d | 1 | 0.42mi |
| 7111 Palisade Ave North Bergen, NJ | 1.0 | 1.0 | 602 | $1,850 | $3.07 | 24d | 2 | 0.45mi |
| 8450 Boulevard E Unit 3B North Bergen, NJ | 1.0 | 1.0 | 745 | $2,400 | $3.22 | 24d | 1 | 0.46mi |
| 6515 Boulevard E Unit 10M West New York, NJ | — | 1.0 | 450 | $1,800 | $4.00 | 15d | 1 | 0.46mi |
| 6515 JFK Blvd E Unit 2J West New York, NJ | 2.0 | 1.0 | 750 | $2,300 | $3.07 | 24d | 1 | 0.46mi |
| 14 65th St #12 West New York, NJ | 2.0 | 1.0 | 600 | $2,350 | $3.92 | 7d | 1 | 0.47mi |
| 401 70th St Unit 1R Guttenberg, NJ | 1.0 | 1.0 | 525 | $1,900 | $3.62 | 4d | 1 | 0.48mi |
| 61 65th St West New York, NJ | 1.0–2.0 | 1.0 | 840 | $1,900 | $2.26 | 2d | 2 | 0.49mi |
| 8600 Boulevard E Unit 5F North Bergen, NJ | 1.0 | 1.0 | 750 | $2,500 | $3.33 | 24d | 1 | 0.50mi |
| 320 67th St Unit 2 West New York, NJ | 2.0 | 1.0 | 600 | $2,400 | $4.00 | 24d | 1 | 0.50mi |
| 8550 Boulevard E Unit 1D North Bergen, NJ | 1.0 | 1.0 | 650 | $2,200 | $3.38 | 24d | 1 | 0.52mi |
| 53 64th St #5 West New York, NJ | 1.0 | 1.0 | 600 | $2,150 | $3.58 | 7d | 1 | 0.54mi |
| 8600 Boulevard E Unit 4G North Bergen, NJ | 1.0 | 1.0 | 670 | $2,100 | $3.13 | 7d | 1 | 0.55mi |
| 6305 Kennedy Blvd E West New York, NJ | 2.0 | 1.0 | 750 | $2,725 | $3.63 | 7d | 2 | 0.57mi |
| 220 64th St Unit 10 West New York, NJ | 1.0 | 1.0 | 550 | $1,650 | $3.00 | 24d | 1 | 0.57mi |
| 7409 2nd Ave #1 North Bergen, NJ | 2.0 | 1.0 | 660 | $2,400 | $3.64 | 16d | 1 | 0.64mi |
| 6810 Polk St West New York, NJ | 1.0–2.0 | 1.0–2.0 | 962 | $2,400 | $2.49 | 22d | 2 | 0.68mi |
| 2 Main St Unit D-503 Edgewater, NJ | — | 1.0 | 600 | $2,200 | $3.67 | 24d | 1 | 0.74mi |
| 6035 Park Ave West New York, NJ | 1.0–2.0 | 1.0 | 869 | $2,325 | $2.68 | 3d | 6 | 0.74mi |
HOA detail condo
- Monthly dues
- $369 · $4,428/yr
- Likely covers
- watersecurity
- Assessments
- None detected in remarks — confirm with the listing agent.
Listing history 29 events
-
2026-06-18days on market $249,000 Active 63 DOM
-
2026-06-17days on market $249,000 Active 62 DOM
-
2026-06-16days on market $249,000 Active 61 DOM
-
2026-06-15days on market $249,000 Active 60 DOM
-
2026-06-13days on market $249,000 Active 58 DOM
-
2026-06-09days on market $249,000 Active 54 DOM
-
2026-06-08days on market $249,000 Active 53 DOM
-
2026-06-07days on market $249,000 Active 52 DOM
-
2026-06-04days on market $249,000 Active 49 DOM
-
2026-06-03days on market $249,000 Active 48 DOM
-
2026-06-02days on market $249,000 Active 47 DOM
-
2026-06-01days on market $249,000 Active 46 DOM
-
2026-05-31days on market $249,000 Active 45 DOM
-
2026-04-16$249,000 Active 479-char remark
Show marketing remark (479 chars)
1 bedroom, top-floor apartment in a 4-story walk-up building on Blvd East. Very conveniently located steps away from transportation(NJ Transit, Shuttles to NYC/Ferry/Light Rail), Hudson County Park and Edgewater(Shopping, Dining, Entertainment, Boardwalk, etc. ). No dogs/ reptiles allowed by HOA. Completely renovated few years ago. Street parking. Deeded storage space, laundry, superintendent and computerized security intercom in the building. Heat, water/hot water included.
-
2025-08-20historical
-
2025-05-29$249,900 Active
-
2016-07-09price $155,000
-
2016-06-15soldstatus $155,000 Sold
-
2016-04-04historical Under Contract
-
2016-03-30price $165,000
-
2016-02-15$165,000 Active
-
2014-04-01historical
-
2013-11-12$165,000
-
2010-06-11historical
-
2009-06-10$199,000
-
2004-02-27soldstatus $105,000
-
2003-03-30historical
-
2002-08-08$95,000
-
1997-03-07soldstatus $30,000
ⓘ Source: listings_history table (triggers on properties + properties_extension) + one-shot
backfill from property_details.listing_events for pre-trigger history.
Tax reassessment forecast NJ · Partial reset (capped growth)
- Current annual tax
- $2,488 · $207/mo
- Projected year-2 tax
- $4,344 · $362/mo
- Expected delta
- +$1,856/yr (+$155/mo · 74.6%)
ⓘ Screening estimate from a state-policy table — verify with the county assessor before closing.
Nearby sold comps map
Loading sold comps map…
Walkable amenities ~0.75 mi
Loading nearby amenities…
Taxation est. · year 1
- Rental income
- $28,514
- − Mortgage interest
- −$13,948
- − Property taxes
- −$2,488
- − Insurance
- −$1,245
- − Repairs & maintenance
- −$2,281
- − Management
- −$2,281
- − HOA
- −$4,428
- − Depreciation
- −$7,244
- Taxable loss
- −$5,400
- Est. tax savings @ 24.0%
- +$1,296
- After-tax cash flow
- $-8/yr
For passive investors: Depreciation is non-cash, so a rental often shows a tax loss while cash-flowing — sheltering income. Rental losses are passive: they offset passive income freely, and up to $25,000/yr can offset ordinary (W-2) income if you actively participate and your MAGI is under $100k (phasing out to $0 by $150k); unused losses carry forward. On sale, claimed depreciation is recaptured at up to 25%, and gains may owe capital-gains tax (a 1031 exchange can defer both). Figures are a year-1 estimate at your 24.0% rate — not tax advice; consult a CPA.
Schools (NCES district)
- District
- North Bergen School District
- NCES district ID
- 3411460
- Math proficiency
- 12% ▼ -16.00%
- Reading proficiency
- 37% ▼ -10.00%
- Median HH income
- $54,275
- Composite
- 21.95/100
- National rank
- #8221
- State rank
- #393 of 472 in NJ
Livability — Guttenberg
- Score
- 82/100
- State rank
- #51
- US rank
- #1253
Category grades
Schools grade is shown separately in the Schools card above.
Census & demographics
- County
- Hudson County · 718,323 people
- Metro
- New York-Newark-Jersey City, NY-NJ-PA
- Population (ZIP)
- 61,250
- Household income
- $78,911
- Rent vs Own
- Severe rent burden
- 3908.0
Population outlook (Hudson County) Hauer SSP2
- Today (2025)
- 771,834 people
- By 2030
- 818,028 · +6.0%
- By 2040
- 907,866 · +17.6%
- By 2050
- 994,480 · +28.8%
- By 2075
- 1,163,301 · +50.7%
- By 2100
- 1,254,703 · +62.6%
Race, ethnicity, and origin ACS 2023
- Neighborhood character
- Predominantly Hispanic (69%)
- Race & ethnicity
- Hispanic / Latino 69% Two or more races 26% White 20% Asian 7% Black 3% Native American 1%
- Hispanic origin (detail)
- Mexican 2% Puerto Rican 7% Cuban 11% Dominican 12%
- Common ancestry
- Romanian 1% Lithuanian 1%
- Foreign-born
- 50% · Canada, Jamaica, South Korea
- Languages at home
- 27% English-only · Spanish 61% Other Indo-European 4% Arabic 3%
Political lean MEDSL · Hudson
- 2024 margin
- Strong D (+28.1) · D 62.6% · R 34.6% · Other 2.8%
- 2008→2024 swing
- -18.7pp toward R · 2008: 46.7pp · 2024: 28.1pp
- All cycles
- 2024: D+28.1 2020: D+46.2 2016: D+51.8 2012: D+55.7 2008: D+46.7
Not yet ingested
- Civics
- —
Market trends
- HPI YoY
- ▼ -192.36%
- Current HPI
- 419.0283
- Rent YoY
- ▲ 4.99%
- Metro
- New York-Newark-Jersey City, NY-NJ-PA
- State GDP YoY
- ▲ 2.05%
- F500 in state
- 34
Industry mix (Fortune 500 HQ in NJ)
| Industry | F500 HQs | Revenue |
|---|---|---|
| Consumer Goods | 3 | $31B |
|
||
| Pharmaceuticals | 2 | $153B |
|
||
| Technology | 2 | $21B |
|
||
| Insurance | 2 | $20B |
|
||
| Healthcare | 2 | $19B |
|
||
| Financial Services | 1 | $70B |
|
||
Price history
+730.0% since first listed16 events — show timeline
- 2026-04-16 Listed $249,000 HCMLS
- 2025-08-20 Listing Removed — HCMLS
- 2025-05-29 Listed $249,900 HCMLS
- 2016-07-09 Price Changed $155,000 HCMLS
- 2016-06-15 Sold (MLS) $155,000 HCMLS
- 2016-04-04 Contingent — HCMLS
- 2016-03-30 Price Changed $165,000 HCMLS
- 2016-02-15 Listed $165,000 HCMLS
- 2014-04-01 Listing Removed — HCMLS
- 2013-11-12 Listed $165,000 HCMLS
- 2010-06-11 Listing Removed — HCMLS
- 2009-06-10 Listed $199,000 HCMLS
- 2004-02-27 Sold (Public Records) $105,000 Public Records
- 2003-03-30 Listing Removed — HCMLS
- 2002-08-08 Listed $95,000 HCMLS
- 1997-03-07 Sold (Public Records) $30,000 Public Records
Property tax history
+2.2%/yrLatest (2020): $2,488 · +0.1% YoY. Source: county tax records.
Cash-flow waterfall
monthlySold comps — $/sqft
last 12 mo · ≤1 miLoading sold comps…