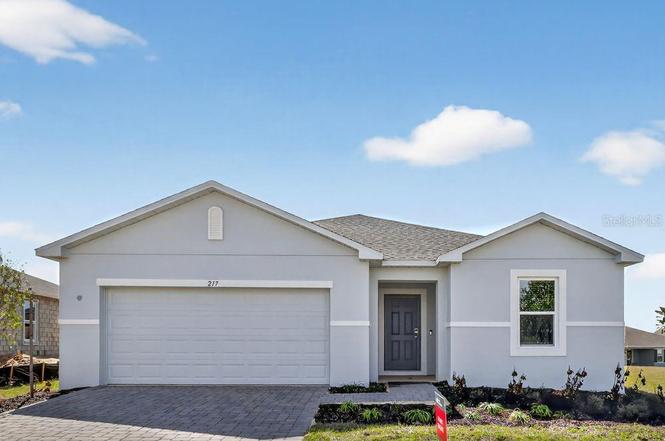
217 Streamwater Way · Mascotte, FL
Flood risk No data
- FEMA flood zone
- —
- Chance of flooding over 30 yrs
- —
- Est. flood insurance / yr
- —
Fire risk No data
- Est. fire insurance / yr
- —
Heat risk No data
- Hot days now (above threshold)
- —
- Hot days in 30 yrs
- —
Wind risk No data
- Chance of severe wind over 30 yrs
- —
Air-quality risk No data
- Unhealthy air days now
- —
- Unhealthy air days in 30 yrs
- —
Risk factors via First Street. Map © Google.
Why this score? — see what drove the F grade
The composite is a weighted blend of 9 inputs, each scored 0–100. Each bar is that input's sub-score; the figure is the points it added to the 100-point composite (weight × sub-score).
- Cash flow +7.8/30.0
- ARV discount +7.5/15.0
- Schools +4.2/10.0
- Livability +3.6/5.0
- Rent growth +2.9/5.0
- Condition / age +2.5/5.0
- 1% rule +2.0/10.0
- DSCR +1.9/10.0
- Appreciation +0.0/10.0
$376,000
🖨 Deal sheet (PDF) 📄 Offer letter ✓ Due diligence
Listing remarks
What's Special: Larger Lot | White Cabinets | Large Kitchen Island | Covered Patio. New Construction - Ready Now! Built by Taylor Morrison, America's Most Trusted Home Builder. Welcome to the Cypress at 217 Streamwater Way in Waterstone. This cozy new single-story home feels warm and inviting from the moment you step inside. You’ll appreciate the seamless flow between the great room, dining room, and kitchen, creating an open space that’s both practical and stylish. The kitchen features quartz countertops, 36" cabinets, a walk-in pantry, and a spacious island designed to make everyday cooking and casual gatherings feel effortless. Sliding doors lead you out to the covered l
Key facts
- Large kitchen island
- Covered patio
- Covered lanai
Tags
Neighborhood map
What this means for you Summary
Snapshot
- This is a 4-bed/2.0-bath land listed at $376k.
Deal economics
- At list price, monthly cash flow is $-421 ($-5k/yr) — negative.
- To cash-flow at today's rent, offer at most $302k (19.8% below list).
- To meet the 1% rule (rent ≥ 1% of price), the offer needs to be $263k (30.0% below list).
- Recommended offer: $263k (30.0% below list) — sets the bar for 1% rule.
Location & tenants
- Location reads 71/100 on livability (#405 in FL) — a middle-class / working-renter tenant base. Strengths: cost of living A+, housing A+, health & safety A+; Watch: amenities F, commute F.
- Lake (suburban): math 49% / reading 50% proficiency, ranked #37 of 73 in FL (top 51%) — families likely to look elsewhere, expect single-tenant / working-renter base with shorter leases.
- Zoned schools: Groveland Elementary School (math 30% / reading 32%, grade F, #1,854 of 2,144 statewide, top 87%, 744 students, 63% FRL); South Lake High School (math 36% / reading 39%, grade F, #336 of 667 statewide, top 51%, 2,169 students, 40% FRL) — zoned schools at 52% FRL track the district average.
- Zoned-school proficiency averages 34% at this address vs 50% district-wide (-15 pts) — the specific schools serving this property underperform the Lake average; the district grade overstates school quality for this exact location.
- Market conditions: Rents rising (+1.7%/yr); 585 active listings in the ZIP; 7 comparable units currently listed for rent nearby; rentals at typical pace (median 21d on market — plan ~3-4 weeks tenant-placement turnaround); solid renter incomes; 4,799 units permitted in Lake County in 2024 (814 in 5+ unit buildings).
- This rent runs 35% of the median local income ($91k/yr) — at the standard rent-burdened threshold; future hikes will face affordability resistance.
Forward outlook
- Local home prices are declining (-3.0%/yr); year-one equity from $3k of loan paydown is wiped out by about $11k of value loss. Plan a longer hold.
- Lake County population projected at +37% by 2050 — long-run rental-demand tailwind backs the buy-and-hold thesis.
Negotiation context
- It's been on market 90 days — a 6% lower offer ($353k) is reasonable based on typical stale-listing flexibility.
Questions for the listing agent
- What do current leases actually rent for vs. the listed asking? Can we see a recent rent roll and the last 12 months of T-12 income?
- It's been on market 90 days. Have you received any prior offers? Is the seller open to a 30% concession, seller financing, or rate buy-down credit?
- What does the HOA fee cover, when was the last increase, and are there any pending special assessments or reserve-fund shortfalls?
- Why hasn't it sold? Are there any deal-killer items the seller is aware of (foundation, flood, title, zoning, code violations)?
- Is there a deadline driving the sale (1031 exchange, divorce, estate, relocation)? That informs how much negotiation room exists.
- Schools are D-rated, which usually means shorter tenancies and higher turnover. Who's the typical renter profile here, and what's been the actual vacancy rate?
- The area grade is low — what's the realistic commute time and amenity access for the typical tenant pool here? Any planned neighborhood developments (good or bad) we should know about?
- What's the average days-on-market for RENTAL listings here right now (not sales)? A rising rental-DOM trend means longer vacancies and softer asking-rent achievability than the comps imply.
- What's the recent tenant-quality profile in this submarket — average credit score on applications, eviction rate, late-payment / NSF rate, and stable-employment percentage? A property-management company in the area should have these aggregated.
- How much new for-sale + rental construction is in the pipeline within 1–3 miles? Heavy new supply typically softens prices + rents 12–24 months out; constrained supply supports both.
Investment metrics
- 1% rule
- 0.70% ✗
- Cap rate
- 4.95%
- Cash-on-cash
- -4.80%
- DSCR
- 0.79
- GRM
- 11.9
CMA / ARV
No comps found within radius.
Projected returns pro-forma
-3.0% appreciation · 1.67% rent growth · sell at horizon
- IRR
- -25.9%
- Equity multiple
- 0.13×
- Total profit
- $-91,224
- Equity at exit
- $56,063
- IRR
- -27.1%
- Equity multiple
- -0.21×
- Total profit
- $-127,914
- Equity at exit
- $32,510
Cash invested: $105,280 (down + closing). Projections, not guarantees.
Landlord ↔ Tenant lean methodology
- Overall (STATE)
- 87 Strongly Landlord-Friendly
- State Florida
- 87 Strongly Landlord-Friendly · R+3
- County
- — inherits STATE
- City
- — inherits STATE
ZIP-level market 34736
- Home prices YoY
- -22.5%
- Rents YoY
- 1.7%
- Active inventory
- 585
- Price-to-rent
- 11.9×
Monthly cashflow live
- Estimated rent
- $2,631 high interval (Pro) →
- Mortgage (P&I)
- −$1,972
- Tax from tax record
- −$254 /mo · $3,044/yr
- Insurance
- −$157
- HOA
- −$117
- Vacancy / Maint / Mgmt
- −$552
- Net cashflow
- $-421
Break-even live
Sensitivity live
| Price | -10% $-208 | -5% $-314 | +0% $-421 | +5% $-527 | +10% $-634 |
|---|---|---|---|---|---|
| Rent | -10% $-629 | -5% $-525 | +0% $-421 | +5% $-317 | +10% $-213 |
| Rate | -1.0pp $-231 | -0.5pp $-325 | base $-421 | +0.5pp $-518 | +1.0pp $-617 |
UW: 25.0% down · 7.5% · 30yr · 1.5% tax · 5.0% vac · 8.0% maint · 8.0% mgmt
Financing live
Cash to close
- Down payment
- $94,000
- Closing costs
- $11,280
- Reserves months
- —
- Total cash needed
- —
Loan-product check · same deal, 3 products live
Conventional
25% down · 7.5% · 30yr
- Down + closing
- —
- Monthly P&I
- —
- Monthly cashflow
- —
- DSCR
- —
- Eligible?
- —
Personal DTI + credit; lowest rate.
DSCR
20% down · 8.5% · 30yr
- Down + closing
- —
- Monthly P&I
- —
- Monthly cashflow
- —
- DSCR
- —
- Eligible?
- —
No personal income docs; deal must DSCR.
Hard money
10% down · 12.0% · 12mo
- Down + closing
- —
- Monthly P&I
- —
- Monthly cashflow
- —
- DSCR
- —
- Eligible?
- —
Short-term bridge; refi at stabilization.
Rent comps 7 comps
| Address | Beds | Baths | Sqft | Rent | $/sqft | DOM | Units | Dist |
|---|---|---|---|---|---|---|---|---|
| 7201 Big Cedar Aly Groveland, FL | 3.0 | 2.5 | 1500 | $2,000 | $1.33 | 24d | 1 | 0.46mi |
| 338 Ridgemark Ave Groveland, FL | 4.0 | 2.0 | 1824 | $2,300 | $1.26 | 5d | 1 | 0.52mi |
| 187 Hydra Way Groveland, FL | 4.0 | 3.0 | 2542 | $2,699 | $1.06 | 24d | 1 | 0.75mi |
| 201 Sangmon Ct Groveland, FL | 3.0 | 2.5 | 1920 | $2,299 | $1.20 | 5d | 1 | 0.80mi |
| 6612 Tempo Way Mascotte, FL | 3.0 | 2.0 | 1990 | $2,600 | $1.31 | 5d | 1 | 1.11mi |
| 2009 Sloans Outlook Dr Groveland, FL | 3.0 | 2.0 | 1670 | $2,250 | $1.35 | 20d | 1 | 1.16mi |
| 6337 Chorus Dr Groveland, FL | 3.0 | 2.0 | 1772 | $2,250 | $1.27 | 24d | 1 | 1.41mi |
HOA detail
- Monthly dues
- $117 · $1,404/yr
- Likely covers
- water
Listing history 16 events
-
2026-06-18days on market $376,000 Active 90 DOM
-
2026-06-17days on market $376,000 Active 89 DOM
-
2026-06-16days on market $376,000 Active 88 DOM
-
2026-06-15days on market $376,000 Active 87 DOM
-
2026-06-13days on market $376,000 Active 85 DOM
-
2026-06-09days on market $376,000 Active 81 DOM
-
2026-06-08days on market $376,000 Active 80 DOM
-
2026-06-07days on market $376,000 Active 79 DOM
-
2026-06-04days on market $376,000 Active 76 DOM
-
2026-06-03days on market $376,000 Active 75 DOM
-
2026-06-02pricedays on market $376,000 Active 74 DOM
-
2026-06-01days on market $421,239 Active 73 DOM
-
2026-05-31days on market $421,239 Active 72 DOM
-
2026-03-31status Pending
-
2026-01-22$373,239 Active
-
2025-04-07soldstatus $4,281,319
ⓘ Source: listings_history table (triggers on properties + properties_extension) + one-shot
backfill from property_details.listing_events for pre-trigger history.
Tax reassessment forecast FL · Resets to sale price
- Current annual tax
- $3,044 · $254/mo
- Projected year-2 tax
- $3,121 · $260/mo
- Expected delta
- +$77/yr (+$6/mo · 2.5%)
ⓘ Screening estimate from a state-policy table — verify with the county assessor before closing.
Nearby sold comps map
Loading sold comps map…
Walkable amenities ~0.75 mi
Loading nearby amenities…
Taxation est. · year 1
- Rental income
- $31,570
- − Mortgage interest
- −$21,062
- − Property taxes
- −$3,044
- − Insurance
- −$1,880
- − Repairs & maintenance
- −$2,526
- − Management
- −$2,526
- − HOA
- −$1,404
- − Depreciation
- −$10,938
- Taxable loss
- −$11,810
- Est. tax savings @ 24.0%
- +$2,834
- After-tax cash flow
- $-2,215/yr
For passive investors: Depreciation is non-cash, so a rental often shows a tax loss while cash-flowing — sheltering income. Rental losses are passive: they offset passive income freely, and up to $25,000/yr can offset ordinary (W-2) income if you actively participate and your MAGI is under $100k (phasing out to $0 by $150k); unused losses carry forward. On sale, claimed depreciation is recaptured at up to 25%, and gains may owe capital-gains tax (a 1031 exchange can defer both). Figures are a year-1 estimate at your 24.0% rate — not tax advice; consult a CPA.
Schools (NCES district)
- District
- Lake
- NCES district ID
- 1201050
- Math proficiency
- 49% ▼ -7.00%
- Reading proficiency
- 50% ▼ -4.00%
- Median HH income
- $46,632
- Composite
- 42.05/100
- National rank
- #3327
- State rank
- #37 of 73 in FL
Livability — Mascotte
- Score
- 71/100
- State rank
- #405
- US rank
- #7156
Category grades
Schools grade is shown separately in the Schools card above.
Census & demographics
- Census place
- Mascotte, FL
- County
- Lake County · 364,602 people
- City population
- 33,565
- Metro
- Orlando-Kissimmee-Sanford, FL
- Population (ZIP)
- 28,001
- Household income
- $90,545
- Rent vs Own
- Severe rent burden
- 216.0
Population outlook (Lake County) Hauer SSP2
- Today (2025)
- 386,640 people
- By 2030
- 417,107 · +7.9%
- By 2040
- 476,676 · +23.3%
- By 2050
- 531,296 · +37.4%
- By 2075
- 648,303 · +67.7%
- By 2100
- 698,530 · +80.7%
Race, ethnicity, and origin ACS 2023
- Neighborhood character
- Diverse neighborhood (Simpson 0.65)
- Race & ethnicity
- White 52% Hispanic / Latino 25% Two or more races 17% Black 15% Asian 4%
- Hispanic origin (detail)
- Mexican 3% Puerto Rican 15% Cuban 2%
- Common ancestry
- Romanian 2% Hispanic 2% Lithuanian 1%
- Foreign-born
- 13% · Canada, Guatemala
- Languages at home
- 81% English-only · Spanish 14% French/Haitian/Cajun 2% Other Indo-European 1%
Political lean MEDSL · Lake
- 2024 margin
- Strong R (+24.7) · D 37.3% · R 62.0%
- 2008→2024 swing
- -11.2pp toward R · 2008: -13.5pp · 2024: -24.7pp
- All cycles
- 2024: R+24.7 2020: R+20.0 2016: R+23.1 2012: R+17.1 2008: R+13.5
Not yet ingested
- Civics
- —
Market trends
- HPI YoY
- ▼ -77.23%
- Current HPI
- 265.3457
- Rent YoY
- ▲ 1.67%
- Metro
- Orlando-Kissimmee-Sanford, FL
- State GDP YoY
- ▲ 3.28%
- F500 in state
- 36
Industry mix (Fortune 500 HQ in FL)
| Industry | F500 HQs | Revenue |
|---|---|---|
| Industrial Technology | 2 | $29B |
|
||
| Insurance | 2 | $17B |
|
||
| Retail | 1 | $60B |
|
||
| Technology Distribution | 1 | $58B |
|
||
| Homebuilding | 1 | $35B |
|
||
| Technology Manufacturing | 1 | $35B |
|
||
Price history
-91.3% since first listed3 events — show timeline
- 2026-03-31 Pending — Stellar MLS as Distributed by MLS Grid
- 2026-01-22 Listed $373,239 Stellar MLS as Distributed by MLS Grid
- 2025-04-07 Sold (Public Records) $4,281,319 Public Records
Cash-flow waterfall
monthlySold comps — $/sqft
last 12 mo · ≤1 miLoading sold comps…