 🏷️ Likely Rental
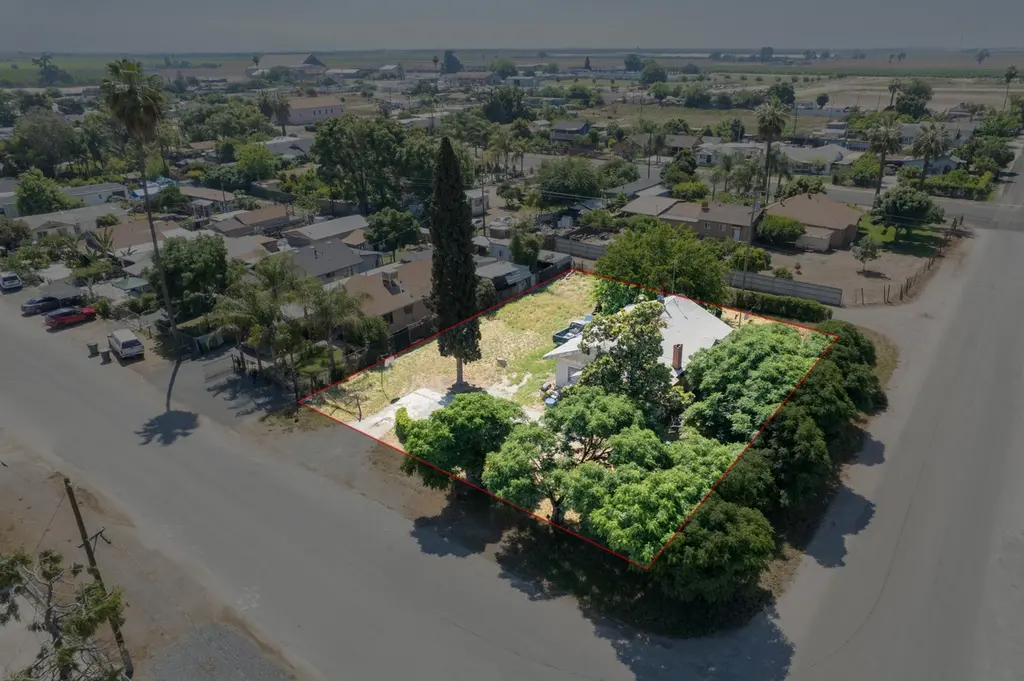
16611 Oak Ave · Woodville, CA
Flood risk 1/10 · Minimal
- FEMA flood zone
- X (unshaded)
- Chance of flooding over 30 yrs
- 0.0%
- Est. flood insurance / yr
- $507 – $1,088
Fire risk 7/10 · Major
- Est. fire insurance / yr
- $659 – $1,223
Heat risk 8/10 · Major
- Hot days now (above 106°F)
- 7 days/yr
- Hot days in 30 yrs
- 18 days/yr
Wind risk 1/10 · Minimal
- Chance of severe wind over 30 yrs
- —
Air-quality risk 10/10 · Severe
- Unhealthy air days now
- 34 days/yr
- Unhealthy air days in 30 yrs
- 39 days/yr
Risk factors via First Street. Map © Google.
Why this score? — see what drove the C+ grade
The composite is a weighted blend of 9 inputs, each scored 0–100. Each bar is that input's sub-score; the figure is the points it added to the 100-point composite (weight × sub-score).
- Cash flow +30.0/30.0
- DSCR +10.0/10.0
- 1% rule +8.2/10.0
- ARV discount +7.5/15.0
- Rent growth +3.2/5.0
- Condition / age +2.5/5.0
- Livability +2.4/5.0
- Schools +1.0/10.0
- Appreciation +0.0/10.0
$129,000
🖨 Deal sheet 📄 Offer letter ✓ Due diligence
Listing remarks
Investment opportunity! This 2-bedroom, 1-bath home is being sold with a tenant in place, offering immediate rental income potential. Buyer to assume the existing tenancy at the close of escrow. Being sold as is!
Key facts
- 0.32 acre lot
- Built 1920
- Listed 13 days
Property features AI
Exterior
- Utilities: Water connected; Sewer connected; Water source: Other; Sewer type: Other
- Home design: Single-family residence; Single story
- Construction: Built as residential single-family property
- Exterior features: Composition roof; Irregular-shaped lot
Interior
- Bathrooms: 1 full bathroom
- Heating & cooling: Has heating; Has cooling; Heating type: Other; Cooling type: Other
- Interior features: Has heating; Has cooling; Cooling type: Other; Heating type: Other
Neighborhood map
What this means for you Summary
Snapshot
- This is a 2-bed/1.0-bath single-family listed at $129k.
Deal economics
- At list price, monthly cash flow is $562 ($7k/yr) — positive.
- The deal already cash-flows at list — no discount required.
- Meets the 1% rule at list price ($2k rent vs $129k).
Location & tenants
- Location reads 48/100 on livability (#1,191 in CA) — a working-class tenant base; expect higher turnover. Strengths: housing A-, crime B; Watch: schools F, amenities F, commute D-.
- Woodville Union Elementary (rural): math 9% / reading 16% proficiency, ranked #500 of 517 in CA (top 97%) — low school quality limits family demand, transient renter base, plan for 1-2y turnover; 92% free/reduced lunch — lower-income household profile, screen leases tightly.
- Market conditions: Rents rising (+2.7%/yr); 352 active listings in the ZIP; 1,447 units permitted in Tulare County in 2024 (307 in 5+ unit buildings).
Forward outlook
- Local home prices are declining (-3.0%/yr); year-one equity from $892 of loan paydown is wiped out by about $4k of value loss. Plan a longer hold.
- Tulare County population projected at +10% by 2050 — modest demand growth; plan on rents tracking national, not racing it.
- At projected returns (-3.0% appreciation + 2.7% rent growth), your $36k cash investment doubles in ~7 years — after that, you're playing with house money.
Negotiation context
- Only 13 days on market — expect competitive offers; lowballing is unlikely to land.
Risks & watch-outs
- Watch-outs: built in 1920 — expect roof / HVAC / electrical / plumbing capex.
- Climate carrying-cost: major wildfire risk; extreme-heat days projected 7→18/yr by 2055 (HVAC capex compounding) — expect insurance premiums to compound above CPI over the hold.
Questions for the listing agent
- Built in 1920 — when were the roof, HVAC, electrical panel, plumbing, and water heater last replaced?
- Is there a deadline driving the sale (1031 exchange, divorce, estate, relocation)? That informs how much negotiation room exists.
- Schools are F-rated, which usually means shorter tenancies and higher turnover. Who's the typical renter profile here, and what's been the actual vacancy rate?
- What's the average days-on-market for RENTAL listings here right now (not sales)? A rising rental-DOM trend means longer vacancies and softer asking-rent achievability than the comps imply.
- What's the recent tenant-quality profile in this submarket — average credit score on applications, eviction rate, late-payment / NSF rate, and stable-employment percentage? A property-management company in the area should have these aggregated.
- How much new for-sale + rental construction is in the pipeline within 1–3 miles? Heavy new supply typically softens prices + rents 12–24 months out; constrained supply supports both.
Investment metrics
- 1% rule
- 1.32% ✓
- Cap rate
- 11.52%
- Cash-on-cash
- 18.67%
- DSCR
- 1.83
- GRM
- 6.3
CMA / ARV
- ARV (on-the-fly)
- $290,560
- Comps found
- 4
Show comp detail 4 sales within ~0.75 mi
| Address | Dist | Beds/Ba | Sqft | Sold | Price | $/sf | Match |
|---|---|---|---|---|---|---|---|
| 16870 Cloverdale Rd | 0.20mi | 3/1.0 (+1) | 1,140 (+0%) | 5mo | $275,000 | $241 | 81 |
| 16436 Ave 166 | 0.26mi | 2/1.0 | 1,092 (-4%) | 11mo | $280,000 | $256 | 72 |
| 16710 Oak Ave | 0.13mi | 3/2.0 (+1) | 1,093 (-4%) | 10mo | $200,000 | $183 | 70 |
| 16364 Avenue 168 | 0.32mi | 3/3.0 (+1) | 1,248 (+10%) | 14mo | $325,000 | $260 | 44 |
Match score weights: distance 35% · size 25% · config 20% · recency 20%. Top-matched comps best support the ARV.
Projected returns pro-forma
-3.0% appreciation · 2.67% rent growth · sell at horizon
- IRR
- 10.1%
- Equity multiple
- 1.40×
- Total profit
- $14,279
- Equity at exit
- $19,234
- IRR
- 18.9%
- Equity multiple
- 2.55×
- Total profit
- $56,053
- Equity at exit
- $11,154
Cash invested: $36,120 (down + closing). Projections, not guarantees.
Landlord ↔ Tenant lean methodology
- Overall (STATE)
- 18 Strongly Tenant-Friendly
- State California
- 18 Strongly Tenant-Friendly · D+13
- County
- — inherits STATE
- City
- — inherits STATE
ZIP-level market 93274
- Rents YoY
- 2.7%
- Active inventory
- 352
- Price-to-rent
- 6.3×
Monthly cashflow live
- Estimated rent
- $1,705 medium interval (Pro) →
- Mortgage (P&I)
- −$676
- Tax from tax record
- −$55 /mo · $655/yr
- Insurance
- −$54
- HOA
- −$0
- Vacancy / Maint / Mgmt
- −$358
- Net cashflow
- $562
Break-even live
UW: 25.0% down · 7.5% · 30yr · 1.5% tax · 5.0% vac · 8.0% maint · 8.0% mgmt
Financing live
Cash to close
- Down payment
- $32,250
- Closing costs
- $3,870
- Reserves months
- —
- Total cash needed
- —
Loan-product check · same deal, 3 products live
Conventional
25% down · 7.5% · 30yr
- Down + closing
- —
- Monthly P&I
- —
- Monthly cashflow
- —
- DSCR
- —
- Eligible?
- —
Personal DTI + credit; lowest rate.
DSCR
20% down · 8.5% · 30yr
- Down + closing
- —
- Monthly P&I
- —
- Monthly cashflow
- —
- DSCR
- —
- Eligible?
- —
No personal income docs; deal must DSCR.
Hard money
10% down · 12.0% · 12mo
- Down + closing
- —
- Monthly P&I
- —
- Monthly cashflow
- —
- DSCR
- —
- Eligible?
- —
Short-term bridge; refi at stabilization.
Listing history 11 events
-
2026-06-18days on market $129,000 Active 13 DOM
-
2026-06-17days on market $129,000 Active 12 DOM
-
2026-06-16days on market $129,000 Active 11 DOM
-
2026-06-15days on market $129,000 Active 10 DOM
-
2026-06-14days on market $129,000 Active 8 DOM
-
2026-06-13days on market $129,000 Active 7 DOM
-
2026-06-10days on market $129,000 Active 5 DOM
-
2026-06-09days on market $129,000 Active 4 DOM
-
2026-06-08days on market $129,000 Active 3 DOM
-
2026-06-07remarks 212-char remark
-
2026-06-07$129,000 Active 2 DOM
ⓘ Source: listings_history table (triggers on properties + properties_extension) + one-shot
backfill from property_details.listing_events for pre-trigger history.
Tax reassessment forecast CA · Resets to sale price
- Current annual tax
- $655 · $55/mo
- Projected year-2 tax
- $980 · $82/mo
- Expected delta
- +$326/yr (+$27/mo · 49.7%)
ⓘ Screening estimate from a state-policy table — verify with the county assessor before closing.
Climate risk First Street
- Flood 1/10 Low FEMA zone X (unshaded) · 0% chance over 30 yrs
- Wildfire 7/10 Severe
- Heat 8/10 Severe 7 d/yr ≥106°F today · 18 d/yr by 30 yrs out
- Wind 1/10 Low
- Air quality 10/10 Extreme 34 unhealthy d/yr today · 39 by 30 yrs out
Nearby sold comps map
Loading sold comps map…
Walkable amenities ~0.75 mi
Loading nearby amenities…
Taxation est. · year 1
- Rental income
- $20,456
- − Mortgage interest
- −$7,226
- − Property taxes
- −$655
- − Insurance
- −$645
- − Repairs & maintenance
- −$1,636
- − Management
- −$1,636
- − Depreciation
- −$3,753
- Taxable income
- $4,905
- Est. tax owed @ 24.0%
- −$1,177
- After-tax cash flow
- $5,565/yr
For passive investors: Depreciation is non-cash, so a rental often shows a tax loss while cash-flowing — sheltering income. Rental losses are passive: they offset passive income freely, and up to $25,000/yr can offset ordinary (W-2) income if you actively participate and your MAGI is under $100k (phasing out to $0 by $150k); unused losses carry forward. On sale, claimed depreciation is recaptured at up to 25%, and gains may owe capital-gains tax (a 1031 exchange can defer both). Figures are a year-1 estimate at your 24.0% rate — not tax advice; consult a CPA.
Schools (NCES district)
- District
- Woodville Union Elementary
- NCES district ID
- 0643170
- Math proficiency
- 9% ▼ -12.00%
- Reading proficiency
- 16% ▼ -3.00%
- Median HH income
- $29,332
- Composite
- 9.7/100
- National rank
- #9832
- State rank
- #500 of 517 in CA
Livability — Woodville
- Score
- 48/100
- State rank
- #1191
- US rank
- #26031
Category grades
Schools grade is shown separately in the Schools card above.
Census & demographics
- Census place
- Woodville, CA
- County
- Tulare County · 323,826 people
- Metro
- Visalia, CA
- Population (ZIP)
- 80,026
- Household income
- $72,650
- Rent vs Own
- Severe rent burden
- 2393.0
Population outlook (Tulare County) Hauer SSP2
- Today (2025)
- 484,681 people
- By 2030
- 496,241 · +2.4%
- By 2040
- 518,507 · +7.0%
- By 2050
- 534,920 · +10.4%
- By 2075
- 548,417 · +13.2%
- By 2100
- 513,085 · +5.9%
Race, ethnicity, and origin ACS 2023
- Neighborhood character
- Majority Hispanic (64%)
- Race & ethnicity
- Hispanic / Latino 64% White 29% Two or more races 24% Asian 2% Black 2%
- Hispanic origin (detail)
- Mexican 60%
- Common ancestry
- Russian 7% Iranian 1% Italian 1%
- Foreign-born
- 19% · Canada, Vietnam
- Languages at home
- 52% English-only · Spanish 42% Other Indo-European 3% Other Asian/Pacific 1%
Political lean MEDSL · Tulare
- 2024 margin
- Strong R (+20.7) · D 38.5% · R 59.2% · Other 2.3%
- 2008→2024 swing
- -5.4pp toward R · 2008: -15.3pp · 2024: -20.7pp
- All cycles
- 2024: R+20.7 2020: R+7.8 2016: R+12.1 2012: R+17.8 2008: R+15.3
Not yet ingested
- Civics
- —
Market trends
- HPI YoY
- ▼ -402.03%
- Current HPI
- 316.0806
- Rent YoY
- ▲ 2.67%
- Metro
- Visalia, CA
- State GDP YoY
- ▲ 3.21%
- F500 in state
- 116
Industry mix (Fortune 500 HQ in CA)
| Industry | F500 HQs | Revenue |
|---|---|---|
| Technology | 27 | $1,492B |
|
||
| Financial Services | 3 | $174B |
|
||
| Retail | 3 | $44B |
|
||
| Insurance | 3 | $26B |
|
||
| Media / Entertainment | 2 | $115B |
|
||
| Pharmaceuticals / Biotech | 2 | $62B |
|
||
Price history
1 event — show timeline
- 2026-06-05 Listed $129,000 TCMLS
Property tax history
+8.9%/yrLatest (2025): $655 · +1.6% YoY. Source: county tax records.
Cash-flow waterfall
monthlySold comps — $/sqft
last 12 mo · ≤1 miLoading sold comps…