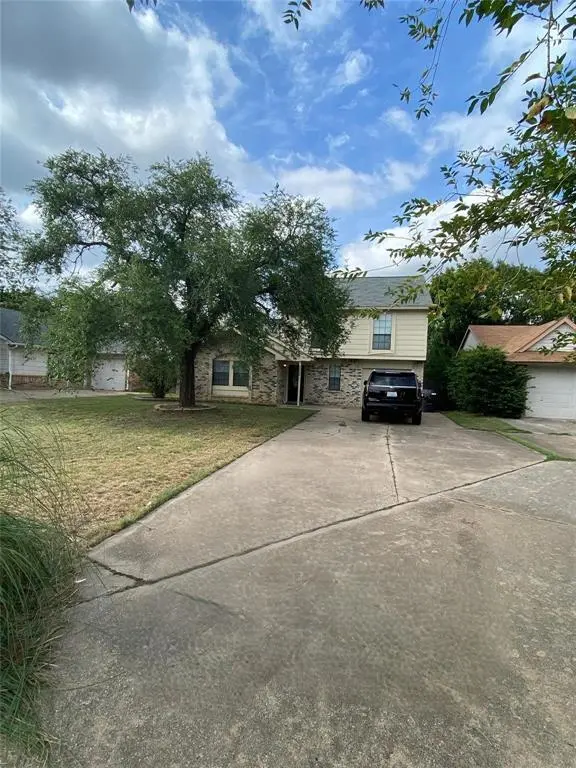
6722 Oriole Ct · Fort Worth, TX
Flood risk 1/10 · Minimal
- FEMA flood zone
- X (unshaded)
- Chance of flooding over 30 yrs
- 0.0%
- Est. flood insurance / yr
- $507 – $1,088
Fire risk 3/10 · Minor
- Est. fire insurance / yr
- $1,222 – $2,270
Heat risk 8/10 · Major
- Hot days now (above 109°F)
- 7 days/yr
- Hot days in 30 yrs
- 24 days/yr
Wind risk 4/10 · Minor
- Chance of severe wind over 30 yrs
- 19.0%
Air-quality risk 4/10 · Minor
- Unhealthy air days now
- 4 days/yr
- Unhealthy air days in 30 yrs
- 5 days/yr
Risk factors via First Street. Map © Google.
Why this score? — see what drove the D- grade
The composite is a weighted blend of 9 inputs, each scored 0–100. Each bar is that input's sub-score; the figure is the points it added to the 100-point composite (weight × sub-score).
- ARV discount +12.8/15.0
- Cash flow +8.0/30.0
- Schools +4.8/10.0
- Livability +4.0/5.0
- 1% rule +3.6/10.0
- Condition / age +2.5/5.0
- Rent growth +2.2/5.0
- DSCR +2.0/10.0
- Appreciation +0.0/10.0
$220,000
🖨 Deal sheet (PDF) 📄 Offer letter ✓ Due diligence
Listing remarks MLS
Calling all investors! Excellent opportunity to acquire a cash flowing property! This 3 bedroom, 2.5 bath home with a 1 car garage is currently tenant occupied at $1,825 per month, with a lease secured through November 30, 2026, providing immediate and stable income. Situated on a quiet culdesac, the property features a functional floor plan and a fenced backyard, desirable amenities that support long term tenant retention. The established lease eliminates upfront vacancy costs and makes this a strong addition to any rental portfolio. Whether you’re expanding your holdings or completing a 1031 exchange, this property offers predictable cash flow and long term upside in a growing Fort Worth market. Contact listing agent for lease details and additional financial information. Can be sold individually or part of a 3 property package. MLS numbers 21213521, 21213324, 21213298.
Key facts
- Tenant occupied
- Quiet culdesac
- Fenced backyard
Tags
Neighborhood map
What this means for you Summary
Snapshot
- This is a 3-bed/2.0-bath single-family listed at $220k.
Deal economics
- At list price, monthly cash flow is $-227 ($-3k/yr) — negative.
- To cash-flow at today's rent, offer at most $180k (18.2% below list).
- To meet the 1% rule (rent ≥ 1% of price), the offer needs to be $190k (13.7% below list).
- Recommended offer: $180k (18.2% below list) — sets the bar for cash-flow.
- Cap rate 5.1% vs local median 3.9% in Fort Worth — meaningfully above typical; check what's discounted (condition, days-on-market, listing class) to confirm the premium yield is real.
Location & tenants
- Location reads 80/100 on livability (#49 in TX, #1,954 nationally) — a professional / high-income tenant draw. Strengths: amenities A+, cost of living A+, housing A+; Watch: crime F.
- Keller ISD (urban): math 50% / reading 54% proficiency, ranked #91 of 826 in TX (top 11%) — acceptable for families but not a draw, mixed tenant base, ~2y average lease; only 19% free/reduced lunch — higher-income household profile.
- Zoned schools: Parkview El (math 34% / reading 36%, grade F, #1,965 of 4,322 statewide, top 46%, 668 students, 64% FRL); Fossil Hill Middle (math 32% / reading 43%, grade F, #736 of 1,662 statewide, top 45%, 838 students, 61% FRL); Fossil Ridge H S (math 41% / reading 55%, grade D, #571 of 1,632 statewide, top 36%, 2,329 students, 51% FRL) — zoned schools average 59% FRL vs 19% district-wide (40 pts higher); higher-poverty schools than district average — tighter screening recommended.
- Market conditions: Rents soft (-1.4%/yr); 212 active listings in the ZIP; 40 comparable units currently listed for rent nearby; rentals at typical pace (median 17d on market — plan ~3-4 weeks tenant-placement turnaround); solid renter incomes; 18,938 units permitted in Tarrant County in 2024 (8,336 in 5+ unit buildings).
Forward outlook
- Local home prices are declining (-3.0%/yr); year-one equity from $2k of loan paydown is wiped out by about $7k of value loss. Plan a longer hold.
- Tarrant County population projected at +41% by 2050 — long-run rental-demand tailwind backs the buy-and-hold thesis.
Negotiation context
- It's been on market 89 days — a 6% lower offer ($207k) is reasonable based on typical stale-listing flexibility.
Risks & watch-outs
- Watch-outs: property tax is 2.6% of price.
- Climate carrying-cost: extreme-heat days projected 7→24/yr by 2055 (HVAC capex compounding) — expect insurance premiums to compound above CPI over the hold.
Questions for the listing agent
- What do current leases actually rent for vs. the listed asking? Can we see a recent rent roll and the last 12 months of T-12 income?
- It's been on market 89 days. Have you received any prior offers? Is the seller open to a 18% concession, seller financing, or rate buy-down credit?
- Property tax is high relative to price — has the assessment been appealed recently, and will the sale trigger a re-assessment?
- Why hasn't it sold? Are there any deal-killer items the seller is aware of (foundation, flood, title, zoning, code violations)?
- Is there a deadline driving the sale (1031 exchange, divorce, estate, relocation)? That informs how much negotiation room exists.
- Schools are D-rated, which usually means shorter tenancies and higher turnover. Who's the typical renter profile here, and what's been the actual vacancy rate?
- Crime grade is F in this area — have there been break-ins, vandalism, or insurance claims at this property in the last 3 years? What carrier currently insures it and at what premium?
- The area grade is low — what's the realistic commute time and amenity access for the typical tenant pool here? Any planned neighborhood developments (good or bad) we should know about?
- What's the average days-on-market for RENTAL listings here right now (not sales)? A rising rental-DOM trend means longer vacancies and softer asking-rent achievability than the comps imply.
- What's the recent tenant-quality profile in this submarket — average credit score on applications, eviction rate, late-payment / NSF rate, and stable-employment percentage? A property-management company in the area should have these aggregated.
- How much new for-sale + rental construction is in the pipeline within 1–3 miles? Heavy new supply typically softens prices + rents 12–24 months out; constrained supply supports both.
Investment metrics
- 1% rule
- 0.86% ✗
- Cap rate
- 5.06%
- Cash-on-cash
- -4.42%
- DSCR
- 0.80
- GRM
- 9.7
CMA / ARV
- ARV (median comp)
- $249,485
- List price
- $220,000
- Delta
- -11.82%
- Verdict
- UNDERPRICED
- Comps
- 20 within 1.0 mi
Show comp detail 12 sales within ~0.75 mi
| Address | Dist | Beds/Ba | Sqft | Sold | Price | $/sf | Match |
|---|---|---|---|---|---|---|---|
| 6713 Haltom Rd | 0.10mi | 3/2.0 | 1,407 (+2%) | 5mo | $267,000 | $190 | 88 |
| 4748 Moss Rose Dr | 0.28mi | 3/2.0 | 1,416 (+3%) | 1mo | $260,000 | $184 | 82 |
| 4409 Aspen Way | 0.38mi | 3/2.0 | 1,401 (+2%) | 2mo | $274,900 | $196 | 78 |
| 4701 Moss Rose Dr | 0.34mi | 3/2.0 | 1,414 (+3%) | 7mo | $265,000 | $187 | 74 |
| 4733 Rose Of Sharon Ln | 0.26mi | 3/2.0 | 1,268 (-8%) | 4mo | $275,000 | $217 | 71 |
| 4508 Estes Park Rd | 0.50mi | 3/2.0 | 1,444 (+5%) | 1mo | $268,000 | $186 | 68 |
| 4840 Thistledown Dr | 0.22mi | 3/2.0 | 1,186 (-14%) | 8mo | $260,000 | $219 | 60 |
| 4657 Cripple Creek Rd | 0.63mi | 3/2.0 | 1,269 (-8%) | 7mo | $263,000 | $207 | 52 |
| 4621 Riverpark Dr | 0.64mi | 3/2.0 | 1,238 (-10%) | 2mo | $239,000 | $193 | 51 |
| 4804 Davy Crockett Trl | 0.68mi | 3/2.0 | 1,512 (+10%) | 3mo | $315,000 | $208 | 50 |
| 4779 Wineberry Dr | 0.57mi | 3/2.0 | 1,188 (-14%) | 5mo | $185,000 | $156 | 47 |
| 4228 Longleaf Ln | 0.68mi | 3/2.0 | 1,529 (+11%) | 8mo | $259,000 | $169 | 44 |
Match score weights: distance 35% · size 25% · config 20% · recency 20%. Top-matched comps best support the ARV.
Projected returns pro-forma
-3.0% appreciation · 0.0% rent growth · sell at horizon
- IRR
- -27.6%
- Equity multiple
- 0.10×
- Total profit
- $-55,510
- Equity at exit
- $32,803
- IRR
- -45.8%
- Equity multiple
- -0.43×
- Total profit
- $-87,819
- Equity at exit
- $19,022
Cash invested: $61,600 (down + closing). Projections, not guarantees.
Landlord ↔ Tenant lean methodology
- Overall (STATE)
- 87 Strongly Landlord-Friendly
- State Texas
- 87 Strongly Landlord-Friendly · R+5
- County
- — inherits STATE
- City
- — inherits STATE
ZIP-level market 76137
- Home prices YoY
- -28.8%
- Rents YoY
- -1.4%
- Active inventory
- 212
- Price-to-rent
- 9.7×
Monthly cashflow live
- Estimated rent
- $1,899 high interval (Pro) →
- Mortgage (P&I)
- −$1,154
- Tax from tax record
- −$481 /mo · $5,778/yr
- Insurance
- −$92
- HOA
- −$0
- Lot rent
- −$0
- Vacancy / Maint / Mgmt
- −$399
- Net cashflow
- $-227
Break-even live
Sensitivity live
| Price | -10% $-102 | -5% $-165 | +0% $-227 | +5% $-289 | +10% $-351 |
|---|---|---|---|---|---|
| Rent | -10% $-377 | -5% $-302 | +0% $-227 | +5% $-152 | +10% $-77 |
| Rate | -1.0pp $-116 | -0.5pp $-171 | base $-227 | +0.5pp $-284 | +1.0pp $-342 |
UW: 25.0% down · 7.5% · 30yr · 1.5% tax · 5.0% vac · 8.0% maint · 8.0% mgmt
Financing live
Cash to close
- Down payment
- $55,000
- Closing costs
- $6,600
- Reserves months
- —
- Total cash needed
- —
Loan-product check · same deal, 3 products live
Conventional
25% down · 7.5% · 30yr
- Down + closing
- —
- Monthly P&I
- —
- Monthly cashflow
- —
- DSCR
- —
- Eligible?
- —
Personal DTI + credit; lowest rate.
DSCR
20% down · 8.5% · 30yr
- Down + closing
- —
- Monthly P&I
- —
- Monthly cashflow
- —
- DSCR
- —
- Eligible?
- —
No personal income docs; deal must DSCR.
Hard money
10% down · 12.0% · 12mo
- Down + closing
- —
- Monthly P&I
- —
- Monthly cashflow
- —
- DSCR
- —
- Eligible?
- —
Short-term bridge; refi at stabilization.
Rent comps 40 comps
| Address | Beds | Baths | Sqft | Rent | $/sqft | DOM | Units | Dist |
|---|---|---|---|---|---|---|---|---|
| 4740 Western Center Blvd Haltom City, TX | 2.0 | 2.0 | 1102 | $1,355 | $1.23 | 46d | 1 | 0.13mi |
| 6841 Black Wing Dr Fort Worth, TX | 3.0 | 2.0 | 1367 | $1,970 | $1.44 | 19d | 1 | 0.17mi |
| 6733 Dandelion Dr Fort Worth, TX | 3.0 | 1.5 | 1236 | $1,895 | $1.53 | 46d | 1 | 0.17mi |
| 6733 Dandelion Dr Fort Worth, TX | 3.0 | 1.5 | 1236 | $1,895 | $1.53 | 16d | 1 | 0.17mi |
| 6713 Windwillow Dr Fort Worth, TX | 2.0 | 1.0 | 1009 | $1,850 | $1.83 | 14d | 1 | 0.21mi |
| 6701 Windwillow Dr Fort Worth, TX | 3.0 | 2.0 | 1007 | $1,695 | $1.68 | 26d | 1 | 0.22mi |
| 6701 Windwillow Dr Fort Worth, TX | 3.0 | 2.0 | 1007 | $1,695 | $1.68 | 21d | 1 | 0.22mi |
| 6806 Silver Sage Dr Fort Worth, TX | 3.0 | 2.0 | 1500 | $2,100 | $1.40 | 46d | 1 | 0.23mi |
| 6921 Black Wing Dr Fort Worth, TX | 3.0 | 2.0 | 1508 | $2,025 | $1.34 | 5d | 1 | 0.25mi |
| 6909 Club Creek Dr Fort Worth, TX | 3.0 | 2.0 | 1592 | $2,050 | $1.29 | 26d | 1 | 0.26mi |
| 4716 Rose of Sharon Ln Fort Worth, TX | 3.0 | 2.0 | 1176 | $2,095 | $1.78 | 17d | 1 | 0.28mi |
| 4916 Lodgepole Ln Fort Worth, TX | 3.0 | 2.5 | 1872 | $2,350 | $1.26 | 46d | 1 | 0.38mi |
| 4621 Rose of Sharon Ln Fort Worth, TX | 3.0 | 2.0 | 1118 | $1,800 | $1.61 | 20d | 1 | 0.38mi |
| 6954 Teal Dr Fort Worth, TX | 3.0 | 2.0 | 1798 | $2,190 | $1.22 | 7d | 1 | 0.44mi |
| 6960 N Beach St Fort Worth, TX | 1.0–3.0 | 1.0–2.0 | 908 | $1,929 | $2.12 | 1d | 29 | 0.50mi |
| 7224 Indiana Ave Fort Worth, TX | 3.0 | 2.0 | 1805 | $2,050 | $1.14 | 1d | 1 | 0.52mi |
| 4617 Aspen Way Haltom City, TX | 3.0 | 2.0 | 1208 | $1,850 | $1.53 | 7d | 1 | 0.54mi |
| 4617 Aspen Way Haltom City, TX | 3.0 | 2.0 | 1208 | $1,850 | $1.53 | 10d | 1 | 0.54mi |
| 4779 Wineberry Dr Fort Worth, TX | 3.0 | 2.0 | 1188 | $2,050 | $1.73 | 46d | 1 | 0.58mi |
| 7000 N Beach St Fort Worth, TX | 2.0 | 2.0 | 971 | $1,659 | $1.71 | 46d | 1 | 0.59mi |
| 7321 Indiana Ave Fort Worth, TX | 3.0 | 2.0 | 1805 | $1,989 | $1.10 | 46d | 1 | 0.60mi |
| 6111 N Beach St Fort Worth, TX | 2.0 | 2.0 | 1200 | $1,648 | $1.37 | 17d | 1 | 0.62mi |
| 6111 N Beach St Unit 6144 Fort Worth, TX | 3.0 | 2.0 | 1390 | $2,041 | $1.47 | 0d | 1 | 0.62mi |
| 6111 N Beach St Fort Worth, TX | 2.0 | 2.0 | 1185 | $1,678 | $1.42 | 10d | 1 | 0.62mi |
| 6111 N Beach St Fort Worth, TX | 2.0 | 2.0 | 1270 | $2,032 | $1.60 | 5d | 1 | 0.62mi |
| 6111 N Beach St Unit 6168 Fort Worth, TX | 2.0 | 2.0 | 1200 | $1,481 | $1.23 | 46d | 1 | 0.62mi |
| 6111 N Beach St Unit 6148 Fort Worth, TX | 2.0 | 2.0 | 1185 | $1,427 | $1.20 | 0d | 1 | 0.62mi |
| 6111 N Beach St Fort Worth, TX | 3.0 | 2.0 | 1390 | $1,830 | $1.32 | 1d | 1 | 0.62mi |
| 7000 N Beach St Unit 7023 Fort Worth, TX | 2.0 | 2.0 | 1050 | $1,784 | $1.70 | 0d | 1 | 0.62mi |
| 7000 N Beach St Unit 7037 Fort Worth, TX | 2.0 | 2.0 | 1050 | $1,684 | $1.60 | 46d | 1 | 0.62mi |
| 7000 N Beach St Unit 7057 Fort Worth, TX | 2.0 | 2.0 | 879 | $1,504 | $1.71 | 15d | 1 | 0.62mi |
| 7000 N Beach St Unit 7037 Fort Worth, TX | 2.0 | 2.0 | 879 | $1,504 | $1.71 | 16d | 1 | 0.62mi |
| 4704 Aspen Way Haltom City, TX | 3.0 | 2.0 | 1379 | $2,025 | $1.47 | 10d | 1 | 0.63mi |
| 6901 N Beach St Fort Worth, TX | 1.0–3.0 | 1.0–2.0 | 855 | $1,596 | $1.87 | 46d | 1 | 0.64mi |
| 4621 Riverpark Dr Fort Worth, TX | 3.0 | 2.0 | 1238 | $1,800 | $1.45 | 13d | 1 | 0.67mi |
| 7432 Blackthorn Dr Fort Worth, TX | 3.0 | 2.0 | 1444 | $1,995 | $1.38 | 6d | 1 | 0.76mi |
| 4113 Chestnut St Fort Worth, TX | 3.0 | 2.0 | 1624 | $2,100 | $1.29 | 4d | 1 | 0.79mi |
| 6744 Geyser Trl Watauga, TX | 3.0 | 2.0 | 1628 | $2,250 | $1.38 | 4d | 1 | 0.80mi |
| 4648 Birchbend Ln Fort Worth, TX | 3.0 | 2.0 | 1322 | $1,850 | $1.40 | 24d | 1 | 0.84mi |
| 4741 Birchbend Ln Fort Worth, TX | 3.0 | 2.0 | 1313 | $1,850 | $1.41 | 16d | 1 | 0.86mi |
Listing history 22 events
-
2026-06-18days on market $220,000 Active 89 DOM
-
2026-06-17days on market $220,000 Active 88 DOM
-
2026-06-16days on market $220,000 Active 87 DOM
-
2026-06-15days on market $220,000 Active 86 DOM
-
2026-06-13days on market $220,000 Active 84 DOM
-
2026-06-09days on market $220,000 Active 80 DOM
-
2026-06-08days on market $220,000 Active 79 DOM
-
2026-06-07days on market $220,000 Active 78 DOM
-
2026-06-04days on market $220,000 Active 75 DOM
-
2026-06-03days on market $220,000 Active 74 DOM
-
2026-06-02days on market $220,000 Active 73 DOM
-
2026-06-01days on market $220,000 Active 72 DOM
-
2026-05-31days on market $220,000 Active 71 DOM
-
2026-05-14price $220,000 907-char remark
Show marketing remark (907 chars)
Calling all investors! Excellent opportunity to acquire a cash flowing property! This 3 bedroom, 2.5 bath home with a 1 car garage is currently tenant occupied at $1,825 per month, with a lease secured through November 30, 2026, providing immediate and stable income. Situated on a quiet culdesac, the property features a functional floor plan and a fenced backyard, desirable amenities that support long term tenant retention. The established lease eliminates upfront vacancy costs and makes this a strong addition to any rental portfolio. Whether you’re expanding your holdings or completing a 1031 exchange, this property offers predictable cash flow and long term upside in a growing Fort Worth market. Contact listing agent for lease details and additional financial information. Can be sold individually or part of a 3 property package. MLS numbers 21213521, 21213324, 21213298.
-
2026-04-15price $225,000 907-char remark
Show marketing remark (907 chars)
Calling all investors! Excellent opportunity to acquire a cash flowing property! This 3 bedroom, 2.5 bath home with a 1 car garage is currently tenant occupied at $1,825 per month, with a lease secured through November 30, 2026, providing immediate and stable income. Situated on a quiet culdesac, the property features a functional floor plan and a fenced backyard, desirable amenities that support long term tenant retention. The established lease eliminates upfront vacancy costs and makes this a strong addition to any rental portfolio. Whether you’re expanding your holdings or completing a 1031 exchange, this property offers predictable cash flow and long term upside in a growing Fort Worth market. Contact listing agent for lease details and additional financial information. Can be sold individually or part of a 3 property package. MLS numbers 21213521, 21213324, 21213298.
-
2026-03-20$235,000 Active 907-char remark
Show marketing remark (907 chars)
Calling all investors! Excellent opportunity to acquire a cash flowing property! This 3 bedroom, 2.5 bath home with a 1 car garage is currently tenant occupied at $1,825 per month, with a lease secured through November 30, 2026, providing immediate and stable income. Situated on a quiet culdesac, the property features a functional floor plan and a fenced backyard, desirable amenities that support long term tenant retention. The established lease eliminates upfront vacancy costs and makes this a strong addition to any rental portfolio. Whether you’re expanding your holdings or completing a 1031 exchange, this property offers predictable cash flow and long term upside in a growing Fort Worth market. Contact listing agent for lease details and additional financial information. Can be sold individually or part of a 3 property package. MLS numbers 21213521, 21213324, 21213298.
-
2016-05-13soldstatus
-
2015-11-19soldstatus
-
2015-10-27soldstatus
-
1998-02-25soldstatus
-
1998-02-25soldstatus
-
1984-10-10soldstatus
ⓘ Source: listings_history table (triggers on properties + properties_extension) + one-shot
backfill from property_details.listing_events for pre-trigger history.
Tax reassessment forecast TX · Resets to sale price
- Current annual tax
- $5,778 · $481/mo
- Projected year-2 tax
- $5,778 · $481/mo
- Expected delta
- $0/yr ($0/mo · 0.0%)
ⓘ Screening estimate from a state-policy table — verify with the county assessor before closing.
Climate risk First Street
- Flood 1/10 Low FEMA zone X (unshaded) · 0% chance over 30 yrs
- Wildfire 3/10 Moderate
- Heat 8/10 Severe 7 d/yr ≥109°F today · 24 d/yr by 30 yrs out
- Wind 4/10 Moderate 19% chance of damaging wind over 30 yrs
- Air quality 4/10 Moderate 4 unhealthy d/yr today · 5 by 30 yrs out
Nearby sold comps map
Loading sold comps map…
Walkable amenities ~0.75 mi
Loading nearby amenities…
Taxation est. · year 1
- Rental income
- $22,784
- − Mortgage interest
- −$12,323
- − Property taxes
- −$5,778
- − Insurance
- −$1,100
- − Repairs & maintenance
- −$1,823
- − Management
- −$1,823
- − Depreciation
- −$6,400
- Taxable loss
- −$6,463
- Est. tax savings @ 24.0%
- +$1,551
- After-tax cash flow
- $-1,172/yr
For passive investors: Depreciation is non-cash, so a rental often shows a tax loss while cash-flowing — sheltering income. Rental losses are passive: they offset passive income freely, and up to $25,000/yr can offset ordinary (W-2) income if you actively participate and your MAGI is under $100k (phasing out to $0 by $150k); unused losses carry forward. On sale, claimed depreciation is recaptured at up to 25%, and gains may owe capital-gains tax (a 1031 exchange can defer both). Figures are a year-1 estimate at your 24.0% rate — not tax advice; consult a CPA.
Schools (NCES district)
- District
- Keller ISD
- NCES district ID
- 4825260
- Math proficiency
- 50% ▼ -14.00%
- Reading proficiency
- 54% ▼ -9.00%
- Median HH income
- $92,106
- Composite
- 48.46/100
- National rank
- #2131
- State rank
- #91 of 826 in TX
Livability — Fort Worth
- Score
- 80/100
- State rank
- #49
- US rank
- #1954
Category grades
Schools grade is shown separately in the Schools card above.
Census & demographics
- Census place
- Fort Worth, TX
- County
- Tarrant County · 2,033,669 people
- City population
- 911,619
- Metro
- Dallas-Fort Worth-Arlington, TX
- Population (ZIP)
- 60,352
- Household income
- $90,718
- Rent vs Own
- Severe rent burden
- 1857.0
Population outlook (Tarrant County) Hauer SSP2
- Today (2025)
- 2,380,417 people
- By 2030
- 2,578,900 · +8.3%
- By 2040
- 2,974,995 · +25.0%
- By 2050
- 3,350,489 · +40.8%
- By 2075
- 4,216,909 · +77.2%
- By 2100
- 4,741,527 · +99.2%
Race, ethnicity, and origin ACS 2023
- Neighborhood character
- Highly diverse neighborhood (Simpson 0.70)
- Race & ethnicity
- White 46% Hispanic / Latino 24% Black 15% Two or more races 13% Asian 10%
- Hispanic origin (detail)
- Mexican 18% Puerto Rican 1%
- Common ancestry
- Italian 2% Lithuanian 1% Slovak 1%
- Foreign-born
- 16% · Canada, Vietnam, South Korea
- Languages at home
- 74% English-only · Spanish 15% Other Indo-European 4% Vietnamese 2%
Political lean MEDSL · Tarrant
- 2024 margin
- Lean R (+5.1) · D 46.7% · R 51.9% · Other 1.4%
- 2008→2024 swing
- +6.6pp toward D · 2008: -11.7pp · 2024: -5.1pp
- All cycles
- 2024: R+5.1 2020: D+0.2 2016: R+8.7 2012: R+15.7 2008: R+11.7
Not yet ingested
- Civics
- —
Market trends
- HPI YoY
- ▼ -108.62%
- Current HPI
- 268.8753
- Rent YoY
- ▼ -1.37%
- Metro
- Dallas-Fort Worth-Arlington, TX
- State GDP YoY
- ▲ 3.95%
- F500 in state
- 110
Industry mix (Fortune 500 HQ in TX)
| Industry | F500 HQs | Revenue |
|---|---|---|
| Energy | 16 | $1,198B |
|
||
| Technology | 5 | $198B |
|
||
| Engineering / Construction | 4 | $72B |
|
||
| Energy Services | 3 | $60B |
|
||
| Utilities | 3 | $41B |
|
||
| Healthcare | 2 | $330B |
|
||
Price history
-6.4% since first listed9 events — show timeline
- 2026-05-14 Price Changed $220,000 NTREIS
- 2026-04-15 Price Changed $225,000 NTREIS
- 2026-03-20 Listed $235,000 NTREIS
- 2016-05-13 Sold (Public Records) — Public Records
- 2015-11-19 Sold (Public Records) — Public Records
- 2015-10-27 Sold (Public Records) — Public Records
- 1998-02-25 Sold (Public Records) — Public Records
- 1998-02-25 Sold (Public Records) — Public Records
- 1984-10-10 Sold (Public Records) — Public Records
Property tax history
+6.2%/yrLatest (2025): $5,778 · -0.9% YoY. Source: county tax records.
Cash-flow waterfall
monthlySold comps — $/sqft
last 12 mo · ≤1 miLoading sold comps…