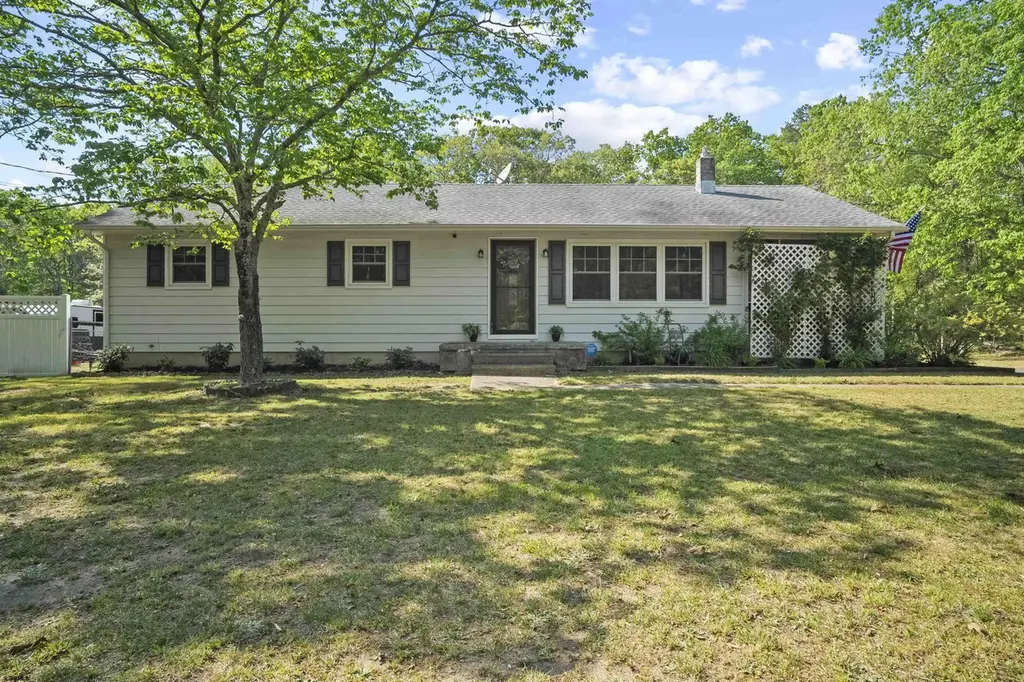
974 11th Ave · Estell Manor, NJ
Flood risk 1/10 · Minimal
- FEMA flood zone
- —
- Chance of flooding over 30 yrs
- 0.0%
- Est. flood insurance / yr
- —
Fire risk 7/10 · Major
- Est. fire insurance / yr
- $526 – $976
Heat risk 7/10 · Major
- Hot days now (above 103°F)
- 7 days/yr
- Hot days in 30 yrs
- 15 days/yr
Wind risk 8/10 · Major
- Chance of severe wind over 30 yrs
- 80.0%
Air-quality risk 2/10 · Minimal
- Unhealthy air days now
- 1 days/yr
- Unhealthy air days in 30 yrs
- 3 days/yr
Risk factors via First Street. Map © Google.
Why this score? — see what drove the D grade
The composite is a weighted blend of 9 inputs, each scored 0–100. Each bar is that input's sub-score; the figure is the points it added to the 100-point composite (weight × sub-score).
- Appreciation +10.0/10.0
- ARV discount +7.5/15.0
- Cash flow +7.3/30.0
- Schools +4.5/10.0
- Livability +3.2/5.0
- Rent growth +2.5/5.0
- Condition / age +2.5/5.0
- 1% rule +1.7/10.0
- DSCR +1.4/10.0
$389,000
🖨 Deal sheet (PDF) 📄 Offer letter ✓ Due diligence
Listing remarks MLS
Well maintained rancher with hardwood floors throughout. Spacious screened in porch, plus full basement, partially finished and detached garage/workshop. Seller installed a new septic in 2016. Move in ready. Estelle Manor Schools.
Key facts
- Kayak launches
- Gas stove
- Single-level living
Tags
Property features AI
Finance
- Other: Lead-based paint disclosure on file; Seller's property condition disclosure on file
Exterior
- Parking: One-and-a-half car garage; Exterior parking for three or more cars
- Utilities: Well water; Septic sewer; Gas water heater
- Home design: Single-family property; Property listed for sale
- Construction: Vinyl siding
- Exterior features: Fenced yard; Screened porch; Blacktop driveway
Interior
- Kitchen: Dishwasher; Gas stove; Microwave; Refrigerator; Eat-in kitchen with pantry
- Bedrooms: Master bedroom on first floor
- Flooring: Hardwood; Tile
- Bathrooms: 1 full bathroom; 1 half bathroom
- Heating & cooling: Central air conditioning; Forced air heating (natural gas)
- Interior features: Den/TV room; Eat-in kitchen; Pantry; Recreation/family room; Partially finished basement
- Laundry & utility: Washer; Dryer
Neighborhood map
What this means for you Summary
Snapshot
- This is a 3-bed/1.5-bath single-family listed at $389k.
Deal economics
- At list price, monthly cash flow is $-522 ($-6k/yr) — negative.
- To cash-flow at today's rent, offer at most $297k (23.7% below list).
- To meet the 1% rule (rent ≥ 1% of price), the offer needs to be $260k (33.1% below list).
- Recommended offer: $260k (33.1% below list) — sets the bar for 1% rule.
- Cap rate 4.7% vs local median 6.1% in Estell Manor — below-typical yield; the buyer is paying a premium for something (appreciation thesis, condition, location) that the cap rate doesn't capture.
Location & tenants
- Location reads 64/100 on livability (#414 in NJ) — a middle-class / working-renter tenant base. Strengths: crime A+, employment A+, housing A+; Watch: amenities F, commute F, cost of living F.
- Estell Manor School District (rural): math 40% / reading 55% proficiency, ranked #383 of 612 in NJ (top 63%) — families likely to look elsewhere, expect single-tenant / working-renter base with shorter leases; only 13% free/reduced lunch — higher-income household profile.
- Zoned schools: Estell Manor Elementary School (math 17% / reading 52%, grade F, #582 of 1,303 statewide, top 49%, 177 students, 16% FRL) — zoned schools at 16% FRL track the district average.
- Zoned-school proficiency averages 34% at this address vs 48% district-wide (-13 pts) — the specific schools serving this property underperform the Estell Manor School District average; the district grade overstates school quality for this exact location.
- Market conditions: 244 active listings in the ZIP; solid renter incomes; 672 units permitted in Atlantic County in 2024 (258 in 5+ unit buildings).
Forward outlook
- In year one you build about $42k of equity ($3k loan paydown + $39k appreciation (10.0% local appreciation)).
- Atlantic County population projected at -12% by 2050 — secular population decline; favor cash flow + early exit over multi-decade hold.
- By year 2, paydown + projected appreciation supports a ~$67k cash-out refi (75% LTV) — recoverable capital for the next deal without selling this one.
Negotiation context
- It's been on market 30 days — a 2% lower offer ($383k) is reasonable based on typical stale-listing flexibility.
- 2 sale attempts since 7y ago with the ask held roughly flat each time — persistent listings suggest the price (not the market) is what's stuck; bring a comps-based counter.
- Current owner paid $190k; list at $389k implies a 105% gain — meaningful room to come down on a strong offer.
Risks & watch-outs
- Climate carrying-cost: severe wind risk, 80% chance of damaging wind over 30y; major wildfire risk; extreme-heat days projected 7→15/yr by 2055 (HVAC capex compounding) — expect insurance premiums to compound above CPI over the hold.
Questions for the listing agent
- What do current leases actually rent for vs. the listed asking? Can we see a recent rent roll and the last 12 months of T-12 income?
- Built in 1962 — when were the roof, HVAC, electrical panel, plumbing, and water heater last replaced?
- Is there a deadline driving the sale (1031 exchange, divorce, estate, relocation)? That informs how much negotiation room exists.
- The area grade is low — what's the realistic commute time and amenity access for the typical tenant pool here? Any planned neighborhood developments (good or bad) we should know about?
- What's the average days-on-market for RENTAL listings here right now (not sales)? A rising rental-DOM trend means longer vacancies and softer asking-rent achievability than the comps imply.
- What's the recent tenant-quality profile in this submarket — average credit score on applications, eviction rate, late-payment / NSF rate, and stable-employment percentage? A property-management company in the area should have these aggregated.
- How much new for-sale + rental construction is in the pipeline within 1–3 miles? Heavy new supply typically softens prices + rents 12–24 months out; constrained supply supports both.
Investment metrics
- 1% rule
- 0.67% ✗
- Cap rate
- 4.68%
- Cash-on-cash
- -5.75%
- DSCR
- 0.74
- GRM
- 12.5
CMA / ARV
No comps found within radius.
Projected returns pro-forma
10.0% appreciation · 3.0% rent growth · sell at horizon
- IRR
- 20.2%
- Equity multiple
- 2.64×
- Total profit
- $178,601
- Equity at exit
- $350,442
- IRR
- 18.4%
- Equity multiple
- 6.07×
- Total profit
- $552,025
- Equity at exit
- $755,741
Cash invested: $108,920 (down + closing). Projections, not guarantees.
Landlord ↔ Tenant lean methodology
- Overall (STATE)
- 21 Tenant-Leaning
- State New Jersey
- 21 Tenant-Leaning · D+6
- County
- — inherits STATE
- City
- — inherits STATE
ZIP-level market 08330
- Home prices YoY
- 3.9%
- Active inventory
- 244
- Price-to-rent
- 12.5×
Monthly cashflow live
- Estimated rent
- $2,603 medium interval (Pro) →
- Mortgage (P&I)
- −$2,040
- Tax from tax record
- −$376 /mo · $4,512/yr
- Insurance
- −$162
- HOA
- −$0
- Vacancy / Maint / Mgmt
- −$547
- Net cashflow
- $-522
Break-even live
Sensitivity live
| Price | -10% $-302 | -5% $-412 | +0% $-522 | +5% $-632 | +10% $-742 |
|---|---|---|---|---|---|
| Rent | -10% $-727 | -5% $-625 | +0% $-522 | +5% $-419 | +10% $-316 |
| Rate | -1.0pp $-326 | -0.5pp $-423 | base $-522 | +0.5pp $-623 | +1.0pp $-725 |
UW: 25.0% down · 7.5% · 30yr · 1.5% tax · 5.0% vac · 8.0% maint · 8.0% mgmt
Financing live
Cash to close
- Down payment
- $97,250
- Closing costs
- $11,670
- Reserves months
- —
- Total cash needed
- —
Loan-product check · same deal, 3 products live
Conventional
25% down · 7.5% · 30yr
- Down + closing
- —
- Monthly P&I
- —
- Monthly cashflow
- —
- DSCR
- —
- Eligible?
- —
Personal DTI + credit; lowest rate.
DSCR
20% down · 8.5% · 30yr
- Down + closing
- —
- Monthly P&I
- —
- Monthly cashflow
- —
- DSCR
- —
- Eligible?
- —
No personal income docs; deal must DSCR.
Hard money
10% down · 12.0% · 12mo
- Down + closing
- —
- Monthly P&I
- —
- Monthly cashflow
- —
- DSCR
- —
- Eligible?
- —
Short-term bridge; refi at stabilization.
Listing history 25 events
-
2026-06-22days on market $389,000 Under Contract 30 DOM
-
2026-06-19days on market $389,000 Under Contract 28 DOM
-
2026-06-18days on market $389,000 Under Contract 27 DOM
-
2026-06-17days on market $389,000 Under Contract 26 DOM
-
2026-06-16days on market $389,000 Under Contract 25 DOM
-
2026-06-15days on market $389,000 Under Contract 24 DOM
-
2026-06-14days on market $389,000 Under Contract 22 DOM
-
2026-06-13days on market $389,000 Under Contract 21 DOM
-
2026-06-10days on market $389,000 Under Contract 19 DOM
-
2026-06-09days on market $389,000 Under Contract 18 DOM
-
2026-06-08days on market $389,000 Under Contract 17 DOM
-
2026-06-07days on market $389,000 Under Contract 16 DOM
-
2026-06-05days on market $389,000 Under Contract 13 DOM
-
2026-06-03days on market $389,000 Under Contract 12 DOM
-
2026-06-02days on market $389,000 Under Contract 11 DOM
-
2026-06-01days on market $389,000 Under Contract 10 DOM
-
2026-05-31statusdays on market $389,000 Under Contract 9 DOM
-
2026-05-30days on market $389,000 Active 8 DOM
-
2026-05-21$389,000 Active
-
2019-10-21soldstatus $189,900
-
2019-08-31historical 230-char remark
Show marketing remark (230 chars)
Well maintained rancher with hardwood floors throughout. Spacious screened in porch, plus full basement, partially finished and detached garage/workshop. Seller installed a new septic in 2016. Move in ready. Estelle Manor Schools.
-
2019-08-30soldstatus $189,900 Closed 230-char remark
Show marketing remark (230 chars)
Well maintained rancher with hardwood floors throughout. Spacious screened in porch, plus full basement, partially finished and detached garage/workshop. Seller installed a new septic in 2016. Move in ready. Estelle Manor Schools.
-
2019-07-12status Pending 230-char remark
Show marketing remark (230 chars)
Well maintained rancher with hardwood floors throughout. Spacious screened in porch, plus full basement, partially finished and detached garage/workshop. Seller installed a new septic in 2016. Move in ready. Estelle Manor Schools.
-
2019-06-28$189,900 Active 230-char remark
Show marketing remark (230 chars)
Well maintained rancher with hardwood floors throughout. Spacious screened in porch, plus full basement, partially finished and detached garage/workshop. Seller installed a new septic in 2016. Move in ready. Estelle Manor Schools.
-
1982-06-01soldstatus $57,500
ⓘ Source: listings_history table (triggers on properties + properties_extension) + one-shot
backfill from property_details.listing_events for pre-trigger history.
Tax reassessment forecast NJ · Partial reset (capped growth)
- Current annual tax
- $4,512 · $376/mo
- Projected year-2 tax
- $7,099 · $592/mo
- Expected delta
- +$2,587/yr (+$216/mo · 57.3%)
ⓘ Screening estimate from a state-policy table — verify with the county assessor before closing.
Climate risk First Street
- Flood 1/10 Low 0% chance over 30 yrs
- Wildfire 7/10 Severe
- Heat 7/10 Severe 7 d/yr ≥103°F today · 15 d/yr by 30 yrs out
- Wind 8/10 Severe 80% chance of damaging wind over 30 yrs
- Air quality 2/10 Low 1 unhealthy d/yr today · 3 by 30 yrs out
Nearby sold comps map
Loading sold comps map…
Walkable amenities ~0.75 mi
Loading nearby amenities…
Taxation est. · year 1
- Rental income
- $31,235
- − Mortgage interest
- −$21,790
- − Property taxes
- −$4,512
- − Insurance
- −$1,945
- − Repairs & maintenance
- −$2,499
- − Management
- −$2,499
- − Depreciation
- −$11,316
- Taxable loss
- −$13,326
- Est. tax savings @ 24.0%
- +$3,198
- After-tax cash flow
- $-3,063/yr
For passive investors: Depreciation is non-cash, so a rental often shows a tax loss while cash-flowing — sheltering income. Rental losses are passive: they offset passive income freely, and up to $25,000/yr can offset ordinary (W-2) income if you actively participate and your MAGI is under $100k (phasing out to $0 by $150k); unused losses carry forward. On sale, claimed depreciation is recaptured at up to 25%, and gains may owe capital-gains tax (a 1031 exchange can defer both). Figures are a year-1 estimate at your 24.0% rate — not tax advice; consult a CPA.
Schools (NCES district)
- District
- Estell Manor School District
- NCES district ID
- 3404860
- Math proficiency
- 40% ▬ 0.00%
- Reading proficiency
- 55% ▬ 0.00%
- Median HH income
- $77,037
- Composite
- 45.38/100
- National rank
- #5715
- State rank
- #383 of 612 in NJ
Livability — Estell Manor
- Score
- 64/100
- State rank
- #414
- US rank
- #14535
Category grades
Schools grade is shown separately in the Schools card above.
Census & demographics
- Census place
- Estell Manor, NJ
- County
- Atlantic County · 143,611 people
- City population
- 1,269
- Metro
- Atlantic City-Hammonton, NJ
- Population (ZIP)
- 29,972
- Household income
- $77,167
- Rent vs Own
- Severe rent burden
- 1003.0
Population outlook (Atlantic County) Hauer SSP2
- Today (2025)
- 268,948 people
- By 2030
- 264,497 · -1.7%
- By 2040
- 252,261 · -6.2%
- By 2050
- 237,846 · -11.6%
- By 2075
- 210,650 · -21.7%
- By 2100
- 180,234 · -33.0%
Race, ethnicity, and origin ACS 2023
- Neighborhood character
- Diverse neighborhood (Simpson 0.62)
- Race & ethnicity
- White 58% Hispanic / Latino 16% Black 14% Two or more races 13% Asian 4%
- Hispanic origin (detail)
- Puerto Rican 7% Dominican 4%
- Common ancestry
- Romanian 3% Italian 2% Lithuanian 1%
- Foreign-born
- 9% · Canada, Vietnam, Guatemala
- Languages at home
- 84% English-only · Spanish 10% Tagalog/Filipino 1% Other Indo-European 1%
Political lean MEDSL · Atlantic
- 2024 margin
- Toss-up / Even · D 47.7% · R 50.7% · Other 1.6%
- 2008→2024 swing
- -18.1pp toward R · 2008: 15.1pp · 2024: -3.0pp
- All cycles
- 2024: R+3.0 2020: D+6.7 2016: D+6.2 2012: D+17.2 2008: D+15.1
Not yet ingested
- Civics
- —
Market trends
- HPI YoY
- ▲ 11.58%
- Current HPI
- 308.5148
- Rent YoY
- —
- Metro
- Atlantic City-Hammonton, NJ
- State GDP YoY
- ▲ 2.05%
- F500 in state
- 34
Industry mix (Fortune 500 HQ in NJ)
| Industry | F500 HQs | Revenue |
|---|---|---|
| Consumer Goods | 3 | $31B |
|
||
| Pharmaceuticals | 2 | $153B |
|
||
| Technology | 2 | $21B |
|
||
| Insurance | 2 | $20B |
|
||
| Healthcare | 2 | $19B |
|
||
| Financial Services | 1 | $70B |
|
||
Price history
+576.5% since first listed7 events — show timeline
- 2026-05-21 Listed $389,000 SJSRMLS
- 2019-10-21 Sold (Public Records) $189,900 Public Records
- 2019-08-31 Listing Removed — BRIGHT MLS
- 2019-08-30 Sold (MLS) $189,900 BRIGHT MLS
- 2019-07-12 Pending — BRIGHT MLS
- 2019-06-28 Listed $189,900 BRIGHT MLS
- 1982-06-01 Sold (Public Records) $57,500 Public Records
Property tax history
+2.3%/yrLatest (2025): $4,512 · +1.8% YoY. Source: county tax records.
Cash-flow waterfall
monthlySold comps — $/sqft
last 12 mo · ≤1 miLoading sold comps…